Development of an
In-field
Tr~e
Imaging
System
.
A thesis
presented in partial fulfilment
of the requirements for the degree
of
Master of Technology
at
Massey University
By
Marijn Weehuizen
1996
MASSEY UNIVERSITY
11111111111111111111111111111
~
Abstract
Quality inventory information is essential for optimal resource utilisation in the forestry industry. In-field tree imaging is a method which has been proposed to improve the preharvest inventory assessment of standing trees. It involves the application of digital imaging technology to this task. The method described generates a three dimensional model of each tree through the capture of two orthogonal images from ground level. The images are captured and analysed using the "TreeScan" in-field tree imaging system. This thesis describes the design, development, and evaluation of the TreeScan system. The thesis can also be used as a technical reference for the system and as such contains appropriate technical and design detail.
The TreeScan system consists of a portable computer, a custom designed high resolution scanner with integral microcontroller, a calibration rod, and custom designed processing software. Images of trees are captured using the scanner which contains a CCD line scan camera and a precision scanning mechanism. Captured images are analysed on the portable computer using customised image processing software to estimate real world tree dimensions and shape.
Table of Contents
Abstract --- iii
Table of Contents --- v
List of Figures --- viii
List of Tables --- xi
Publications --- xi
Aclmowledgements --- xiii
Glossary --- xvii
CHAPTER 1 - INTRODUCTION AND BACKGROUND --- 1
1 . 1 Scope of Research --- 2
1. 2 Thesis Overview --- 2
1.3 Forest Industry Background --- 4
1. 3. 1 Introduction --- 4
1. 3. 2 Forestry and Sawmilling --- 5
1. 3. 3 Forest Operations --- 5
1 . 3 .4 Inventory Assessment --- 6
1.4 Preharvest Inventory Assessment --- 7
1.4.1 MARYL Inventory Assessment --- 8
1.4.2 Weaknesses of the MARYL System --- 9
1 .4. 3 Possible Improvements --- 11
CHAPTER 2 - IMPROVED FOREST ST AND ASSESSMENT DESIGN PROPOSAL --- 13
2.1 In-field Tree Imaging to Improve Stand Assessment --- 14
2.1.1 Previous Research on Standing Tree Imaging --- 15
2. 2 General Technology Options --- 16
2.2.1 Massey University Feasibility Study --- 16
2. 2. 2 Alternative Approach --- 18
2. 3 Design Constraints --- 21
2.3 .1 Constraints Imposed by Forest Conditions --- 21
2.3.2 Constraints Imposed by Technology Limitations --- 22
2. 4 Proposed System --- 24
2.4. l Improved Assessment Outline --- 24
2.4.2 Proposed Image Capture System overview --- 24
2. 5 Design specification --- 26
CHAPTER 3 -TREESCAN DESIGN CONSIDERATIONS AND THEORETICAL FOUNDATIONS --- 27
3. 1 Design Overview --- 28
3 .1. 1 Systems Integration Project --- 29
3.2 TreeScan Operating Principle --- 31
3. 2. 1 TreeScan Estimates --- 3 3 3. 3 Image Capture --- 3 5 3. 3. 1 Digital Image Capture --- 35
3. 3. 4 Optical Considerations --- 41
3. 3. 5 Image Focus --- 45
3. 4 Image Transfer and Storage --- 46
3 .4. 1 Scanner Interface --- 46
3. 4. 2 Image Storage --- 4 7 3 .5 Parameter Extraction --- 48
3. 5. 1 Image Calibration --- 49
3.5.2 Planar Transformation Distortion Correction --- 51
3.5 .3 Geometric Distortion Correction --- 53
3. 6 Three Dimensional Model Construction --- 57
3. 7 Implications of Image Capture Geometry --- 58
3. 7 .1 Tree Plane Variation --- 61
3. 7. 2 Calibration Alignment Variation --- 62
3.7 .3 Image Processing and Feature Marking Precision --- 64
CHAPTER 4 - TREESCAN HARDWARE --- 67
4.1 TreeScan Hardware Overview --- 68
4. 2 Scanner Hardware Overview --- 70
4.2.1 Scanner Controller Board --- 74
4. 3 Microcontroller Subsystem --- 7 5 4.3.1 Microcontroller Subsystem Memory Organisation --- 77
4.3.2 Microcontroller Subsystem Memory Timing --- 78
4 .4 SCSI Subsystem --- 80
4.4. l Implementing SCSI : Design Specifications --- 82
4.4.2 SCSI Bus Controller ( SN75C091A) --- 85
4.4.3 SCSI Subsystem Development Obstacles --- 86
4. 5 Line Scan Camera Subsystem --- 87
4. 5. 1 Imaging Sensor Spectral Response --- 90
4.5.2 Line Scan Camera Subsystem Signal Timing --- 90
4. 6 Additional Hardware --- 92
4. 6. I Scanning Mirror Subsystem --- 92
4. 6. 2 Lens Subsystem --- 95
4.6.3 Power Supply Subsystem --- 98
4. 6. 4 User Feedback --- 101
4. 6. 5 Scanner Chassis --- l 02 4. 6. 6 Carrying Cases --- 103
4. 7 Hardware Development Environment --- 103
CHAPTER 5 - TREES CAN SOFIW ARE --- 105
5. 1 TreeScan Software Overview --- 106
5 .2 Image Capture Software --- 108
5. 2. 1 Overview --- --- 108
5 .2.2 Image Build-up Algorithm --- 111
5.2.3 Image Block Capture Algorithm (Microcontroller) --- 114
5. 2 .4 SCSI Transfer Algorithm --- 118
5. 2. 5 Focus Algorithms --- 126
5. 2. 6 TreeScan Plug-in Software --- 129
5. 2. 7 Microcontroller Software --- 131
5. 3 Tree parameter Extraction Software --- 13 2 5. 3. 1 Overview --- 132
5. 3. 2 Image Calibration --- 13 3 5.3.3 Feature Size Estimation in Two Dimensions --- 135
5 .3. 6 TreeScan Macros --- 140
5. 3. 7 NIH Image Source Additions and Modifications --- 141
5. 4 Software Development Environment --- 14 2 CHAPTER 6 -TREESCAN EVALUATION --- 143
6. 1 Overview of Evaluation --- 144
6. 2 Sequence of Evaluation Experiments --- 145
6. 3 Hardware Calibration --- 147
6. 3. 1 Scanner Component Alignment --- 14 7 6. 3. 2 Measurement of Step Angle --- 149
6. 4 TreeScan Characterisation --- 151
6 .4. 1 Image Capture Timing --- 151
6 .4. 2 TreeScan Resolution --- 153
6.4.3 Integration Time Adjustment --- 155
6 .4 .4 Focus Tests --- 156
6.5 Initial Accuracy Tests in Two Dimensions --- 157
6. 6 Final Accuracy Tests in Two Dimensions --- 158
6. 7 Accuracy Tests in Three Dimensions --- 160
CHAPTER 7 -FORESTRY IMPLICATIONS AND RECOMMENDATIONS --- 161
7. 1 TreeScan Strengths and Limitations --- 162
7. 2 Forestry Implications --- 166
7 .3 Alternative Technology Uses --- 168
7.4 Future Work --- 169
CHAPTER 8 -SUMMARY --- 171
8. 1 Summary --- 172 REFERENCES --- 1 7 5
Appendix A Appendix B Appendix C AppendixD AppendixE Appendix F Appendix G Appendix H Appendix I Appendix J Appendix K AppendixL AppendixM Appendix N
Development Documentation for the TreeScan System Sample Tree Analysis
Forestry Terms
Original TreeScan Project Proposal System Error Calculations
TreeScan System Component List TreeScan Schematics & Board Layout
Microcontroller Specifications and Memory Space Organisation Additional SCSI Interface Specifications
SCSI Bus Controller Specifications Macintosh SCSI Manager
SCSI Byte Loss Detection and Resend Scheme Scanner Control Software
Figure 1.1 Figure 2.1 Figure 2.2 Figure 2.3 Figure 2.4 Figure 2.5
List of Figures
- Information loss inherent in the MARYL tree description --- 10
- Imaging technologies --- 17
- Effects of wind on captured images --- 19
- Alternative image capture approaches --- 20
- Improved forest stand assessment overview --- 24
- Image capture system principle --- 25
Figure 3.1 - Possible areas of technical difficulty --- 28
Figure 3.2 - TreeScan image capture --- 31
Figure 3.3 -Projection on a two dimensional plane --- 32
Figure 3.4 - TreeScan estimates --- 33
Figure 3.5 - Digital image capture __________________________________________ _: _________ 35 Figure 3. 6 - CCD technology --- 36
Figure 3.7 -Photographic image capture distortion --- 38
Figure 3.8 - TreeScan image capture distortion --- 39
Figure 3.9 - Depth of field --- 42
Figure 3 .10 - Modulation transfer function and relative illumination --- 44
Figure 3.11 - Definition of terms --- 49
Figure 3.12 - Simple perspective correction --- 51
Figure 3.13 - Two step perspective correction --- 52
Figure 3 .14 - Geometric correction using derived 0 --- 53
Figure 3.15 - Correction based on calibration rod dimensions --- 54
Figure 3.16 - Distortion correction imprecision --- 55
Figure 3.17 - Measurement of angle 0 --- 56
Figure 3 .18 - Three dimensional model generation --- 57
Figure 3.19 - Image capture geometry --- 59
Figure 3 .20 - Tree plane variation --- 61
Figure 3.21 - Calibration alignment variation --- 62
Figure 4.1 - TreeScan system ready for image capture --- 69
Figure 4.2 - TreeScan scanner functional block diagram --- 70
Figure 4.3 - The scanner internal layout --- 71
Figure 4.4 - System signal flow diagram --- 73
Figure 4.5 - Scanner controller board layout --- 74
Figure 4.6 - Microcontroller block diagram schematic --- 76
Figure 4.7 - Microcontroller memory map --- 77
Figure 4.8 - EPROM read cycle timing --- 78
Figure 4.9 - SCSI block diagram schematic --- 81
Figure 4.10 - Typical command descriptor block --- 84
Figure 4.11 - Imaging sensor photosite layout --- 88
Figure 4.12 - LSC interface block diagram schematic --- 89
Figure 4.13 - CCD sensor spectral response --- 90
Figure 4.15 -Scanning mirror assembly --- 92
Figure 4.16 - Stepper motor controller block diagram schematic ---94
Figure 4.17 - Mkl and Mk2 lens systems --- 95
Figure 4.18 -Mk 1 and Mk2 lens driving interface ---97
Figure 4.19 - Power supply block diagram schematic --- 99
Figure 4.20 -Scanner chassis --- 102
Figure 4.21 - Hardware development environment ---104
Figure 5 .1 - Levels of TreeScan software --- 107
Figure 5.2 - Algorithms implemented in image capture software --- --- 108
Figure 5.3 - Image build-up sequence ---111
Figure 5 .4 - Image build-up algorithm --- 112
Figure 5 .5 - Image build-up algorithm (description) --- 113
Figure 5.6 - Image block capture algorithm --- 114
Figure 5.7 -Image block capture algorithm (description) --- 115
Figure 5.8 - Line signal timing --- 116
Figure 5.9 - AID signal timing --- 117
Figure 5 .10 -AID conversion (8 bit) microcontroller code --- 118
Figure 5.11 - Normal SCSI transfer --- 120
Figure 5.12 - Normal SCSI transfer (description) --- 121
Figure 5 .13 -Image with byte loss problem --- 122
Figure 5.14 - Extended delays during SCSI transfer --- 124
Figure 5.15 - Byte loss detection and resend scheme --- 125
Figure 5.16 -Final autofocus algorithm --- 127
Figure 5.17 -TreeScan image capture user interface --- 129
Figure 5.18 - Parameter extraction sequence --- 132
Figure 5.19 -Marking of calibration points --- 134
Figure 5.20 - Two dimensional feature size estimates --- 135
Figure 5 .21 -Generation of three dimensional stem model --- 137
Figure 3.22 - Sweep estimation from displayed tree model --- 138
Figure 5.23 - TreeScan processing and utility macros --- 123
Figure 6.1 Figure 6.2 Figure 6.3 Figure 6.4 Figure 6.5 Figure 6.6 Figure 6.7 Figure 6.8 Figure 6.9 -Distortion introduced by camera misalignment --- 14 7 -Camera alignment procedure --- 148
-Distortion introduced by mirror misalignment --- 149
- Image capture timing --- 152
- Image resolution effects --- 154
- Integration time adjustment --- 155
- Focus results --- 156
- Height errors with high imprecision --- 157
List of Tables
Table 2.1 - System design contraints --- 21
Table 3.1 - Standard f-numbers --- 41
Table 3.2 - Image acquisition time vs. data transfer rate --- 46
Table 3.3 - Scanner interface methods --- 47
Table 3.4 - Comparison of distortion correction methods --- 48
Table 3.5 - Sources of expected error in TreeScan --- 60
Table 3 .6 - Height errors introduced by stem displacement --- 61
Table 3.7 - Width errors introduced by stem displacement --- 62
Table 3.8 - Errors introduced by variation in measured angle --- 63
Table 3.9 - Errors introduced by distance error --- 64
Table 4.1 - Availability of SCSI bus controllers --- 80
Table 4.2 - Line scan cameras available --- 87
Table 4.3 - Scanner power requirements --- 100
Table 6.1 - Measured pixel resolution --- 153
Table 7.1 - TreeScan strengths and limitations --- 163
Publications
The following publications were prepared during the research for this thesis:
• Weehuizen, M., Pugmire, R.H. (1994): The use of in-field tree imaging in the
pre-harvest inventory assessment in the logging industry, Proceedings of New
Zealand Postgraduate Conference for Engineering and Technology Students,
Department of Production Technology, Massey University, 1994.
• Weehuizen, M., Pugmire, R.H. (1994): The use of in-field tree imaging in the
pre-harvest inventory assessment in the logging industry, Proceedings of the
Second New Zealand conference on Image Vision and Computing, Department of
Acknowledgements
I would like to thank all the people who have been involved with the Tasman project
over the last two years for making this research and development possible.
In particular I would like to thank my two supervisors Prof. Bob Hodgson and
Dr. Ralph Pugmire for their valuable support and their vision in the project guidance.
Thanks to Ralph Pugmire for his help during the many hours spent of poring over the
'unexplainable' development obstacles.
The contribution of Thomas Look was invaluable in the design and engineering of the
mechanical components of the system.
Thanks also to the Gary Allen for the time spent constructing and testing the electronic
aspects of the TreeScan system, and to Farshad Nourozi for his input into the design of
the system.
I would also like to thank Tasman Forestry Ltd. for their backing of the development of
the TreeScan system and continued support for further research. In particular I would like to thank Mike Colley (unfortunately moved on early in the project) for initiating the
commitment of Tasman Forestry to in-field tree imaging.
Lastly, but certainly not least, I would like to thank Diana Foster for her editing skills
on many chapter drafts and her unfaltering commitment whenever the project demanded
I must go down to the seas again, to the lonely sea and the sky,
And all I ask is a tall ship and a star to steer her by,
And the wheel's kick and the wind's song and the white sail's shaking,
And a grey mist on the sea's face and a grey dawn breaking.
I must go down to the seas again, for the call of the running tide
Is a wild call and a clear call that may not be denied;
And all I ask is a windy day with the white clouds flying,
And the flung spray and the blown spume, and the sea-gulls crying.
I must go down to the seas again, to the vagrant gypsy life,
To the gull's way and the whale's way where the wind's like a whetted knife;
And all I ask is a merry yarn from a laughing fellow-rover,
And quiet sleep and a sweet dream when the long trick's over.
11
Sea-Fever 11
Glossary
AID Analog to Digital, used as ND convertor.
CCD Charge Coupled Device
CMOS Complementary Metal Oxide Semiconductor
EPROM Erasable/Programmable Read Only Memory
Kink A short deflection of a log affecting less than 2 m of the log (see
appendix C).
Log A single section from a tree stem which has been cut into sections. A tree
stem is cut into a number of logs for transport to the mill (typically 6-12 m
in length).
Log grade A measure of log quality and value. Each log grade has specifications which a log must meet (see appendix C).
LSC
MARVL
Plug-in
RAM
ROM
sec
SCSI
SED
Stem
Sweep
Wobble
Line Scan Camera
Method of Assessment based on Recoverable Volume by Log type. The preharvest inventory system used by many forestry companies.
Macintosh code resource which complies with the Adobe interface
specification and may be used to extend applications.
Random Access Memory
Read Only Memory
Scanner Control Command
Small Computer Systems Interface, a high speed flexible computer interface commonly used to connect peripheral devices to computers.
Small End Diameter, minimum diameter of a log.
A tree which has been felled but not yet cut into logs.
Deviation from straightness along a length of log (see appendix C).
Deviation from straightness of a log where the axis of a log deviates in two
or more directions (see appendix C).
INTRODUCTION
AND
BACKGROUND
1. 1 Scope of Research --- 2
1.2 Thesis Overview --- 2
1.3 Forest Industry Background --- 4
1. 1 Scope of Research
The strategic objective of this research is to improve forest stand assessment by using
imaging techniques to make the preharvest inventory assessment more quantitative. If
successful this will have a far reaching impact on mensuration in the forestry industry.
In order to make the preharvest inventory assessment more quantitative two aspects are
important; the dimensions of the standing radiata pine trees must be measured, and the
method used to calculate recoverable volume from tree dimensions must be modified.
The research for this masters project focuses on the development of a suitable image
capture and processing system which can be used to accurately estimate tree
dimensions.
More specifically, the objective of this masters project was to develop a line scan based
image capture system that would allow the dimensions of standing pine trees to be
estimated. As a result of this clearly defined objective this masterate has been a
technology development project rather than a theoretical research project.
1.2 Thesis Overview
The research and development for this study takes the project from the design concept
stage through the design and development stage up to the final testing stage. The
structure of the thesis reflects this design path.
Chapter 1 provides an introduction and context for the research. The scope of the
research is defined and a background to the forestry industry is provided with an
emphasis on the preharvest inventory assessment. This chapter presents a statement of
problem, independent of the proposed solution.
In chapter 2 alternative methods for improving inventory assessment are reviewed. The
approaches identified in a Massey University feasibility study are outlined and analysed
for design constraints. Based on this analysis a design proposal is put forward which
provides the basis of the subsequent development work.
In chapter 3 the design considerations and theoretical foundations upon which the
development is based are explored. This chapter describes how the system works in
principle and proves that the solution is technologically feasible. Key areas of technical
Chapter 4 describes the hardware of the TreeScan system, with an emphasis on the
custom designed scanner. Functional blocks of the scanner are described in detail and
the reasons for this particular implementation are presented. In addition to this the
obstacles encountered during hardware development are briefly discussed.
In chapter 5 the algorithms implemented in the TreeScan software are described. This
includes both the image capture software used to capture images with the scanner and
the parameter extraction software which is used to estimate actual tree dimensions.
Chapter 6 is an evaluation of the system accuracy and discusses the modifications made
to convert the scanner, as originally designed and built, to an accurate scientific
instrument.
In chapter 7 possible implications of this technology on the forestry industry are
presented. Strengths and limitations of the TreeScan system are discussed and
recommendations are made regarding the future directions for this research and
development work.
To conclude the thesis, the main points of this research are summarised in chapter 8.
Relevant detailed technical documentation and software listings are included in the
appendices.
Unless noted to the contrary in the text, all work is the authors own work. This
includes; analysis of design considerations, system sensitivity analysis, design and
testing of all digital hardware, design and testing of the majority of analog hardware, all
rnicrocontroller software development, and the majority of the system evaluation tasks.
The development of the image acquisition plug-in, the distortion correction methods,
and the image processing macros were a joint effort between the author and his supervisor (Dr. Ralph Pugmire).
Notable tasks completed by other development team members were all mechanical
1. 3 Forest Industry Background
The aim of this section is to provide a forestry background to set the context for this
research. It is aimed at the reader with very little forestry experience, providing a brief
overview of key aspects of the industry. It is intended to be an introduction and does
not comprehensively cover all aspects of the forestry industry.
1.3.1
Introduction
Plantation forestry is the sector of forestry that deals with production forests.
Production forests are forests specifically planted with the aim of being harvested.
Plantation forestry does not include the felling of natural forests and is therefore a
sustainable and renewable industry.
Plantation forestry is a major export industry of New Zealand. In 1993 the export of
forestry products constituted New Zealand's third largest export earner, generating 2.5
billion dollars. This is almost on par with meat and dairy exports, 3.0 and 2.8 billion
dollars respectively (Forestry Facts & Figures, 1994).
New Zealand production forests are predominantly radiata pine (90% ), with smaller
quantities of douglas fir, softwoods, and native hardwoods. The New Zealand radiata
pine estate constitutes 34% of the global radiata pine estate (Forestry Facts & Figures,
1994). New Zealand radiata pine plays an important role in the New Zealand economy
and constitutes a large proportion of the global radiata pine market.
The main plantation forestry area in New Zealand is the Rotorua district in the Central
North Island with smaller scale forestry blocks scattered throughout the country. The
ownership of these forests is divided between three large forestry companies and a
significant number of smaller owners. The three largest owners are Fletcher Challenge
Ltd., Carter Holt Harvey Ltd., and the Forestry Corporation of New Zealand. They
own 16%, 25% and 13% of plantation forestry resources respectively (Forestry Facts
& Figures, 1994).
The forestry industry has seen a phenomenal growth over the last three years. This is
largely a result of increased international demand driving world timber prices up. As the
value of sawn timber rises, the value of the raw product also rises and it becomes
important to maximise the use of business resources. Good tree breakdown is no longer
1.3.2
Forestry and Sawmilling
The timber industry traditionally contains a clear distinction of roles. The role of
forestry operations is very different from the role of sawmilling operations.
• The role of forestry operations is to produce logs. In practise, forestry
operations includes the planting, growing, and maintenance of the trees during the
time they are growing. Once the trees are ready to harvest they are felled and cut
into logs of one of a number of specified grades (see appendix C).
• The role of the sawmilling operations is to process logs. The sawmilling
operations commence with the raw product of logs of a certain grade and process
these into sawn timber and other wood products.
The result of this division in the industry is that a sub optimal resource optimisation
may be achieved. If this division is reduced and the tree optimisation can be based on
final timber usage rather than log breakdown, resource optimisation could be improved.
Many companies are currently restructuring to reduce this division.
1.3.3
Forest Operations
The basic unit of measurement in the forestry industry is the stand. A stand is a block of
trees of similar age, size and other characteristics. Each forest is subdivided into even
aged stands of typically 20 to 40 hectares. Stands are harvested as a whole at a tree age
of 25 to 30 years.
The life cycle or rotation of a stand of radiata pine begins when the trees are planted. It
is split into three phases, with an inventory assessment made during each phase:
• Early growth during which pruning and thinning operations may be completed
• Mid rotation during which the trees are left to grow largely unattended
• Harvest during which the trees are felled
The early growth phase, 0 - 10 years, determines the quality of the trees in a stand.
Trees are pruned in successive lifts up to a maximum of 6 or 8 m. The result of pruning
is trees which grow straight and have large sections of clearwood. Clearwood is wood
which does not contain any knots or defects outside a defect core.
Stands will undergo two thinnings to select the best trees and reduce the stocking to a
level that will produce a maximum tree growth rate. The first thinning is at a tree age of
4 to 6 years, the second at 7 to 9 years.
During the mid rotation phase, 10 - 25 years, very little tree maintenance is required.
During the harvest phase, 25 - 30 years, the trees are felled to produce stems. These
stems are then cut into logs based on the current cutting strategy.
Once the trees in a stand are felled, the stems are taken to a skid site. A skid site is a small area of the stand which has been cleared and where the stems are cut into logs. Typically there will be several skid sites per stand. There are two primary methods of stem removal; the skidder and the hauler. A skidder is a large wheeled vehicle which drags the stems to the skid site. The hauler is a cable based pulling system which must be used when the terrain is too steep for a skidder.
On the skid site the stems are cut into logs. This breakdown is intended to optimise the use of a tree, but is a compromise between maximising value and meeting orders. The log maker decides on the best breakdown for a particular stem based on the log maker's assessment of stem shape and features, and the current log requirements. The total value of the recovered logs depends on the performance of the Jog makers. Generally the performance of a log maker is very good, typically 95% of optimal. If the performance of a log maker drops below this level, this results in a very large Joss in stem value.
Once the stem is cut into Jogs they are stacked until they can be trucked out of the forest.
1.3.4
Inventory Assessment
Assessing the value and potential yield of a stand of trees is one of the basic concerns of commercial forest growers. During each of the three phases in the stand life cycle an inventory assessment is made. This involves gathering information on a representative sample of trees from a particular stand.
The first inventory assessment is made during early growth phase, at a tree age of 4-10 years. This is the quality control inventory which allows the forest owner to check
that the pruning and thinning have been completed properly. Basic information is collected regarding the condition of the stand as a whole such as total tree stocking, tree diameter, tree height and the pruned height.
At a tree age of 15-16 years the mid rotation inventory assessment is made. This
enables the owner of the forest to gain information on the growth progress of the trees. The preharvest inventory assessment is made 1-2 years prior to harvest, at a tree
1. 4 Preharvest Inventory Assessment
As stands mature growers require detailed inventory information to plan harvesting, marketing and utilisation of the timber. Logs are cut on a 'to order' basis, with no buffering of stock on hand. This implies that good inventory information is necessary to determine what log grades can be expected from a particular stand. On a short term basis if there are not enough logs to meet a particular order, higher quality logs may be downgraded to fill the outstanding order. The result of this is a serious loss in profitability.
The aim of the preharvest inventory is to provide information regarding the value and quality of individual stands. This information is used in :
Harvest planning - The log grades which can be most profitably cut from a stand are estimated. Harvesting operations are planned based on which stand can provide the optimal Jog grades to meet particular orders.
Market planning - The volume of harvest, by log grade, is estimated up to three years ahead of harvest. Export contracts are based on the estimated volume of harvest.
Valuation - The absolute value of a particular forest block can be estimated from the inventory information. The value of a forest may need to be established if the forest is sold or if company assets are valued.
The assessment of total volume and quality should be based on the actual measured condition of the trees. The effect of disease and damage, and management operations such as pruning and thinning must be directly taken into account. However the data collected should be flexible enough to allow harvest to be estimated even if log specifications change after the inventory team has visited the stand.
There are two important aspects of any tree which must be measured in order to be able to estimate the optimal log breakdown; the shape of the stem, and the quality of the stem. The shape of the stem, or sinuosity, is defined by the amount of sweep and wobble the tree has (see glossary or appendix C). The quality of the stem is defined by the branch sizes, pruned height and defects such as rot, broken tops, forks and nodal swelling.
1.4.1
MARVL Inventory Assessment
MARVL was developed by the Forestry Research Institute of New Zealand in the
1970's in response to the need for a general purpose inventory tool and is now widely
used in Australia and the Pacific as well as New Zealand. It is based on the visual
assessment of a sample of trees. In addition to the visual assessment, a number of tree
parameters are measured. From this information log production estimates are calculated.
The MARVL system is a general purpose method which has been designed to allow
flexibility in its use (Deadman & Goulding, 1979). As result, each user of the MARVL
system has a slightly different implementation. The MARVL system involves three
steps: sampling, cruising, and estimating log production.
Sampling
A series of bounded plots are defined as a representative sample of the stand. Each plot
covers an area of 0.04 to 0.06 hectare, with a total of approximately 4% of the stand
area sampled. The number of plots per stand is based on stand area. A typical number
of plots per stand is 15, but can vary from 10 to 100.
Cruising
Once the plots have been established, a team of two people is sent out to assess each
plot. During the assessment the heights of two trees are measured using a clinometer,
stem diameter at breast height is measured for each tree and an visual assessment is
made for each tree.
The visual assessment estimates sinuosity (in three classes of sweep), and quality
features from the base of the tree. The sinuosity of the tree is recorded by describing the
stem as consisting of sections of estimated length with a given sweep class and branch
size class. For example:
• Sweep may be classified into three classes: <SED/4, SED/4-SED/2, >SED/2.
• Branch size may be classified into three classes: <7 cm, 7-14 cm, >14 cm.
There are a large number of quality features. Quality features include pruned height and
other defects such as rot, broken tops and forks (see appendix C). The height of each
feature of interest is estimated and recorded.
The measured and estimated parameters are entered into a portable computer used as a
Estimating log production
The recorded data is down-loaded from the data logger onto a computer running the
MARYL software to estimate log production. If necessary the trees are "grown on" to harvest age, using growth models. The data from each tree is individually processed to
calculate the best log breakdown. Essential cuts such as those at the position of forks
and stumps are made first with simulated felling breakage if required. The resulting
yield for the plots is statistically extrapolated to provide an estimate of recoverable
volume by log type of the entire stand.
1.4
.
2
Weaknesses of the MARVL System
The MARVL system provides essential information, however it has limitations. Several
aspects of the assessment are subjective, and the system has been developed to the point
where it is limited by this subjectivity. This has been the result of an increasing need for
more detailed and accurate inventory information and a greater variety of markets since
the system was developed.
The Jog volumes actually cut from a particular stand often do not match the log volumes
as predicted by MARVL. The total volume estimate is very good, typically within
±
5%, but the breakdown of this the volume by individual log types may vary between± 10% to ±80%. This is not solely due to the limitations of MARVL as logs actually cut
depend on a large number of interrelated factors. For example, a sub optimal cutting
strategy may have been used intentionally to fill a particular order.
The results of MARVL depend on:
The ability of crews to accurately estimate tree parameters.
Information loss inherent in the method of calling particular trees.
The ability of the MARVL software to extract the desired information from
the recorded descriptions.
Size of the sample and how representative this is of the stand.
MARVL depends largely on the accuracy of human estimates. Branch class, tree height and the height of quality features can be surprisingly accurately identified. The
greatest limitation of MARVL is that the estimation of sweep is subjective. Estimation
of sweep is difficult as it involves making an estimate of sinuosity in two dimensions
for sections of the tree. Two different people calling the same tree can give two different
classifications.
30 information disregarded I I I I I I I I I I I I I I I / / / /
I I
I I 30 shape Two sections with certain sweep
Sweep definition inadequate
or
Overall wobble Overall sweep [Assumed by
MARVL]
Figure 1.1 - Information loss inherent in the MARVL tree description
wo examples of this ambiguity are:
1 . MARVL is a two dimensional system. Three dimensional information is
disregarded. If a tree is called as consisting of two sections of certain sweep, this
could indicate the sweep is in the same plane or at right angles. This information
which has an important impact on the optimisation of stem breakdown is
disregarded (see figure 1.1).
2. Secondly the definition of sweep for different log lengths is inadequate. If a tree
is called as consisting of two sections of certain sweep, this could indicate one of
two situations. The tree could have a large sweep over the combined length or the
tree could have wobble over the combined length (see figure 1.1 ).
! the above situation MARVL is not able to extract necessary information from the log
!Scription, so a simplifying assumption is made. MARVL assumes that a long log of e same sweep class as the greatest sweep of its subsections can be cut. i.e. that the log
mtains wobble in a single plane.
istly the sample must be statistically representative of the stand. Often there is a large
triation of tree growth even within a stand. As a result the sampling procedure or
[image:23.581.54.461.61.289.2]1.4.3
Possible Improvements
In order to improve the forecasting system, one or more of the above weaknesses must
be targeted for improvement. If a more quantitative system can be provided which does not suffer from loss of information, this would mean a great improvement for the
preharvest inventory assessment.
A key consideration to maintaining high quality while retaining MARYL, is feedback to
the staff involved regarding the results of subjective estimates. The more frequent and
precise this feedback is the more successful it will be in maintaining the accuracy of the
subjective assessment. However this is difficult in the assessment of sweep. The only
reference to compare an assessment of a single tree, is how a more experienced person
would call the tree. Even if the tree is felled, the extent to which the sweep was called
correctly is difficult to determine.
In chapter two, several methods are proposed that can be used to improve the inventory
accuracy using a partially automated system. This will produce more accurate and
IMPROVED
FOREST STAND ASSESSMENT
DESIGN PROPOSAL
2.1 In-field Tree Imaging to Improve Stand Assessment --- 14
2.2 General Technology Options --- 16
2. 3 Design Constraints --- 21
2.4 Proposed System --- 24
2. 5 Design specification --- 26
This chapter reviews alternative imaging methods which could be used to improve
inventory assessment. The approaches identified by the Massey University feasibility
study are discussed in detail and analysed for design constraints. A final design
proposal is put forward providing the basis for the rest of the development.
2.1 In-field Tree Imaging to Improve
Stand Assessment
Over recent years the increase in computing power and improved digital image
processing techniques have led to the exponential growth of electronic tools making use
of digital image processing in many commercial and industrial applications.
The sawmilling operations of the timber industry have seen much development of
scanning technology within the sawmill. This includes the scanning of log profile for
optimised cross cutting, plank profiling for optimisation during edging and trimming,
and internal scanning of logs to detect defect core structure. However this technology
has made very little impact in the forestry industry. With in-field tree imaging this is
changing.
In-field tree imaging is a method proposed to apply digital imaging technology to
improve and automate forest stand assessment. This method involves generating a three
dimensional model of a standing tree by capturing one or more images from ground
level. This three dimensional model will provide more quantitative inventory
information.
The three dimensional model fully defines the tree shape including sweep. This
addresses the two main weaknesses of the MARVL based system as discussed in
chapter one; the need to make a visual assessment of sweep in the field disappears and
so human subjectivity is eliminated and there is no information loss. By removing the
human subjectivity, the inventory system will be able to make more repeatable and
accurate estimates of tree dimensions and as a result more quantitative inventory
Requirements of In-field Tree Imaging
If in-field tree imaging is to succeed the developers of a system will need to overcome a number of obstacles. These include the substantial technical difficulties in producing a working system that is robust enough to operate in a hostile forest environment.
The requirements of an in-field tree imaging system are that it must :
1 . Work under forest conditions.
2. Produce accurate and repeatable results.
3. Be usable and productive.
A system must be capable of working in conditions typically experienced in a forest. This includes dense tree stocking, terrain and undergrowth variation, outdoor weather conditions, tree movement in the wind, and low levels of ambient lighting.
The system must be technically capable of producing accurate results that are repeatable regardless of expected variation in normal operating conditions.
The first two requirements are most important at this stage, but the system must also be usable and productive. This involves ease of operation by non technical users, acceptable portability (weight and ease of carrying), and acceptable productivity compared with existing methods of inventory.
2.1.1
Previous Research on Standing Tree Imaging
As the inventory of forests is a universal problem it was expected that there would have been previous research on the use of imaging techniques to improve inventory methods. This was not the case. After a comprehensive search no reference has been found to any other development work in tree imaging, tree sizing, tree assessment, or forest inventory assessment using imaging techniques.
2.2 General Technology Options
There are a large number of technology options that could be employed to develop a system to meet the above requirements. However, no technology can be said to provide the best or the worst solution. The use of each technology has advantages and disadvantages which must be considered. What is required is the lowest cost, easily developed, sufficiently accurate technology. This involves judgements by the developers based on past experience.
The most important consideration is a cost versus technology trade-off. Certain technologies may be faster or more accurate, however the cost in development expense and development time may be much higher. The requirements and benefits need to be carefully weighed up against the funds available to determine the best technologically feasible solution.
In the measurement of standing trees some form of remote sensing technique is required as the tree cannot be directly physically measured without climbing the tree or felling it, either of which would be unsatisfactory. The options available are some form of imaging using electromagnetic imaging (visual, infrared, Xray, or radar) or ultrasonic imaging. Each imaging method is briefly examined for technical feasibility in figure 2.1.
The imaging method employed must capture three dimensional tree information. Some imaging methods, such as laser and ultrasonic imaging, can directly incorporate three dimensional information. Other imaging methods are inherently two dimensional and the three dimensional information must be captured by some other means. Techniques that could be used are stereo imaging, multiple views from different directions, or structured lighting techniques.
The most promising solution is to use some form of imaging technique based on the visible spectrum. Investigation should be made into both the use of photographic systems and CCD based technology to capture images. The use of either infrared or ultraviolet imaging might also prove useful and should be investigated.
2.2.1
Massey University Feasibility Study
Photographic imaging - System to capture visual images photographically
Technically feasible and technology readily available, but working at the limit of normal resolution. Photographic film is only a temporary medium as the images require transfer to computer for later processing. Low technology cost but high per use cost with processing time delay. Need to capture several images at right angles to capture 3D information.
CCD imaging - System to directly capture visual images electronically
Technically feasible, but working past the limit of normal resolution, so may need to employ resourceful techniques. Medium technology development cost. Images captured directly into computer so low per image cost and no processing delay. Need to capture several images at an angle to get 3D information. Large quantities of data involved so a high powered computer or video tape required to capture and store large quantities of data in the field.
Laser imaging - System to capture 3D locations of points on tree stem
Probably technically feasible but a slow and very fragile system. High technology development cost. No images are required as 3D points are captured directly. 3D points can be captured directly into computer. Low powered computer required in the field with specialised imaging hardware.
Ultrasonic - System to build up images by the reflected high frequency sound
Can determine distance of objects in addition to direction. Technologically not feasible to achieve desired resolution. Moderate hardware development cost and low per image cost. High powered computer required to capture data in the field.
Xray imaging - System to capture internal and external information
Technically not feasible as the detector needs to be directly on the other side of the object being imaged. Very high development cost and image reconstruction techniques required to recreate tree information. Xray danger to the operator.
Radar imaging - System to build up an image by reflected radar waves
Can determine distance and direction. Technically not feasible as non metallic objects give poor radar echoes. Very difficult to get desired resolution.
Figure 2.1 - Imaging technologies
Investigation proved that no existing electronic imaging system existed that met the
requirements of this particular application. No existing system had an appropriate aspect
ratio or adequate resolution. After experimenting using a photographic method of capturing images, two approaches for capturing images directly into a computer were
identified as favourable solutions that could be taken to the prototype stage (Pugmire,
1 . The most promising approach used a line scan camera that was stepped through a series of fixed angles to build up an image of the tree. A single image would be captured that contained significant perspective distortion. The image would be recorded directly on to portable computer for immediate processing. This would achieve an image resolution of 500 by 8000 pixels.
2 • The second approach used a video camera to capture a series of images while recording camera tilt. This method would use a domestic video camera and store the information on video tape for later processing. This system is likely to be less development intensive but greater image processing is required. Individual video frames must be spliced together to form a single image, and perspective distortions within and between frames must be corrected for.
The first approach is based on the premise of immediate processing by a system in the field, while the second approach is based on the premise of capturing lower quality images in the field and more extensive processing later. Both approaches were considered suitable to take into the prototype phase.
In addition, methods for extracting tree parameters from the images were investigated. Using an operator assisted method of parameter extraction, suitable methods for image calibration and perspective distortion correction were determined. Heights, widths,
branch size and position estimates could be relatively easily calculated. The possibility of automated parameter extraction was deemed to require further research.
2.2.2
Alternative Approach
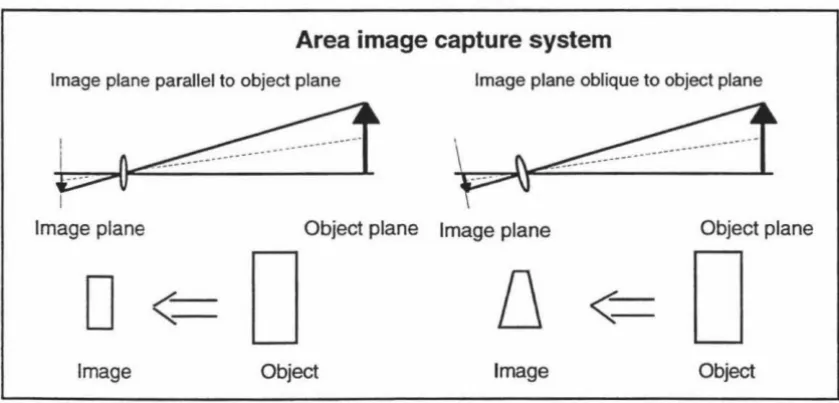
In addition to the approaches highlighted by the feasibility study a third image capture approach, based on a high resolution CCD area camera, must be considered as a likely solution.
The most important reason existing systems cannot be used for this application is that they do not have an aspect ratio of 40: 1. The specifications require a degree of accuracy in the horizontal direction and a somewhat lower resolution in the vertical direction. The resolution requirement of 8000 by 1000 pixels is based on equal resolution in the horizontal and vertical direction. If a compression lens or a curved mirror is used the image can be compressed in the vertical direction without loss of resolution in the horizontal direction.
Worst case image with Worst case image
with area capture Tree oscillation in the wind line scan capture
Small (negligible?) sweep introduced over any 6 m section.
Significant wobble introduced during wind gusts.
Figure 2.2 - Effects of wind on captured images
A second advantage of this system is that the shape of the tree stem would be instantly
captured. If the tree was moving in the wind, given a worst case scenario, the image
could be captured at the point of maximum tree deflection introducing a small amount of
'apparent sweep' (see figure 2.2). With the line scan approach however the image is
built up over time, tree movement in the wind could introduce a large 'apparent wobble'
that may be difficult to distinguish from real stem deformation.
Another advantage of this approach would be that the captured image is smaller. This
would make it easier to process and store. One of the basic premises of image
processing is reducing processing requirements by minimising raw data.
This approach would be limited in the measurement of branch sizes and may not
provide adequate vertical resolution near the top of the tree. Use of an alternative system
for the measurement of branches could be considered.
Figure 2.3 summarises the three alternative image capture approaches. It was decided
that a prototype system based on the line scan approach should be built as this was the
highest resolution system and provided the greatest flexibility for control of the system
parameters during image capture.
The next section will investigate the constraints that are imposed on such a system and
[image:32.569.97.482.71.351.2]Property
I
~:~
~·~
I
DJt~
Scan time at 10 mS per exposure 80 seconds 20 seconds 0.01 seconds
+
1 second transferImage size -Pixels 8000 x 1000 8000 x 500 2000 x 1000
-Storage 8 megabytes 4 megabytes 2 megabytes
Storage media Computer hard disk Video tape Computer hard disk
Depth of field Small Average Large
Aperture Wide open Average Small
Development -Time Medium Low High
- Cost Medium Low High
Measure -Sweep Yes Yes Yes
- Branch size Yes (horizontal I vertical) Yes (horizontal I vertical) No (horizontal only)
- Height Yes Yes Yes
Advantages Can adjust aperture during scan Fast image capture Instantaneous capture
Can adjust focus during scan No computer req'd in field No mechanical moving parts
Disadvantages
I
Slow as 8000 images captured Image splicing I processing req'd Difficult to developTree may move in wind Tree may move in wind Reduced vertical resolution
N
0
2.3
Design Constraints
Now that three specific solutions have been proposed, it is important to investigate the
constraints imposed on a system. These constraints fall in two broad categories;
constraints that result from the forest work environment, and constraints that are a
result of fundamental technology limitations (see table 2.1 ).
It is very important that all constraints are considered during the design of a system, as
any one of the constraints is able to reduce the usefulness of the final system. Each
constraint will be discussed in detail with examples drawn from the image capture
systems proposed in section 2.2.
2.3.1
Constraints Imposed by Forest Conditions
The system must be capable of operating in normal forest conditions. This imposes
seven constraints that need to be considered. Each constraint is discussed below:
System robustness -Any implemented system must be rugged and able to withstand
the knocks and vibration of work in the forestry industry. The intended users are
accustomed to handling heavy duty forestry equipment and may not be accustomed to
the sensitivity of electronic equipment. The system designer must take this into
consideration.
Tree stocking -Tree stocking varies from 200 to 800 stems per hectare. The stocking
of the stand limits the image capture positions that can be used. If the imaging system is too close to the tree, visibility of tree trunk near the top will be obscured by the tree's
own branches. If the imaging system is too far away the top of the tree trunk will be
System Constraints
Forest conditions Technology limitations
System robustness Resolution
Tree stocking Aspect ratio
Terrain and undergrowth Perspective distortion
Outdoor weather conditions Image size
Tree wind movement Image storage requirements
Lighting and contrast levels Tree parameter extraction
[image:34.573.101.496.548.758.2]obscured by the branches of other trees. A compromise needs to be made where the most important section of the tree stem can be reliably imaged without getting obscured.
Terrain and undergrowth - Terrain that must be inventoried varies from steep (slope of 40 degrees) to flat and there is normally some undergrowth present. Currently any significant undergrowth is cleared within the plot before the inventory assessment is made. A system should be capable of being used in situations where the terrain is steep and the undergrowth is present.
Outdoor weather conditions - A system must be reasonably weatherproof for two reasons. Current inventory crews work all year around, so a lot of the time it will be raining or misty. Secondly the undergrowth in the forest floor will usually be wet for a large part of the day. A system should be able to withstand a reasonable degree of moisture.
Tree wind movement -Trees do not remain perfectly still to allow image capture over a long time frame. For example with a wind of approximately ten knots the tops of the trees in an exposed stand will move up to one metre with an oscillation period of around five seconds. This is significant as the stem position is being imaged to within
±
1 cm.Lighting and contrast levels - Overall lighting conditions in a forest vary greatly. There are changes in ambient lighting from very dark to very light depending on weather conditions and density of foliage. In bright daylight the conditions are good for normal photography. In overcast conditions the lighting is barely adequate for normal photography. There is also a large variation in contrast and lighting between the top and bottom of a typical tree. Near the bottom the image will be of a low light, low contrast, front lit object. Near the top of the tree the image will be of a high contrast, high lighting, back lit situation. It is difficult to capture good images in these conditions with any imaging system.
2.3.2
Constraints Imposed by Technology Limitations
Design constraints imposed by fundamental technology limitations must also be considered. The system must be based on practical technology and physically capable of delivering accurate results regardless of expected variation in operating conditions. There are seven technology constraints :
camera technology typically using a resolution of 2000 by 1500 pixels. Line scan CCD
cameras are available from 128 pixels to 8000 pixels.
Aspect ratio -The aspect ratio of a standing tree is approximately 80: 1. As a result of
the perspective distortion a desirable image aspect ratio is approximately 8: 1. Images
can be captured at this aspect ratio or techniques could be used to capture images of a
more standard aspect ratio. This could be achieved through the use of a non circular
lens such as those used by the wide screen cinema industry or through the use of a
curved mirror as discussed in the high resolution CCD area camera approach.
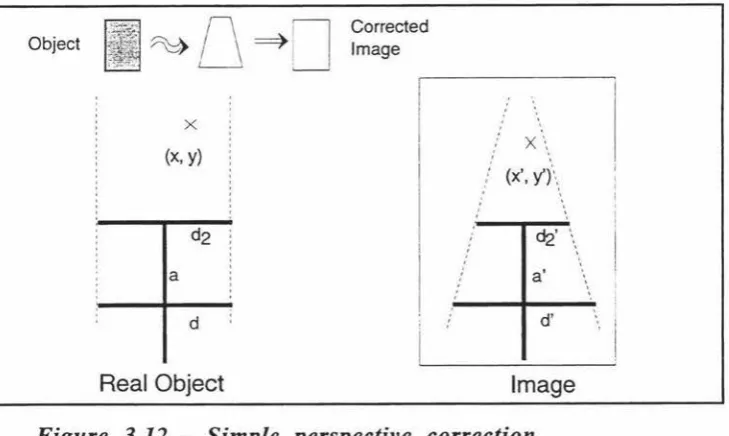
Perspective distortion - The tree being imaged is viewed from below introducing a
perspective distortion that can be corrected
~using
a calculation, if the geometry of theimaging situation is accurately known. This may be achieved through the use of a
calibration object in the captured images. Distortion correction is more difficult for the
video approach than the line scan approach.
Image size -The sheer size of the tree images of these dimension make the images
very difficult to work with. If an image consists of 8000 by 1000 pixels at 8 bit greyscale this corresponds to 8 megabytes of data. With images this size the computing
power required to load, save and process the images is large. This is important as
processing power of computers is limited. With the video scan system, overlapping
images must first be spliced together and then processed. This will make the processing
requirements even higher, but can be completed using batch processing out of the
forest.
Image storage requirements -The data storage requirements for images of this size
are very high. A typical high performance portable computer may contain 160
megabytes of hard disk space. This is the equivalent of 20 images or ten imaged trees.
In contrast MARYL information for the same tree consists of approximately 100 bytes
of text. This is one 80 OOOth the size of a single image. Video tape as used by the video
scan approach is a very cost effective method of storing large quantities of image data.
Tree parameter extraction - The captured image is only raw data. Tree stem size
information must be extracted from the image so a three dimensional model can be
generated. This involves some form of processing of the raw data (image) to get out the desired tree size information. This is a task humans can complete readily but is difficult
2.4 Proposed System
2.4.1
Improved Assessment Outline
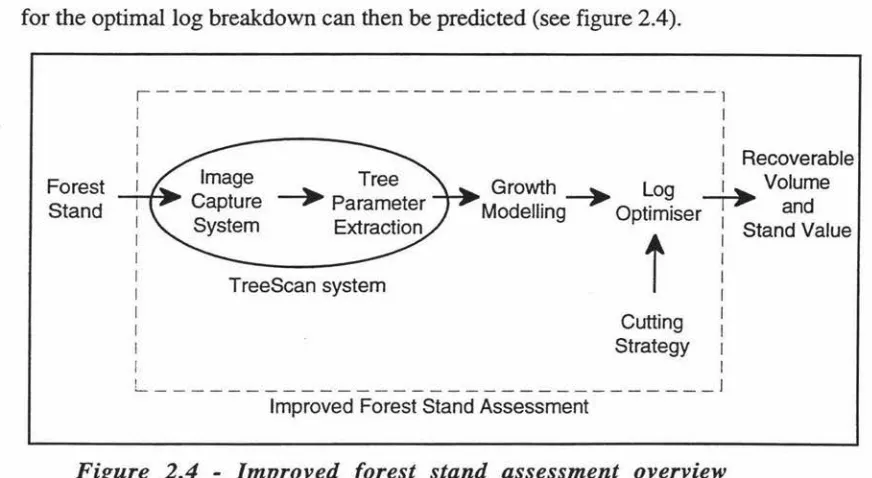
The image capture system is the first part of a sequence of steps in the proposed method
for improved forest stand assessment. The images captured need to be processed to
extract the tree parameters which define the dimensions of the three dimensional model.
This model can then be processed by an optimisor to determine the optimal log
breakdown for a particular cutting strategy. The recoverable yield and value of the stand
for the optimal log breakdown can then be predicted (see figure 2.4).
Forest Stand
r - - - -- - - -- - - 1
I I
I I
: : Recoverable
1 Growth~ Log 1 Volume
Modelling Optimiser
Y
and1 Stand Value
I
I I
t
TreeScan system
Cutting : Strategy 1
I I
L _ ______________________________ J Improved Forest Stand Assessment
Figure 2.4 - Improved forest stand assessment overview
The proposed TreeScan imaging system works by capturing calibrated images of a tree.
Based on calibration data and the position of features in the image, the position of the
tree features and shape of the stem can be estimated. This is the tree parameter
extraction. By capturing two images at right angles a three dimensional model of each
tree is generated.
2.4.2
Proposed Image Capture System Overview
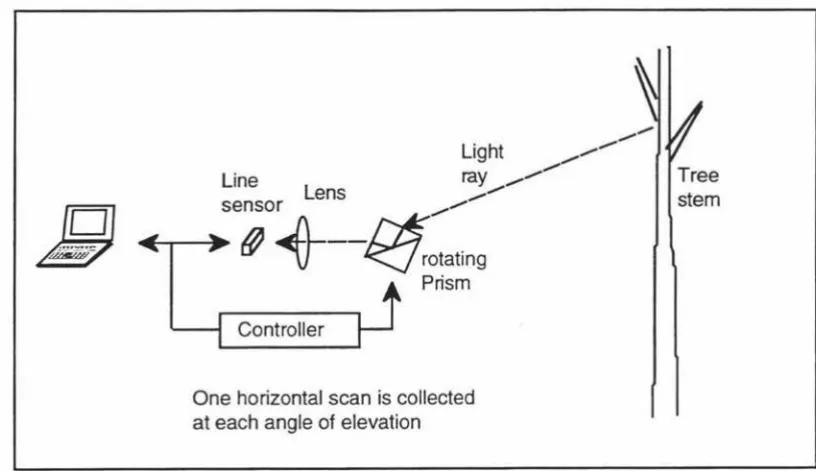
The proposed image capture system is a custom designed scanner capable of capturing high resolution images with a high aspect ratio directly into a computer.
The scanner would use a line scan camera that is stepped through a series of fixed
angles to build up an image of the tree (as outlined in section 7.3 of the feasibility study
- Pugmire, 1993). The system would capture a single horizontal scan line for each position of the rotating mechanism. The consequences of this are that the image is
[image:37.572.48.484.246.485.2]Either a rotating lens and camera unit, or a fixed camera with a rotating mirror or prism
could be used. A rotating mirror has the advantage that the sensor and cabling can be
fixed and that the mechanism has less mass to rotate.
The image would be recorded directly into a portable computer eliminating the need for
storage on photographic film or other temporary medium. A portable computer would
be taken into the field during image capture, so the image could be immediately
processed if required.
Light ...
-...
-Line ray _,,...
Lens ,,...-sensor
,,...-.._-r--~
(J
+--~otating
Prism
Controller
One horizontal scan is collected at each angle of elevation
Figure 2.5 - Image capture system principle
_,,..,
[image:38.571.94.502.216.451.2]2.5 Design specification
The aim of current work by Massey University has been to develop a prototype line scan based image capture system for the improvement and automation of forest stand assessment as specified in "Line Scan Camera Image Capture Project - Sub Project 1 Proposal" (see appendix D).
It was the intention of the project to rapidly produce a working proof of concept prototype to allow the capture of images of trees and transfer these directly to a portable computer. The captured images would be in a format that could initially be analysed using the NIH Image package and the macros produced as part of the feasibility study.
The system needed to be capable of imaging ten trees per hour under normal forest conditions. Normal forest conditions include low natural lighting, variation in tree dimensions and in tree stocking, presence of undergrowth, and a large variation in terrain.
The accuracy specifications state that the height estimates need to be accurate to within
±
0.5 metres and stem diameter estimates need to be accurate to within±
1 cm. This relates to an image resolution of approximately 8000 by 200 for a 40 metre tree.Imaging the bottom two thirds of the stem may be sufficient as this is the most valuable section. The top of the tree would normally be obscured by branches. In addition to the stem sweep determination, estimation of branch size was classified as being desirable.
TREES CAN
DESIGN CONSIDERATIONS
AND
THEORETICAL FOUNDATIONS
3. 1 Design Overview --- 28
3. 2 TreeScan Operating Principle --- 31
3. 3 Image Capture --- 3 5
3. 4 Scanner Interface and Image Storage ---:--- 46
3. 5 Parameter Extraction --- 48
3. 6 Three Dimensional Model Generation --- 57
TreeScan is the name given to the prototype tree imaging system developed. The aim of
this chapter is to show that the TreeScan design is a technologically feasible solution.
This will be accomplished by discussing the design considerations and theoretical
foundations of likely areas of technical difficulty. Key areas of technical difficulty are
individually analysed. As a result each section in this chapter is an almost standalone
analysis and discussion.
To provide an introduction section 3.1 and section 3.2 will discuss the TreeScan design
at a systems level and show how individual design aspects interrelate, after which
sections 3.3 to 3.7 will analyse individual design aspects in greater detail.
3.1 Design Overview
Once the direction of this research and development had been established the design
phase was entered and research was started to determine the best method to realise the
design concept. This research involved determining the limiting factors of the
technology, calculating precise technology requirements, and scoping technologies
currently on the market.
The TreeScan system will fit into the improvement of forest stand assessment as shown
in figure 2.4 in the previous chapter. The system input boundary lies at the physical
geometry of the trees that need to be measured. The system output boundary lies at the
actual three dimensional tree model produced by the software. To get from input to the
system output involves a series of steps (see figure 3.1) each one of which could affect
the integrity of the information produced by the system and the feasibility of the whole
design. Each of these steps is a possible area of technical difficulty which may limit the
system and must be carefully analysed.
Second view
Key areas of technical difficulty
·- , / V ....
o_.s_.e
First view \
co
-~-D-8-8-C§V
Physical Calibration Precision Optics CCD Interface Computer Acquisition environment mechanics camera ttN Software
~
+--+
System Calibration Geometry
Image capture
Principle of operation
Image transfer & storage
Figure 3.1 - Possible areas of technical difficulty
Analysis 30 software Software
~