Dealing with Missing Data
Judi Scheffer
I.I.M.S. Quad A, Massey University,
P.O. Box 102904 N.S.M.C,
Auckland, 1310.
[email protected]
Abstract
What is done with missing data? Does the missingness mechanism matter? Is it a good idea to just use the default options in the major statistical packages? Even some highly trained statisticians do this, so can the non-statistician analysing their own data cope with some of the better techniques for handling missing data? This paper shows how the mean and standard deviation are affected by different methods of imputation, given different missingness mechanisms. Better options than the standard default options are available in the major statistical software, offering the chance to 'do the right thing' to the statistical and non-statistical community alike.
Introduction
Missing data plagues almost all surveys, and quite a number of designed experiments. No matter how carefully an investigator tries to have all questions fully responded to in a survey, or how well designed an experiment is; examples of how this can occur are when a question is unanswered in a survey, or a flood has removed a crop planted close to a river. The problem is, how to deal with missing data, once it has been deemed impossible to recover the actual missing values. Traditional approaches include case deletion and mean imputation; (occasionally provided as an option with some software), These are the default for the major Statistical packages. In the last decade interest has centred on Regression Imputation, and Imputation of values using the EM (Expectation -Maximisation) algorithm, both of which will perform Single Imputation. More recently Multiple Imputation has become available, and is now being included as an option in the mainstream packages. Here I will look at eight different methods of imputation, and compare how well these methods perform (what happens to the means and standard deviations) under different missingness mechanisms with different amounts of missing data.
The Missingness Mechanisms
MCAR
The term 'Missing Completely at Random' refers to data where the missingness mechanism does not depend on the variable of interest, or any other variable, which is observed in the dataset. MCAR is both missing at random, and observed at random (This means the data was collected randomly, and does not depend on any other variable in the data set). This very stringent condition is required in order for case deletion to be valid, and missing data is very rarely MCAR (Rubin, 1976).
MAR
The term 'Missing at Random' is a misnomer, as the missing data is anything but missing at random. The intuitive meaning of this term is better suited to the term MCAR. What MAR means is missing, but conditional on some other 'X-variable' observed in the data set, although not on the 'Y-variable' of interest (Schafer, 1997).
NMAR
MCAR and MAR are ignorable, for likelihood-based imputation methods, NMAR is not (Little and Rubin, 1987).) Multiple Imputation, EM imputation and regression imputation all are valid provided the missingness mechanism is not NMAR, and the percentage of missing data is not too great.
Method
1000 cases were generated, with explanatory variables x1, x2, x3 and y, the dependent variable. The Y
[image:2.595.50.481.309.470.2]variable was generated as a combination of explanatory variables with added random components. Then differing amounts were deleted at random causing MCAR data, which had 0, 1, 5, 10, 15, 20, 25, and 50 % missing data. MAR data was simulated by sorting according to one of the X variables, and deleting the upper values by differing amounts to give MAR data. Sorting according to the actual 'Y' values and deleting the cases to give eight different rates of missingness created NMAR data.
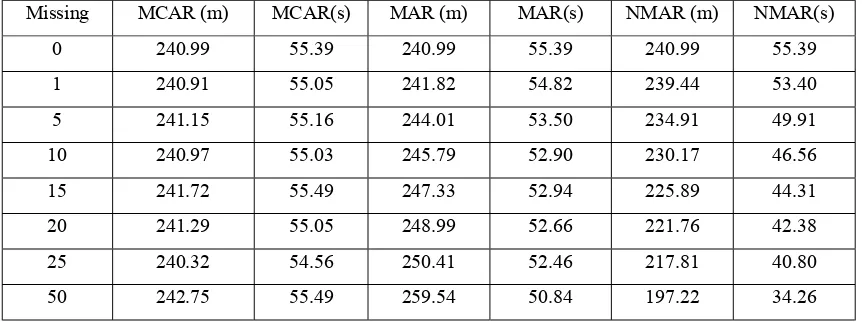
Table 1:Table of Means and Standard Deviations when differing amounts of data are missing, under different assumptions of missingness. The first row shows the means and standard deviations of the simulated data when no data are missing. i.e. the data are complete.
Missing MCAR (m) MCAR(s) MAR (m) MAR(s) NMAR (m) NMAR(s)
0 240.99 55.39 240.99 55.39 240.99 55.39
1 240.91 55.05 241.82 54.82 239.44 53.40
5 241.15 55.16 244.01 53.50 234.91 49.91
10 240.97 55.03 245.79 52.90 230.17 46.56
15 241.72 55.49 247.33 52.94 225.89 44.31
20 241.29 55.05 248.99 52.66 221.76 42.38
25 240.32 54.56 250.41 52.46 217.81 40.80
50 242.75 55.49 259.54 50.84 197.22 34.26
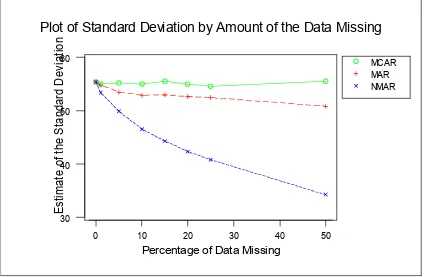
The table shows the mean is affected by 20% when 50% are missing when NMAR, whereas the mean changes only 6% for MAR data, at 50%missing. The SD is only affected by 7% under MAR at 50%, but under NMAR this increases to 38%. See Fig. 1 and Fig. 2 The effect of the missingness mechanism is shown by Fig 1: Plot of the mean by amount of data missing for each of the three missingness mechanisms, and Fig 2: Plot of the effect on the Standard deviation by the amount of data missing.
What is done about Missing Data?
When the value of the missing data cannot be sourced by other means, the choices left are
1. Case Deletion: This can be either listwise (complete case only) or all value (Pairwise-available case), the cases are deleted which contain missing data, for the analysis being carried out.
2. Single Imputation: This can include group means, medians or modes (depending on the data), Regression Imputation, Stochastic Regression Imputation (deterministic regression imputation with an added random error component), or EM Imputation (this uses the Expectation-Maximisation algorithm to predict the missing value), or hot deck imputation, or last value carried forward for longitudinal data, and a variety of other methods (Scheffer, 2000). End users very often demand a single complete data set.
Fig 1: Plot of the Mean by Amount of Data Missing
Fig 2: Plot of Standard Deviation by Amount of the Data Missing.
MCAR MAR NMAR
0 10 20 30 40 50
190 200 210 220 230 240 250 260 270
Percentage of Data Missing
Es
tim
a
te
of
t
he M
ean
Plot of Mean by Amount of the Data Missing
MCAR MAR NMAR
0 10 20 30 40 50
30 40 50 60
Percentage of Data Missing
Es
tim
a
te
of
th
e
S
tan
da
rd
Dev
iatio
n
[image:3.595.113.537.430.707.2]Imputation allows for analysis using a rectangular data set, therefore using regular software and techniques, so that standard analysis can then proceed.
Disadvantages of Imputation
Can allow data to influence the type of imputation, and will increase the overheads of a survey. Imputed data is NOT real data, and variance estimates need to reflect this uncertainty. Single Imputation nearly always gives reduced variance estimates, so therefore not reflecting the uncertainty due to imputation.
Software Available:
1. SOLAS: This is from Statistical Solutions, Ireland. Available are Group Means, Last Value Carried Forward (for longitudinal data), Hot Deck imputation, and Multiple Imputation (based on propensity scores)
2 . SPSS MVA Module: Available here are Listwise analysis, All Value analysis, Regression Imputation (with a random stochastic component), EM (single) Imputation.
3 . S-PLUS: supports the Norm, Cat, Mix and Pan libraries, which use the MCMC multiple imputation. Also under the S-PLUS platform is MICE (multiple imputation by chained equations). S-PLUS 6 has a missing data routines built in, using MCMC methods for MI.
4. SAS: PROC MI, and PROC MIANALYSE, are beta versions in SAS 8.2. These use MCMC MI methods, and when a full version is released will form a very powerful tool, as it will integrate with all available SAS analysis.
5. BMDP: Have routines available to impute data, using both single and multiple imputation. 6. BUGS: MCMC Multiple Imputation is a natural extension of Bayesian analysis.
7. Numerous other minor packages (Scheffer, 2000)
How do these Perform?
Eight different methods of Imputation were tested using the three different missingness mechanisms, at eight different levels of missingness, as described above. The imputed data was then compared to the complete data (prior to deletion). These methods were:
1. All Value
2. Listwise (one and two are forms of Case Deletion) 3. SOLAS Group Means
4. SOLAS Hot Deck 5. SPSS MVA Regression
6. SPSS MVA EM (three, four, five and six are Single Imputation) 7. SOLAS EM MI
8. NORM: MCMC MI (seven and eight are Multiple Imputation)
Missingness Mechanism
MCAR
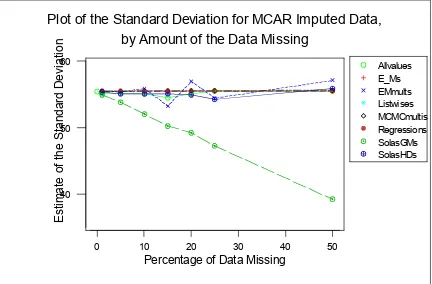
All of these methods estimate the true mean fine: Even at 50% missing all were within 1% of the target value. The S.D. is fine for all types of imputation under MCAR except for mean imputation. Here there is a 30% discrepancy in the true value of the S.D.- all the rest are within 5% of the true figure. (See Fig. 4.)
MAR
Fig 3: Plot of the mean for MCAR data by the amount of data missing.
Fig. 4: Plot of the Standard Deviation for MCAR imputed data, by the amount of data missing.
Allvalue E_M EMmulti Listwise MCMCmulti Regression SolasGM SolasHD
0 10 20 30 40 50
235 236 237 238 239 240 241 242 243 244 245
Percentage of Data Missing
Es
tim
a
te
o
f
th
e
M
ean
Plot of the Mean for MCAR Imputed Data,
by Amount of the Data Missing
Allvalues E_Ms EMmults Listwises MCMCmultis Regressions SolasGMs SolasHDs
0 10 20 30 40 50
40 50 60
Percentage of Data Missing
Es
tim
a
te
o
f th
e
Sta
nd
a
rd
De
vi
a
tio
n
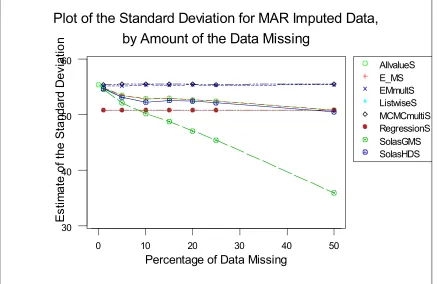
[image:5.595.111.543.439.723.2]Fig. 5: Plot of the Mean for MAR imputed data by amount of data missing.
Fig. 6: Plot of the Standard Deviation for MAR imputed data, by amount of the data missing.
AllvalueS E_MS EMmultS ListwiseS MCMCmultiS RegressionS SolasGMS SolasHDS
50 40
30 20
10 0
60
50
40
30
Percentage of Data Missing
Es
tim
a
te of
th
e
S
ta
nd
a
rd
D
e
vi
ati
o
n
Plot of the Standard Deviation for MAR Imputed Data,
by Amount of the Data Missing
AllvalueM E_MM EMmultMi ListwiseM MCMCmultiM RegressionM SolasGMM SolasHDM
50 40
30 20
10 0
270
260
250
240
230
Percentage of Data Missing
Es
tim
a
te
o
f th
e M
e
an
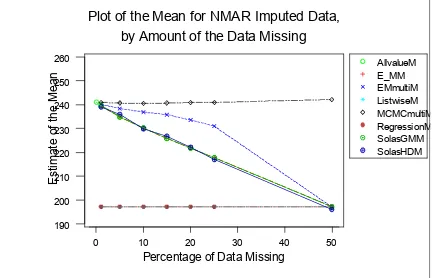
[image:6.595.56.493.445.729.2]Fig. 7: Plot of the mean for NMAR Imputed data by amount of data missing.
Fig. 8: Plot of the Standard Deviation for NMAR data, by the amount of data missing.
AllvalueM E_MM EMmultiM ListwiseM MCMCmultiM RegressionM SolasGMM SolasHDM
0 10 20 30 40 50
190 200 210 220 230 240 250 260
Percentage of Data Missing
Est
ima
te
o
f t
he
Me
an
Plot of the Mean for NMAR Imputed Data,
by Amount of the Data Missing
AllvalueS E_MS EMmultiS ListwiseS MCMCmultiS RegressionS SolasGMS SolasHDS
0 10 20 30 40 50
20 30 40 50 60
Percentage of Data Missing
Es
tim
a
te
of
t
he S
tan
da
rd
D
e
vi
a
tio
n
is OK up to 25%, but the MCMC MI performs very well. However for the SD, this is not the case. Only the two MI's are fine at the 5% level with all others badly underestimating the variance. Above the 5% level, only the Bayesian MI will preserve the variance structure, with the GMeans performing particularly badly. (See Fig. 4: Plot of the standard deviation for MCAR imputed data, by amount of the data missing). There is a 60% loss of SD; when over 50% of missing data. Imputation is fairly suspect at a 50% rate of missingness anyway, particularly so for NMAR.
Included in the both of the multiple Imputation analyses was a simple index that probably improved its performance. The y values were sorted, and the index was included in the imputation model, as a predictor variable. Since the data is NMAR, it is known that the missingness mechanism depends on the actual Y-values; it seemed reasonable to include this index as a predictor. In a more general sense, it would need to be known as prior information, whether or not the data is missing from the lower end of the scale or the upper end, so as to put the missing values at the top or bottom of the sorted data set. This should prove very useful in the real situation.
1Why is SPSS MVA Reg. Imputation so dangerous? Probably because it is so easy to use, with very little
knowledge. It appears that SPSS MVA will case delete, and then build on the imputed model, thus introducing more bias than what is necessary. Results with SPSS MVA Reg. Imp, are VERY suspect (in this study). SAS' PROC PRINQUAL will perform regression imputation in an unbiased fashion giving much better results, although was not included as a part of this study. SPSS MVA EM imputation performs slightly better, although not much better.
Conclusions
What this really shows is that group means perform the worst of anything when it comes to imputing data. Case Deletion is bad; imputing the mean far worse, for it destroys the variance structure within the data. This analysis was using normal data, a natural extension would have been non-normal data, and another natural extension would be to look at skewness and kurtosis, what happens to them under different imputation models? Deleting the case is also very wrong, in all but MCAR; this confirms what is in the literature (Little, 1988; Little, Rubin, 1987). Single Imputation methods can work for MAR, but only when less than 10% of the data is missing, if one is interested in the mean. If the variance structures in the data are important, then don’t use these methods if the data is more than 5% missing. MI works well up to 25%. For NMAR, nothing short of MI will work, and preferably at missingness levels of less than 25%.
Recommendations
1. Do not use case deletion unless the data is definitely MCAR. Also do not use mean imputation; unless the data is MCAR, and variance structures do not matter, i.e. only means or totals are required.
2. Try to avoid missing data
3. If Single regression must be used, use EM or Regression Imputation, although not SPSS MVA REG imputation, as this gives VERY odd results1.
4. If at all possible use Multiple Imputation.
5. When Multiply Imputing, use a model compatible to the analysis model where possible (Meng, 1994). (This is not a consequence of this paper, but an important consideration that deserves mention.)
1The reason for this is that SPSS MVA Reg. Imputation tends to initially case delete, all missing data, and
then impute the variables, until complete data is achieved.
References
Little, R.J.A., (1988) A Test of Missing Completely at Random for Multivariate Data with Missing Values. Journal of the American Statistical Association 83 (404) 1198-1202
Little, R.J.A., Rubin, D.B., (1987) Statistical Analysis with Missing Data. Wiley
Meng, X-L, (1994) Multiple Imputation with Uncongenial Sources of Input. Statistical Science 9 538-573 Rubin, D.B., (1976) Inference and Missing Data. Biometrika 63 581-592
Schafer, J.L., (1997) The Analysis of Incomplete Multivariate Data. Chapman & Hall