0022-538X/96/$04.0010
Copyrightq1996, American Society for Microbiology
Maintaining the Integrity of Human Immunodeficiency Virus
Sequence Databases
GERALD H. LEARN, JR.,1* BETTE T. M. KORBER,2,3BRIAN FOLEY,2BEATRICE H. HAHN,4
STEVEN M. WOLINSKY,5
ANDJAMES I. MULLINS1,6
Departments of Microbiology1and of Medicine,6University of Washington, Seattle, Washington 98195-7740;
Theoretical Biology and Biophysics Group, Los Alamos National Laboratory, Los Alamos, New Mexico 875452; The
Santa Fe Institute, Santa Fe, New Mexico 87501-89433; Departments of Medicine and Microbiology, University of
Alabama at Birmingham, Birmingham, Alabama 352944; and Department of Medicine, Division of Infectious
Diseases, Northwestern University Medical School, Chicago, Illinois 606115
Received 7 December 1995/Accepted 29 April 1996
Human immunodeficiency virus type 1 (HIV-1) sequences are accumulating in the literature at a rapid pace. For this ever-expanding resource to be maximally useful, it is critical that researchers strive to maintain a high level of quality assurance, both in experimental design and conduct and in analyses. Here we present detailed analyses of problematic sets of HIV-1 sequences in the database that include sequence anomalies suggestive of mislabeling or sample contamination problems. These data are examined in the context of currently available HIV-1 sequence information to provide an example of how to identify potentially flawed data. Indicators of potential problems with sequences are (i) sequences that are nearly identical that are supposed to be derived from unlinked individuals and that are markedly distinct from other sequences from the putative source or (ii) sequences that are nearly identical to those of laboratory strains. We provide an outline of methods that researchers can use to perform preliminary laboratory and computational analyses that could help identify problematic data and thus help ensure the integrity of sequence databases.
The amount of human immunodeficiency virus type 1 (HIV-1) nucleotide sequence data being submitted to the Gen-Bank database is a fair indicator of the amount of sequence data being generated from HIV-1 over time. On the basis of the dates for the sequence entries, the database has grown from approximately 159 cumulative entries in 1991 to 1,356 in 1993 to 2,995 in 1994. Halfway through 1995, 2,698 additional entries were made. This exponential increase of data accumu-lation thus shows no evidence of plateauing. As the databases grow, the difficulty of maintaining their integrity grows propor-tionately. We are now reaching the point where we can pro-duce large data sets to search for covariance of sites, implied conserved structural features, and possible virus-host interac-tions. Strict quality assurance must be maintained. Complicat-ing this goal is the ever-increasComplicat-ing divergence of this extraor-dinarily rapidly evolving virus, which may make errors progressively more difficult to detect. Efforts toward quality control extend from the maintenance of correct records of sample origin to the avoidance of mix-ups and contamination events in tissue culture and in cloning, PCR, and DNA se-quencing to analytical checks for sequence integrity. Issues relating to data integrity have confounded AIDS research as far back as the discovery of the AIDS virus and its close relatives (8, 19, 45). At the same time such problems are by no means restricted to the AIDS research effort (4) or a few researchers but are in part an inherent consequence of the extreme sensitivities of current technologies (23).
Continuing to the present, many instances of HIV sequence mix-ups, contamination, and annotation errors are dealt with prior to publication by the database managers in consultation with the investigators generating the primary data. The growth
of the database precludes the viability of these measures in the future except for a small minority of submissions. Clearly the pathway to maintaining database integrity involves diligence on the part of the laboratory and affiliated investigators re-sponsible for the submission.
Here we will first present two published cases of problematic data, a more detailed description of a reanalysis presented elsewhere (18), and a new case. These examples are used to illustrate methodologies that facilitate identification of proba-ble mistakes before they are promulgated. We also suggest a set of guidelines and procedures that we have found helpful for testing the quality and integrity of sequence data sets, with special emphasis on HIV-1 sequences generated following PCR amplification.
Briant et al. study (6).The Briant et al. study (6) evaluated the perinatal transmission of HIV-1 by examining viral enve-lope gene (env) sequences obtained from blood samples from the mother during pregnancy and from both mother and infant shortly after birth. The conclusion drawn in this study was that, for three of four mother-child pairs analyzed, a set of divergent viruses was transmitted to and replicated in the children, with transmission occurring possibly at different times during preg-nancy. These findings were of particular interest because they were contrary to previously reported cases of perinatal (1, 28, 46), sexual (50), and parenteral (49) transmission in which relatively homogeneous viral env sequence populations were found shortly after infection. We have reevaluated the Briant et al. data and failed to confirm their conclusions. Instead, our analyses indicate a high probability of laboratory contamina-tion or sample mix-up.
Three hundred and eight sequences from this study (6) (ac-cession numbers U24717 to U24999 and U25001 to U25025) were obtained from the GenBank release 89.0. They were aligned by using Clustal W (43) with the following settings: gap opening penalty of 10.0 and gap extension penalty of 5.0 for both pairwise and multiple alignments, with transitions
* Corresponding author. Mailing address: Department of Microbi-ology, University of Washington, Seattle, WA 98195-7740. Phone: (206) 616-4286. Fax: (206) 616-1575. Electronic mail address: [email protected].
5720
on November 9, 2019 by guest
http://jvi.asm.org/
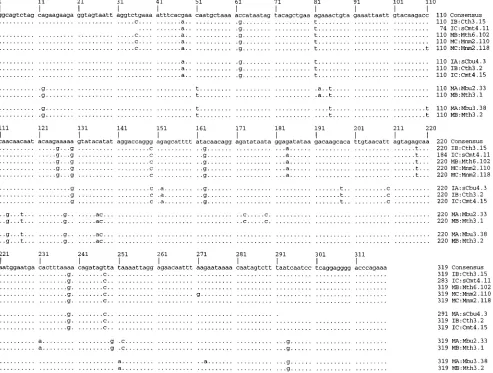
weighted. The alignment was then visually inspected but re-quired no adjustments. When the nucleic acid sequences from all four mother-infant pairs were aligned to a single sequence, several instances of identical sequences found across different mother-infant pairs were noted (Fig. 1). In all, 37 sequences were duplicates of at least one other sequence in the data set, having identical length and sequence. These were found both within and between individuals and mother-child pairs. All of the sequences under study belong to HIV-1 env sequence clade B, with an average divergence from similar sequences (as rec-ognized by the FASTA program [30]) in the Los Alamos Hu-man Retrovirus and AIDS Database of 16.5% and a range of 3.4 to 33.0%. An average divergence of 13.8% (Fig. 2a) is seen over this region of the viral genome for a sample of sequences from apparently unlinked infections within the United States reported this decade; hence, given the identity of sequences across mother-infant pairs, the evidence strongly suggests that either the cases are closely linked epidemiologically or that several instances of either contamination or sample mix-up occurred in this study.
Briant et al. (5) have suggested that sequence similarity is
frequently observed in HIV studies. However, before their report there were no known cases where identical sequences for a substantial region (200 to 300 bp) of the env gene have been obtained from epidemiologically unlinked individuals. The possibility that a single pair of these identical sequences arose independently by parallel or convergent evolution from divergent sequences is extremely unlikely; the joint likelihood of these events occurring several times in the same study would be vanishingly small. There is a possibility that the cases were linked, but it seems unlikely that three HIV-1-infected women were all infected from the same source or linked sources, and we are not aware of evidence suggesting epidemiological link-age of these cases. There is a further possibility that the sim-ilarity of the viral sequences is a result of geographic clustering of the cases in Toulouse, France, where the study was con-ducted. However, an argument against this being the case is that the divergence between phylogenetic clusters generated from these sequences is comparable to that found among other, unlinked sources.
[image:2.612.62.555.77.450.2]As a counterpoint to the Briant et al. study (6), we also examined virus relatedness in a different study by Ahmad et al. FIG. 1. Sequence alignments of Briant et al. (6) data involving four sets of highly similar sequences drawn from different mother-infant pairs. Sequences are aligned to the consensus sequence of the full data set. Nucleotides identical to those of the consensus sequence are indicated by periods. The first letter of the sequence name specifies mother (M) or infant (I); the second letter specifies the mother-infant pair (A to D). The code following the colon is the clone name given in the corresponding GenBank entry for the sequence.
on November 9, 2019 by guest
http://jvi.asm.org/
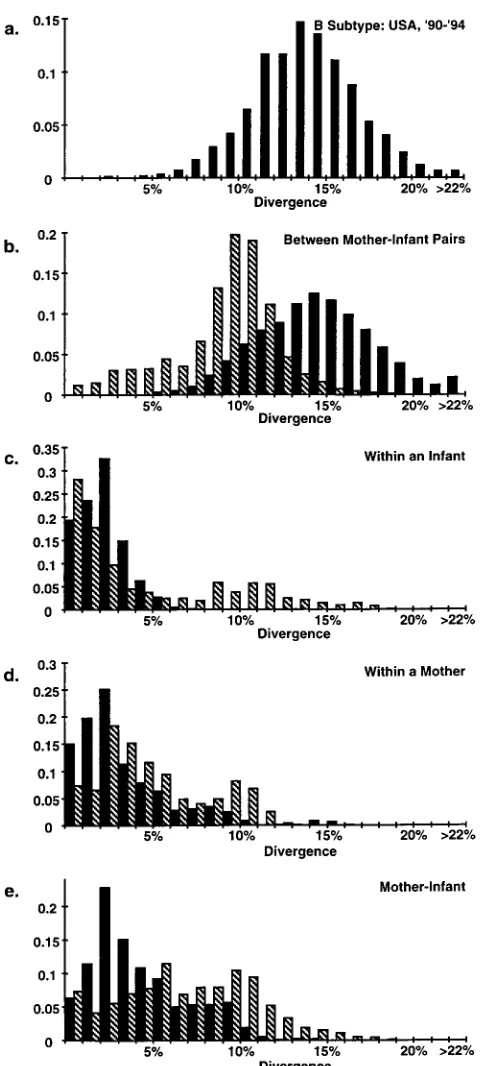
(1) of mother-to-infant transmission of HIV-1 in which the phylogenetic relationships of the HIV sequences show logical associations and sequence mix-ups do not appear (Fig. 2b to e). When viral sequences from a given mother-infant pair are compared with those from other pairs, the distribution of se-quence distances is unimodal, as expected for unlinked viruses (Fig. 2b, solid columns), whereas this distribution is skewed to the low side in the Briant et al. study (hatched columns). The peak of around 9.5% diversity in the Briant et al. study suggests that the epidemic in Toulouse may be slightly (perhaps 4 to 5 years, see below) younger than the average of sequences from the GenBank database (13.8%) and the Ahmad study drawn from Cincinnati, Ohio, in 1991 to 1993 (14.5%). This low level of diversity may arguably be due to a sampling artifact, since only four mother-infant pairs are represented; yet the overall degree of difference does not suggest a high degree of close epidemiologic linkage. The large number of highly similar se-quences from different mother-infant pairs in the Briant et al. study is unexpected. Furthermore, the distributions from the Briant et al. study are bimodal and skewed toward greater dissimilarity when sequences within infants (Fig. 2c), within mothers (Fig. 2d), and within mother-infant pairs (Fig. 2e) are examined. Notably, more extreme values are seen for the in-fants (Fig. 2c), who have been infected for less time than the mothers. While Briant et al. noted this in their study, it appears to us that, when viewed in the context of all the sequence information, sample mix-up or contamination is the much more likely explanation for their data.
The relationships between HIV-1 sequences from the four Briant et al. (6) mother-infant pairs were also examined for phylogenetic linkages by using DNADIST (11). For the iden-tical sequence sets, only a single unique representative was included in the alignment used for phylogenetic analyses. To reduce the number of negative branches in the neighbor-join-ing analysis (34) due to nonadditive sequence distance rela-tionships, sequences that did not completely span the 319- to 325-nucleotide interval studied by Briant et al. were omitted from this analysis. The final data set used for the phylogenetic analysis included 185 unique sequences.
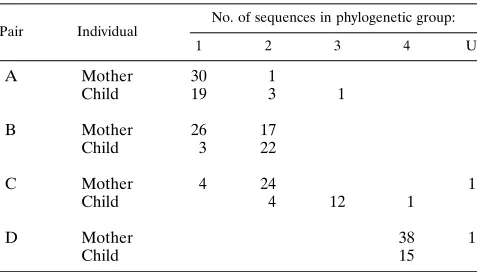
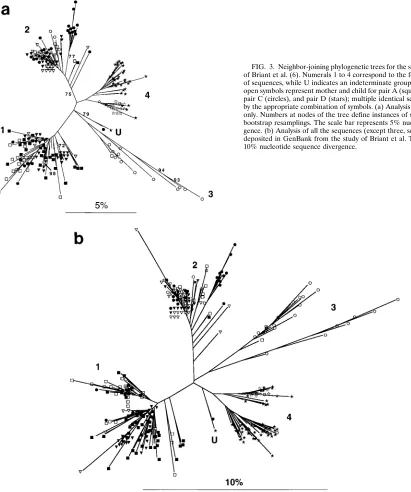
Phylogenetic relationships were estimated by the neighbor-joining method with a sequence distance matrix determined by the two-parameter method of Kimura (17). This method esti-mates evolutionary rates, allowing for different rates of transi-tion and transversion substitutransi-tions. Inspectransi-tion of these trees and sequence alignments reveals a number of additional in-stances in which sequences are grouped with those from one of the other three mother-child pairs. This analysis, a preliminary description of which was reported by Korber et al. (18), re-vealed four distinct groups (labeled 1 to 4 in Fig. 3), as would be expected with four cases that are epidemiologically un-linked, along with an outlier undetermined pair (labeled U). However, none of the four clusters corresponded completely to individuals or pairs reported in the Briant et al. study (6) (Table 1).
Briant et al. (5) have asserted that the dates on which sam-ples were obtained would tend to preclude the possibility of sample mix-up. This does not exclude the possibility of con-tamination, however, since there are numerous potential sources of sample contamination or mix-up. These events may
[image:3.612.57.298.66.599.2]Briant et al. study, n52,578). (e) Distances for all mother-infant comparisons (for Ahmad et al. study, n52,371; for Briant et al. study, n52,860) within the pairs. Alignments used to generate these data are available from the investiga-tors.
FIG. 2. Distribution of pairwise genetic distances. Values along the ordinate indicate the fraction of total pairwise comparisons with a given percent diver-gence. Divergences are shown as percent substitutions per site after gap stripping and corrected for multiple substitutions (17). (a) All pairwise comparisons (n5 2,080) for a sample of 65 apparently unlinked HIV-1 subtype B sequences from the United States collected from the years 1990 to 1994. One pair of sequences (U11475 and U11476 [14]) appears to be anomalously similar (2.1%) and may reflect unknown epidemiological linkage. (b to e) Distributions of pairwise ge-netic distances over the identical region as in panel A for two studies of mother-infant transmission of HIV-1, namely, the studies of Ahmad et al. (1) (solid bars) and Briant et al. (6) (hatched bars). (b) Distances shown are for comparisons between individuals (for Ahmad et al. study, n529,351; for Briant et al. study,
n518,668) from different mother-infant pairs. (c) Distances for within-infant comparisons (for Ahmad et al. study, n51,086; for Briant et al. study, n5811). (d) Distances for within-mother comparisons (for Ahmad et al. study, n51,370;
on November 9, 2019 by guest
http://jvi.asm.org/
occur at any of a number of times during laboratory proce-dures and during data entry and coding; furthermore, reagents or equipment may be a persistent source of contamination that may have occurred even prior to the beginning of the study in question. To investigate whether a clear pattern of contamina-tion or sample mix-up could be seen, the phylogenetic patterns of both complete and incomplete sequences were examined. The phylogenetic analysis of this more inclusive set employed 305 of the 308 sequences and produced results (Fig. 3b) that are very similar to those seen in Fig. 3a; again, four main groups were observed. The placement of these sequences into groups also again revealed that many of the sequences were evidently misplaced (Table 2). All of the case D sequences fell within a single group, with the exception of one sequence within the U group. Although we have not attempted to pre-cisely reconstruct scenarios that would explain the observed groupings, there appears to be some temporal pattern to them that may assist in tracking the proposed mishandling of sam-ples. For example, for case A, of the nine sequences that fall outside group 1, seven were from the child at the 16-month sample time. In addition, all of the time points from month 4 of pregnancy and delivery from the case B mother were in group 1, while all members of the 3-month postdelivery sample are placed in group 2. Group 3 contains all of the case C child sequences, except those from 13 months of age; these se-quences fall in groups 2 and 4.
Shapshak et al. study (37).Another study that compared HIV-1 sequences from blood and brain samples is reanalyzed here as an example of several kinds of sequence anomalies that merit follow-up as potential sample contamination or mix-up (37, 47). The investigators of the study reporting these data analyzed viral RNA and proviral DNA env gene sequences obtained from blood, brain, and cerebrospinal fluid (CSF) samples from three patients. A major conclusion drawn from this study was that HIV-1 strains infecting the brain showed restricted heterogeneity compared with strains infecting blood and CSF samples and that V4 region sequences from variants found in brain tissue from two patients with HIV-1-associated dementia were more similar to each other than to sequences from blood or CSF samples from the same patient (37). The sequence set includes 86 GenBank entries with accession num-bers U16032 to U16117.
The first anomaly in these data is the presence of nine sequences putatively derived from two of the study subjects
that are greater than 97% identical to the sequence of the HXB2 strain of HIV-1 (GenBank accession number M38432) over their entire length (1,168 bases). HXB2, a virus closely related to the common LAI and HTLV-IIIB laboratory strains, is commonly used as a reference strain in laboratories studying HIV, both in cell culture and as a positive control for PCR amplifications. Although some have suggested that the pres-ence of such sequpres-ences in samples obtained from patients reflects their prevalence in certain areas (2), a more likely explanation is that they originated from laboratory cultures. While none of the sequences reported in that study are iden-tical to LAI, they are very closely related and the small level of difference may be due to polymerase errors during PCR am-plification, sequencing error, or divergence of virus grown in culture.
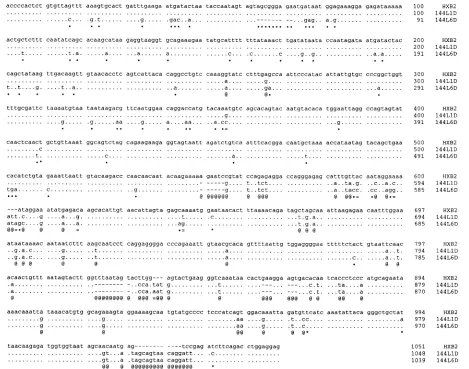
The presence of sequences that are likely to have originated from a different source (HXB2 in this case) in these circum-stances also gives rise to the possibility of recombination dur-ing PCR amplification between gene fragments from it and those derived from the study subject (27). The sequence of clone 144L1D (GenBank accession number U16074) from these data appears to be the result of such a recombination event; it is greater than 99% identical to HXB2 over the 59620 bases of the sequence, only 87% identical to HXB2 over the 39 end of the sequence (bases 621 to 1168), but 97% identical to 144L6D, also from study subject 144, over the same 39region (Fig. 4).
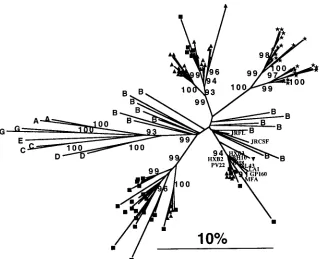
A second anomaly in this sequence set is the presence of inter-patient sample pairs with higher degrees of similarity than intra-patient pairs, when HXB2-like sequences are ex-cluded. For example, 144C3D is 95% identical to 141L18D (from patient 141) over the entire sequence, while having a range of similarity to other sequences from patient 144 of 79 to 84%. There are five sequences attributed to patient 144 that are more similar to the majority of sequences from patient 141 (all five are from CSF DNA). Likewise, there are five se-quences attributed to patient 141 that are more similar to the majority of sequences from patient 144 (all five are from brain tissue RNA). While the investigators of this study (37) have argued that this may be due to constraints of viruses localized to the central nervous system, a more plausible explanation is sample mix-up or contamination. As in the Briant et al. (6) case, the clearest illustration of the interpatient relationships’ similarities is a phylogenetic tree (Fig. 5). Figure 5 also high-lights the similarity of several sequences to HXB2 and related HTLV-IIIB and LAI laboratory strains of HIV-1 but is not useful for detecting or illustrating recombinant sequences. These investigators (37), when made aware of these issues, have reinitiated their own detailed analysis of these sequences and will consider how to interpret their data on the basis of all of the evidence once their analysis is complete (36a).
Methods for detecting sequence mix-ups.While laboratory procedures to minimize PCR contamination have been put forward (23, 25, 44), a standard protocol designed to reveal potential problems with newly generated nucleic acid se-quences is lacking. Although much of the protocol that we outline below is specific to HIV-1 env sequences, it should be extendible to sequences of other genes and other organisms.
[image:4.612.59.298.91.227.2](i) Error check base calls.As sequences approach their final form, there should be appropriate error checking; this usually includes verification of ambiguous positions, examination of sequences derived from complementary strands, scanning for open reading frames, and redundant sequencing. Novel or unusual sites of variation within a set of new sequences should also be checked. For example, blocks of unique amino acids, potentially due to two frameshift mutations (or errors) to move
TABLE 1. Distribution of mother and infant sequences from the four pairs studied by Briant et al. (6)a
Pair Individual
No. of sequences in phylogenetic group:
1 2 3 4 U
A Mother 30 1
Child 19 3 1
B Mother 26 17
Child 3 22
C Mother 4 24 1
Child 4 12 1
D Mother 38 1
Child 15
aDistribution of mother and infant sequences from the four pairs studied by Briant et al. (6) (pairs A to D) that fall into five phylogenetic groups (groups 1 to 4 and U) shown in Fig. 3. Only sequences that span the complete 319 to 325-nucleotide region studied are included.
on November 9, 2019 by guest
http://jvi.asm.org/
the translation out of and then in proper reading frame should also be rechecked. These are most clearly recognized following the generation of a multiple sequence alignment.
(ii) Considerations for the use of PCR and the generation of sequence data. With PCR approaches, there is an inherent error rate that should be taken into account. Assuming an average mutation rate of 1 base per 10,000 incorporated, each 1-kb amplicon is expected to contain an average of seven mutations (and therefore 0.7% divergence) after the 70 cycles of PCR normally used in nested reactions. A second point is that quite often the pool of HIV-1 template molecules being amplified is quite small, typically from perhaps 1 to 100 pro-viruses permg of cellular DNA. Genital fluid compartments contain less, but plasma RNA contains many more templates,
[image:5.612.72.483.73.565.2]typically from 100 to 100,000 templates per 100ml of fluid. In the case of RNA templates, however, amplification efficiency can be quite low, depending on the method of storage, han-dling, and age of the sample, as well as the target length. The result can often be that the complexity of the amplifiable tem-plate mixture is close to that of the number of clones being examined, with a consequent risk of cloning and sequencing products from the same initial template. Hence, many of the observed differences are actually due to PCR error alone. A means of circumventing both problems is to perform endpoint dilution of the DNA or cDNA sample to achieve a single template molecule in each reaction, followed by PCR and direct sequencing of the products (3). Using this procedure, even if an error occurs in the first cycle of PCR, it will be FIG. 3. Neighbor-joining phylogenetic trees for the sequences from the study of Briant et al. (6). Numerals 1 to 4 correspond to the four phylogenetic groups of sequences, while U indicates an indeterminate grouping (see text). Solid and open symbols represent mother and child for pair A (squares), pair B (triangles), pair C (circles), and pair D (stars); multiple identical sequences are designated by the appropriate combination of symbols. (a) Analysis of full-length sequences only. Numbers at nodes of the tree define instances of support in.70% of 400 bootstrap resamplings. The scale bar represents 5% nucleotide sequence diver-gence. (b) Analysis of all the sequences (except three, see Table 2, ND column) deposited in GenBank from the study of Briant et al. The scale bar represents 10% nucleotide sequence divergence.
on November 9, 2019 by guest
http://jvi.asm.org/
present at no more than 25% of the bases at that position in the mixture and thus would not result in an erroneous base call when the mixture is sequenced.
(iii) Search new sequences against local and public data-bases for close relatives.New sequences should be compared with all available databases of related sequences. Sequences both from in-house laboratory strains and from one of the publicly accessible sequence databases (GenBank, EMBL, and DDBJ) should be examined for high levels of similarity. In-spection of similarity to known sequences of laboratory strains can be done visually or much more efficiently with sequence analysis programs and desktop computers (e.g., MacVector and IBI Pustell). The use of larger computers (mainframe or workstation computers) and more sophisticated packages can improve the efficiency of this process still further. Searching for similarity to database sequences requires either local access to
recent releases of one of the databases or some level of access to the Internet. While a permanent direct connection would be most desirable, access through electronic mail is sufficient. Table 3 presents a number of different alternatives for running a commonly employed search tool, FASTA (30), using re-sources available through the Internet. If examination of either the set of locally available sequences or the public database reveals close sequence similarity or identity, this can be prima facie evidence of contamination or sequence mix-up. Such tests are increasingly meaningful as the length of the match in-creases and if it includes variable regions. Such sequences should be extracted and compared in multiple sequence align-ments to closely examine these relationships.
(iv) Generate multiple sequence alignments.As illustrated by the reanalysis of the studies (6, 37, 47) presented here, it is desirable to examine sequence relationships in as broad a con-text as feasible to investigate the possibility of sample mix-up or contamination. Methods of phylogenetic analysis can facil-itate such studies even when the explicit goals of a study do not include phylogeny reconstruction and can uncover unsus-pected patterns of relationships among sequences. Proper phy-logenetic analysis requires that compared stretches of se-quences be homologous (i.e., derived from a common ancestor). For this reason, the first step in any phylogenetic analysis is a multiple sequence alignment using all of the se-quences from a given project, representatives of local projects, and prototype sequences from a public database (especially those tagged in a FASTA search). Typically this procedure is carried out by a computer program that uses a progressive alignment method, first comparing all the sequences in pair-wise fashion, next aligning sequences that are most similar to each other, and then aligning progressively more dissimilar sequences to aligned sequence pairs. There are multiple sequence alignment programs available in most sequence analysis packages (e.g., PILEUP in the Wisconsin Sequence Analysis Package [GCG] [12] and GENALIGN in the Intelli-Genetics Suite [13]). The latest version of Clustal W (43) is available without cost by anonymous ftp for Macintosh, IBM-compatible personal computers, VMS, and UNIX (Ta-ble 4). Although all of these programs perform well, users should exercise care and visually check and refine all comput-er-generated multiple alignments as necessary. Useful tools for conducting this refinement include the ESEE, MACAW (36), MacClade (26), MASE (9), and GDE (39) programs available from sources listed in Table 4.
(v) Generate a distance matrix to examine cases of high levels of unexpected similarity.When assessing the validity of origin of a data set of sequences, the age of the local HIV-1 epidemic and the number of founder strains must be consid-ered. We were able to conclude that the Briant et al. (6) linkages were most probably due to sample mix-up in part because of the breadth of diversity found between the phylo-genetically distinct groupings that were roughly consistent with the known age of the epidemic in Europe. Such a conclusion would have been harder to make in a region in which the epidemic has been much shorter lived, and consequently, where the virus populations have not diverged as much, such as Thailand in the early 1990s (16). It has been estimated that the
env gene is diversifying within individuals and within the
pop-ulation of infected individuals at an average rate of 1% per year (21, 40).
[image:6.612.59.297.95.497.2]The degree of difference expected will also differ from gene to gene. The guidelines belows are based upon our experience and generally apply to full-length (or a shorter segment con-taining at least one of the five variable regions) env/gp120 sequences from B-subtype (env gene sequence clade) HIV-1
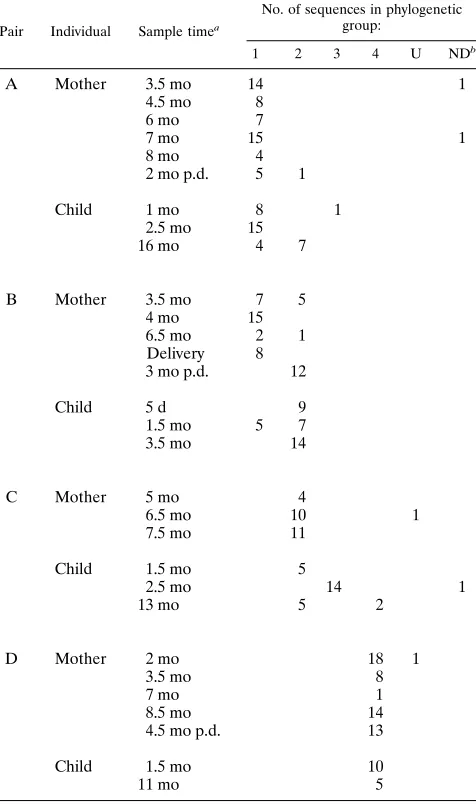
TABLE 2. Distribution of all (including incomplete) sequences from the Briant et al. (6) study deposited in GenBank
Pair Individual Sample timea
No. of sequences in phylogenetic group:
1 2 3 4 U NDb
A Mother 3.5 mo 14 1
4.5 mo 8
6 mo 7
7 mo 15 1
8 mo 4
2 mo p.d. 5 1
Child 1 mo 8 1
2.5 mo 15
16 mo 4 7
B Mother 3.5 mo 7 5
4 mo 15
6.5 mo 2 1
Delivery 8
3 mo p.d. 12
Child 5 d 9
1.5 mo 5 7
3.5 mo 14
C Mother 5 mo 4
6.5 mo 10 1
7.5 mo 11
Child 1.5 mo 5
2.5 mo 14 1
13 mo 5 2
D Mother 2 mo 18 1
3.5 mo 8
7 mo 1
8.5 mo 14
4.5 mo p.d. 13
Child 1.5 mo 10
11 mo 5
a
Sample times indicated correspond to the time the samples were obtained, expressed as the age of the child or the month of pregnancy for the mother unless indicated otherwise. d, days; p.d., postdelivery.
b
ND indicates sequences that were not possible to include in the phylogenetic analysis because of nonoverlap with other sequences.
on November 9, 2019 by guest
http://jvi.asm.org/
isolated from North America or Western Europe from about 1990 onward. These guidelines might be useful to uncover sequence relationships that might represent problems: (i) #2% divergence over a variable region of .100 bp is highly suspicious; (ii) divergence of 2 to 5% merits further investiga-tion, except in cases of close epidemiological linkage; and (iii) divergence of 5 to 20% is the expected range of the most similar epidemiologically unlinked sequences.
Complete gag gene sequences are somewhat more similar than env, with a percent difference to most similar database sequences between 4 and 8%. Since gag encodes several gene products with various levels of evolutionary constraints, mean pairwise differences are lowest for the p24 and p6 (which over-laps with pol) regions (approximately 3 to 4%), higher for the p17 region (approximately 5 to 8%), and highest for the p7 region (8 to 12%) (48). Thus, unexpected sequence differences for gag of less than about 3% should be investigated. The pol gene sequences are more highly conserved; again, unexpected near-identity or high similarity (,2%) should be examined closely.
These distances are determined in a simple distance matrix that can be generated by any one of a number of programs
including DNADIST (11), Distances (from GCG) (12), MEGA (22), and MASE (9) (Table 4). We should emphasize that these levels of similarity serve as guidelines. Unexpected levels of similarity may indeed indicate either epidemiological linkage or a hitherto unobserved biological conservation, but in neither case should they be ignored. If researchers suspect epidemiological linkage, they should indicate so and provide any epidemiological information available.
[image:7.612.73.542.72.441.2]Since HIV-1 sequences diverge at approximately 1% per year (21, 40), two sequences from one individual can be ap-proximately 5 to 10% different from each other, over a region of env discussed above, if the individual has been infected for 5 to 10 years. It is not unexpected, however, to find sequences with a high degree of sequence identity within such an indi-vidual, because any two virions may have shared a very recent common ancestor within the patient. Thus, intrapatient se-quence variability is expected to cover a range up to 100% sequence identity. Between patients, however, sequences are expected to diverge with time since the last common ancestor. Multiple infections are thought to be relatively rare such that, even in a group of individuals with epidemiological contact FIG. 4. Sequence alignments of two sequences from the study by Shapshak et al. (37) compared with the HIV-1 laboratory reference strain HXB2. Positions in 144L1D and 144L6D that are identical to HXB2 are indicated by periods. Sites where 144L1D differs from 144L6D but is identical to HXB2 are indicated by small solid circles. Sites where 144L1D and 144L6D are identical but differ from HXB2 are indicated by @. Sites where 144L6D differs from 144L1D but is identical to HXB2 are indicated by asterisks, and sites where all three sequences differ are indicated by equal signs.
on November 9, 2019 by guest
http://jvi.asm.org/
after the initial infection, the virus is not recirculated to create a more homogeneous population.
Because even very rare events are still possible, sequence analysis alone can never prove that epidemiological linkage versus a laboratory-associated problem exists. However, when the data indicates that a very rare event has occurred, investi-gators should make all reasonable efforts to show that there was not a problem with the data.
We can only provide rough guidelines for the percentage of identity expected between viruses in epidemiologically un-linked infections, because these data will vary with the age of the epidemic in any given area and with the size of the infected
population. It should be emphasized that pairwise distance calculations alone cannot detect all possible problems. Recom-bination during PCR (27) can generate sequences with average distances that do not reflect the presence of local regions of identity. We thus recommend a visual inspection of multiple sequence alignments, in addition to pairwise distance calcula-tions.
[image:8.612.149.470.72.331.2](vi) Perform phylogenetic analyses.A complete discussion of phylogenetic methods is beyond the scope of this article. Documentation for both PAUP (41) and the PHYLIP package (11) is excellent (Table 4). In the case of the PHYLIP docu-mentation, the Main documentation (main.doc) is highly rec-FIG. 5. Neighbor-joining phylogenetic trees for the sequences from the study of Shapshak et al. (37), along with various sequences from the GenBank database (details available from authors). Letters A to E and G indicate the env sequence clade to which the sequence is assigned. JRCSF and JRFL were isolated from CSF and brain tissue of a single patient (JR) (20). BH8, BH10, GP160, HXB2, HXB3, LAI, MFA, NL43, and PV22 are HTLV-IIIB-like sequences (7). Sequences attributed to viruses from patients 141, 144, and 149 in the Shapshak et al. study are designated as squares, triangles, and stars, respectively; the inverted triangle indicates the probable recombinant 144L1D (see text and Fig. 4). Numbers at nodes of the tree indicate bootstrap support (rounded to the lower integer) in.90% of 1,000 bootstrap samples. The scale bar indicates 10% sequence divergence.
TABLE 3. Approaches for utilizing the FASTA program
Configuration Software Platforma
URLb
Commentsc
Local fasta 2.0u D, M, U ftp://ftp.virginia.edu/pub/fasta a
Local GCG fasta U, V a, b
WWWd Netscapee M, U, W http://www.dna.affrc.go.jp/htdocs/Blast/fasta.html c
http://www.ebi.ac.uk/searches/fasta.html c
http://pmgm.stanford.edu/cgi-bin/fastaq_form?options5simple d
http://www.crihan.fr/www/fasta.html d
Electronic mail mailfasta U ftp://ftp.bio.indiana.edu/molbio/search/mailfasta.shar c
a
Computing environment: D, DOS; M, Macintosh; U, UNIX; V, VAX/VMS; W, Windows. b
URL, Uniform Resource Locator to obtain software (ftp) or service (http). c
a, requires local installation of sequence databases; b, commercial software; c, search results returned by electronic mail; d, search results returned by World Wide Web.
d
WWW, World Wide Web (requires full-time network connection). e
Netscape or other World Wide Web browser software.
on November 9, 2019 by guest
http://jvi.asm.org/
ommended. For two reviews of current methods, providing a stronger background in phylogenetic theory, see Swofford et al. (42) or Felsenstein (10). While the character-based methods (parsimony and maximum likelihood) are generally more ro-bust, the distance-based neighbor-joining method is usually sufficient to determine the correct placement of the major nodes in a tree and provides a quick means for visualizing the general relatedness of sequences, especially in large data sets. Viewing a phylogenetic tree can help to determine which se-quences to focus attention on in a multiple sequence align-ment. It should be noted again that a phylogenetic tree may not always be useful for detection of recombinant sequences, as illustrated by the placement of the recombinant sequence in Fig. 5 as an outlier of the HXB2-related cluster.
Once sequences are aligned, phylogenetic analysis can be performed. For distance-based methods, this involves first cal-culating a matrix of pairwise distances. Usually, these distances are calculated with corrections so that they fit one of several evolutionary models. The simplest of these is the Jukes-Cantor correction (15), which corrects for multiple substitutions at each site. More-complicated models may be applied that con-sider that transversions (replacement of a purine by a pyrimi-dine or vice versa) occur at different rates than transitions (replacement of one purine or pyrimidine by another, respec-tively) (17, 29). The typical method used in AIDS research is the two-parameter method of Kimura (17). The purpose of all of these corrections is to adjust the branch lengths so that they are at least partially compensated for homoplasy, specifically, multiple substitutions at a given site. If the sole purpose of the phylogenetic tree is to reveal cases of identity or similarity (as in the preceding section) then no correction is really required; however, computer programs can apply these corrections quickly and conveniently.
Neighbor-joining phylogenetic analysis can be performed on the matrix of pairwise distances. As with the multiple align-ment, there are several options available for various computer platforms. Table 4 includes a relatively complete list of pro-grams and their sources, but we will comment here on several. Version 8.0 and later versions of the widely available GCG package (12) include programs (Distances and GrowTree) to calculate evolutionary trees by the neighbor-joining method. The popular and freely available PHYLIP package also in-cludes two programs (DNADIST and NEIGHBOR) to calcu-late the distance matrix and phylogenetic trees, respectively. The next version of PAUP (to be available commercially [Ta-ble 4]) includes methods for calculating neighbor-joining phy-lograms. Finally, in addition to generating alignments, Clustal
W will also calculate evolutionary trees by means of neighbor joining as mentioned above, but users should be advised to avoid the temptation of running the phylogenetic analysis with-out first inspecting the alignment. Clustal W can read and write several formats of multiply aligned sequences, so sequences may be examined and edited, if necessary, using a sequence editor of the user’s preference.
A record should be kept of the programs used and the exact settings of variables and modes within the programs. A com-plete description of these parameters should be included in the methods section of the manuscript. GenBank accession num-bers for all sequences used in analyses (including database sequences) should also be provided.
Gap stripping.An issue of critical importance to evolution-ary analyses of sequences is that sites and regions being com-pared are truly homologous (i.e., descendant from a common ancestor). For variable-length regions of HIV-1 env sequences, alignment is a particularly difficult task and insertions may reflect independent events rather than common ancestry. Upon adequate inspection, it is clear that segments of se-quences in hypervariable regions are repeatedly lost or reiter-ated. Unfortunately, there are no programs that can differen-tiate homoplasy from shared ancestry. The common practice in most evolutionary analyses of HIV-1 env sequences is to re-move all sites at which one or more of the sequences are gapped; gap stripping is the colloquial term for this process. Investigators should indicate whether this procedure is fol-lowed, as well as the length of generated sequence and the length of analyzed sequences.
[image:9.612.60.557.82.195.2]We recommend the following procedure for gap stripping. (i) A multiple alignment of nucleotide or amino sequences is produced by automated procedures outlined above with man-ual refinement of the alignment. (ii) The alignment is visman-ually inspected to identify regions of uncertain homologies and gaps—most alignment programs will align sequences to some extent even when there is little or no homology among the aligned segments. Therefore, amino acid alignments are pref-erable, since such regions in them are more readily recogniz-able. (iii) All sites of uncertain homologies in the alignment are removed before further analyses are done. Sites immediately adjacent to variable-length regions should be scrutinized closely for patterns that would reflect uncertain homologies and removed from the alignment if they are seen. It might be argued that sites showing clear-cut single insertions or dele-tions in either a single sequence or closely related sequences ought not to be deleted because the homologies in such an instance are clear. However, such regions in general do not
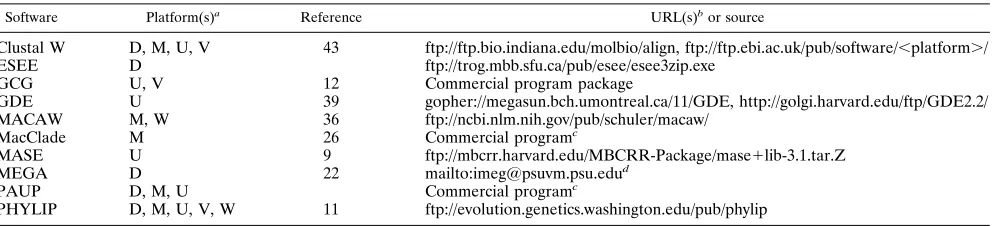
TABLE 4. Computer programs and packages for manipulating and analyzing multiple sequence data sets
Software Platform(s)a
Reference URL(s)b
or source
Clustal W D, M, U, V 43 ftp://ftp.bio.indiana.edu/molbio/align, ftp://ftp.ebi.ac.uk/pub/software/,platform./
ESEE D ftp://trog.mbb.sfu.ca/pub/esee/esee3zip.exe
GCG U, V 12 Commercial program package
GDE U 39 gopher://megasun.bch.umontreal.ca/11/GDE, http://golgi.harvard.edu/ftp/GDE2.2/
MACAW M, W 36 ftp://ncbi.nlm.nih.gov/pub/schuler/macaw/
MacClade M 26 Commercial programc
MASE U 9 ftp://mbcrr.harvard.edu/MBCRR-Package/mase1lib-3.1.tar.Z
MEGA D 22 mailto:[email protected]d
PAUP D, M, U Commercial programc
PHYLIP D, M, U, V, W 11 ftp://evolution.genetics.washington.edu/pub/phylip
a
Computing environment: D, DOS; M, Macintosh; U, UNIX; V, VAX/VMS; W, Windows. b
URL, Uniform Resource Locator to obtain software (ftp) or service (http). c
Available from Sinauer Associates, Inc., 23 Plumtree Rd., Sunderland, MA 01375-0407. Phone: (413) 549-4300. Fax: (413) 549-1118. Electronic mail address: [email protected].
d
Available from Institute of Molecular Evolutionary Genetics, 328 Mueller Laboratory, The Pennsylvania State University, University Park, PA 16802.
on November 9, 2019 by guest
http://jvi.asm.org/
make a large contribution to the evolutionary analysis and are generally removed for expedience and uniformity of proce-dure.
Analysis for evidence of recombination. Numerous occur-rences of mosaicism between divergent HIV-1 viruses have been recognized recently. The best-documented cases involve apparent recombinants between viruses from different gene sequence clades (24, 32, 33) or from coinfections with B clade viruses for which the parental strains were inferred (51). Thus, recombinants are most readily identified in cases in which relatively long segments (e.g., .200 bp) are replaced and which involve highly divergent viruses, e.g., members of differ-ent clades. Methods which allow examination of sequences for evidence of recombination have been reported (31, 35), and one method is particularly easy to use because it is simple, fast, and automated (38). Recombination can be expected to occur in populations infected with multiple sequence subtypes, and measures to screen for mosaic genomes should be applied routinely in such populations. Recombination may also fre-quently occur between more closely related viruses, such as between descendants of a single founder strain evolving within one individual, but methods to readily detect these latter events have not yet been developed.
Submit sequences to GenBank.Those submitting sequences to GenBank or other databases need to exercise care that vector sequences are removed from submitted entries. Accord-ingly, one early step in the analysis of new sequences is to compare them to the plasmid or phage vector sequences that might have been used in their generation. In addition, primer sequences should be trimmed from sequences generated by PCR methods prior to submission since they are not deter-mined by the template. Frequently, single base deletions or insertions at the 39end of the primer can be misinterpreted as frameshifts. Also, while seemingly minor when viewed in the context of other defects in sequence data, the inclusion of primer sequences will erroneously reduce levels of reported variation for these segments when they are subsequently used in surveys of sequence variation.
Submission of data and sequence alignments for peer re-view.To enhance the peer review process, authors could pro-vide reviewers with information in addition to the manuscript. These items might include the following: (i) sequences of nu-cleotides (and inferred amino acids, where applicable) aligned to either a consensus sequence or some other representative sequence (an ideal format of these alignments would use dots or some other symbol to indicate identity to the consensus sequence) (ii), a matrix of distances or identities for each sequence in the study, and (iii) a single neighbor-joining tree that includes all of the sequences from the study.
If any or all of these items would incur an extraordinary obstacle for the authors, they could provide the reviewers with the sequences on floppy disk, either in an aligned format or single-sequence-per-file format. Of course, the reviewers would be ob-ligated to treat these additional materials as confidential and return them to the authors, as is normally the practice for any other material or data in the manuscript.
Those who work in the generation and analysis of nucleotide sequence data realize the large amount of work that goes into the production and interpretation of these data. It is distressing when days of hard work fall short of the intended goals because of sample mishandling. Even more distressing, however, is the inclusion of problematic data within a larger body of data that results in invalid conclusions due to errors arising from con-tamination or sample mix-up. The exquisite sensitivity of PCR techniques is both the essence of its utility and the basis for potential errors. We have introduced the methods we have
outlined here into our own protocols over the past few years to try to circumvent some of the obviously identifiable sources of error. Clearly, more subtle problems may be missed. We hope that the intent of this article will be correctly perceived as constructive and invite comments and improvement on the methods suggested.
This work was supported by an NIH/DAIDS and DOE interagency agreement 3-Y01-AI-70001-13 to B.T.M.K. and by Public Health Ser-vice grants AI35170 to B.H.H., HD31756 and AI45218 to S.M.W., and AI32885 and AI34783 to J.I.M.
We are grateful for the cooperative efforts of Paul Shapshak, Ke-Qin Xin, and Keith Crandall in providing information concerning their sequence data. We thank Gerald Myers and Allen Rodrigo for helpful suggestions.
REFERENCES
1. Ahmad, N., B. M. Baroudy, R. C. Baker, and C. Chappey. 1995. Genetic analysis of human immunodeficiency virus type 1 envelope V3 region isolates from mothers and infants after perinatal transmission. J. Virol. 69:1001– 1012.
2. Antonioli, I. M., C. Baumberger, S. Yerly, and L. Perrin. 1995. V3 sequences in primary HIV-1 infection. AIDS 9:11–17.
3. Balfe, P., P. Simmonds, C. A. Ludlam, J. O. Bishop, and A. J. Leigh Brown. 1990. Concurrent evolution of human immunodeficiency virus type 1 in patients infected from the same source: rate of sequence change and low frequency of inactivating mutations. J. Virol. 64:6221–6233.
4. Barbacid, M. 1986. Oncogenes and human cancer: cause or consequence? Carcinogenesis 7:1037–1042.
5. Briant, L., J. Puel, C. M. Wade, A. J. Leigh Brown, and M. Guyader. 1995. Reply to Korber et al. Nature (London) 378:243–244.
6. Briant, L., C. M. Wade, J. Puel, A. J. Leigh Brown, and M. Guyader. 1995. Analysis of envelope sequence variants suggests multiple mechanisms of mother-to-child transmission of human immunodeficiency virus type 1. J. Vi-rol. 69:3778–3788.
7. Chang, S. Y., B. H. Bowman, J. B. Weiss, R. E. Garcia, and T. J. White. 1993. The origin of HIV-1 isolate HTLV-IIIB. Nature (London) 363:466–469. 8. Desrosiers, R. C., M. D. Daniel, N. L. Letvin, N. W. King, and R. D. Hunt.
1987. Origins of HTLV-4. Nature (London) 327:107.
9. Faulkner, D. V., and J. Jurka. 1988. Multiple aligned sequence editor (MASE). Trends Biochem. Sci. 13:321–322.
10. Felsenstein, J. 1988. Phylogenies from molecular sequences: inference and reliability. Annu. Rev. Genet. 22:521–565.
11. Felsenstein, J. 1993. PHYLIP (Phylogeny Inference Package), version 3.5c. University of Washington, Seattle.
12. Genetics Computer Group. 1994. Wisconsin Sequence Analysis Package, version 8.0. Genetics Computer Group, Inc., Madison, Wis.
13. IntelliGenetics. 1991. Intelligenetics Suite, version 5.4. IntelliGenetics, Inc., Campbell, Calif.
14. Jaffe, H. W., J. M. McCurdy, M. L. Kalish, T. Liberti, G. Metellus, B. H.
Bowman, A. R. Neasman, and J. J. Witte.1994. Lack of transmission of human immunodeficiency virus in the practice of a dentist with AIDS. Ann. Intern. Med. 121:855–859.
15. Jukes, T. H., and C. R. Cantor. 1969. Evolution of protein molecules, p. 21–132. In H. N. Munro (ed.), Mammalian protein metabolism. Academic Press, New York.
16. Kalish, M. L., A. Baldwin, S. Raktham, C. Wasi, C.-C. Luo, G. Schochetman,
T. D. Mastro, N. Young, S. Vanichseni, H. Rubsamen-Waigmann, H. von Briesen, J. I. Mullins, E. Delwart, B. Herring, J. Esparza, W. L. Heyward, and S. Osmanov.1995. The evolving molecular epidemiology of HIV-1 envelope subtypes in injecting drug users in Bangkok, Thailand: implications for HIV vaccine trials. AIDS 9:850–856.
17. Kimura, M. 1980. A simple method for estimating evolutionary rates of base substitutions through comparative studies of nucleotide sequences. J. Mol. Evol. 16:111–120.
18. Korber, B. T. M., G. Learn, J. I. Mullins, B. H. Hahn, and S. Wolinsky. 1995. Protecting HIV sequence databases. Nature (London) 378:242–243. 19. Kornfeld, H., N. Riedel, G. A. Viglianti, V. Hirsch, and J. I. Mullins. 1987.
Cloning of HTLV-4 and its relation to simian and human immunodeficiency viruses. Nature (London) 326:610–613.
20. Koyanagi, Y., S. Miles, R. T. Mitsuyasu, J. E. Merrill, H. V. Vinters, and
I. S. Y. Chen.1987. Dual infection of the central nervous system by AIDS viruses with distinct cellular tropisms. Science 236:819–822.
21. Kuiken, C. L., and B. Korber. 1994. Epidemiological significance of intra-and inter-person variation of HIV-1. AIDS 8:s73–s83.
22. Kumar, S., K. Tamura, and M. Nei. 1993. MEGA: molecular evolutionary genetic analysis, version 1.02. Pennsylvania State University, University Park, Pa.
23. Kwok, S., and R. Higuchi. 1989. Avoiding false positives with PCR. Nature
on November 9, 2019 by guest
http://jvi.asm.org/
(London) 339:237–238. (Erratum, 339:490.)
24. Li, W.-H., M. Tanimura, and P. M. Sharp. 1988. Rates and dates of diver-gence between AIDS virus nucleotide sequences. Mol. Biol. Evol. 5:313–330. 25. Longo, M. C., M. S. Berninger, and J. L. Hartley. 1990. Use of uracil DNA glycosylase to control carry-over contamination in polymerase chain reac-tions. Gene 93:125–128.
26. Maddison, W. P., and D. R. Maddison. 1992. MacClade, version 3.01. Si-nauer and Associates, Sunderland, Mass.
27. Meyerhans, A., J. P. Vartanian, and S. Wain-Hobson. 1990. DNA recombi-nation during PCR. Nucleic Acids Res. 18:1687–1691.
28. Mulder-Kampinga, G. A., A. Simonon, C. L. Kuiken, J. Dekker, H. J.
Scherpbier, P. van de Perre, K. Boer, and J. Goudsmit.1995. Similarity in env and gag genes between genomic RNAs of human immunodeficiency virus type 1 (HIV-1) from mother and infant is unrelated to time of HIV-1 RNA positivity in the child. J. Virol. 69:2285–2296.
29. Nei, M., and L. Jin. 1989. Variances of the average numbers of nucleotide substitutions within and between populations. Mol. Biol. Evol. 6:290–300. 30. Pearson, W. R., and D. J. Lipman. 1988. Improved tools for biological
sequence comparison. Proc. Natl. Acad. Sci. USA 85:2444–2448. 31. Robertson, D. L., B. H. Hahn, and P. M. Sharp. 1995. Recombination in
AIDS viruses. J. Mol. Evol. 40:249–259.
32. Robertson, D. L., P. M. Sharp, F. E. McCutchan, and B. H. Hahn. 1995. Recombination in HIV-1. Nature (London) 374:124–126.
33. Sabino, E. C., E. G. Shpaer, M. G. Morgado, B. T. M. Korber, R. Diaz, V.
Bongertz, S. Cavalcante, B. Galvao-Castro, J. I. Mullins, and A. Mayer.
1994. Identification of HIV-1 envelope genes recombinant between subtypes B and F in two epidemiologically linked individuals in Brazil. J. Virol.
68:6340–6346.
34. Saitou, N., and M. Nei. 1987. The neighbour-joining method: a new method for reconstructing phylogenetic trees. Mol. Biol. Evol. 4:406–425. 35. Salminen, M. O., J. K. Carr, D. S. Burke, and F. E. McCutchan. 1995.
Identification of breakpoints in intergenotypic recombinants of HIV-1 by bootscanning. AIDS Res. Hum. Retroviruses 11:1423–1425.
36. Schuler, G. D., S. F. Altschul, and D. J. Lipman. 1991. A workbench for multiple alignment construction and analysis. Proteins 9:180–190. 36a.Shapshak, P. Personal communication.
37. Shapshak, P., I. Nagano, K.-Q. Xin, W. Bradley, C. B. McCoy, N. C. J. Sun,
M. Yoshioka, C. Petito, K. Goodkin, R. Douyon, A. K. Srivastava, and K. A. Crandall. 1995. HIV-1 heterogeneity and cytokines: neuropathogenesis. Adv. Exp. Med. Biol. 373:225–238.
38. Siepel, A. C., A. L. Halpern, C. Macken, and B. T. M. Korber. 1995. A computer program designed to rapidly screen for HIV-1 intersubtype
re-combinant sequences. AIDS Res. Hum. Retroviruses 11:1413–1416. 39. Smith, S. W., R. Overbeek, C. R. Woese, W. Gilbert, and P. M. Gillevet. 1994.
The Genetic Data Environment: an expandable GUI for multiple sequence analysis. Comput. Appl. Biol. Sci. 10:671–675.
40. Smith, T. F., A. Srinivasan, G. Schochetman, M. Marcus, and G. Myers. 1988. The phylogenetic history of immunodeficiency viruses. Nature (Lon-don) 333:573–575.
41. Swofford, D. L. 1993. PAUP 3.1.1: Phylogenetic Analysis Using Parsimony, version 3.1.1. Illinois Natural History Survey, Champaign, Ill.
42. Swofford, D. L., G. J. Olsen, P. J. Waddell, and D. M. Hillis. 1996. Phylo-genetic inference, p. 407–514. In D. M. Hillis, C. Moritz, and B. K. Mable (ed.), Molecular systematics, 2nd ed. Sinauer Associates, Sunderland, Mass. 43. Thompson, J. D., D. G. Higgins, and T. J. Gibson. 1994. CLUSTAL W: improving the sensitivity of progressive multiple sequence alignment through sequence weighting, position-specific gap penalties and weight matrix choice. Nucleic Acids Res. 22:4673–4680.
44. Udaykumar, J. S. Epstein, and I. K. Hewlett. 1993. A novel method employ-ing UNG to avoid carry-over contamination in RNA-PCR. Nucleic Acids Res. 21:3917–3918.
45. Wain-Hobson, S. 1992. Human immunodeficiency virus type 1 quasispecies in vivo and ex vivo. Curr. Top. Microbiol. Immunol. 176:181–1993. 46. Wolinsky, S. M., C. M. Wike, B. T. M. Korber, C. Hutto, W. P. Parks, L. L.
Rosenblum, K. J. Kunstman, M. R. Furtado, and J. L. Mun˜oz.1992. Selec-tive transmission of human immunodeficiency virus type-1 variants from mother to infants. Science 255:1134–1137.
47. Xin, K.-Q., P. Shapshak, S. Kawamoto, I. Nagano, C. B. McCoy, and K.
Okuda.1995. Highly divergent env sequences of HIV-1 B subtype with two novel V3 loop motifs detected in an AIDS patient in Miami, Florida. AIDS Res. Hum. Retroviruses 11:1139–1141.
48. Yoshimura, F. K., K. Diem, G. H. Learn, Jr., S. Riddell, and L. Corey. Unpublished data.
49. Zhang, L. Q., P. MacKenzie, A. Cleland, E. C. Holmes, A. J. Leigh Brown,
and P. Simmonds.1993. Selection for specific sequences in the external envelope protein of human immunodeficiency virus type 1 upon primary infection. J. Virol. 67:3345–3356.
50. Zhu, T., H. Mo, N. Wang, D. S. Nam, Y. Cao, R. A. Koup, and D. D. Ho. 1993. Genotypic and phenotypic characterization of HIV-1 in patients with pri-mary infection. Science 261:1179–1181.
51. Zhu, T., N. Wang, A. Carr, S. Wolinsky, and D. D. Ho. 1995. Evidence for coinfection by multiple strains of human immunodeficiency virus type 1
subtype B in an acute seroconvertor. J. Virol. 69:1324–1327.