STROKE
REHABILITATION
DISSERTATION SUBMITTED IN FULFILLMENT OF
THE REGULATIONS FOR THE AWARD OF
M.D. PHYSICAL MEDICINE AND REHABLITATION
PSG INSTITUTE OF MEDICAL SCIENCES AND
RESEARCH
THE TN DR MGR MEDICAL UNIVERSITY
CHENNAI, TAMILNADU
STROKE
REHABILITATION
DISSERTATION SUBMITTED IN FULFILLMENT OF
THE REGULATIONS FOR THE AWARD OF
M.D. PHYSICAL MEDICINE AND REHABLITATION
PSG INSTITUTE OF MEDICAL SCIENCES AND
RESEARCH
THE TN DR MGR MEDICAL UNIVERSITY
CHENNAI, TAMILNADU
STROKE
REHABILITATION
DISSERTATION SUBMITTED IN FULFILLMENT OF
THE REGULATIONS FOR THE AWARD OF
M.D. PHYSICAL MEDICINE AND REHABLITATION
GUIDE
PROF. DR. K. RAMADOSS MD., DM.,
DEPARTMENT OF NEUROLOGY
PSG INSTITUTE OF MEDICAL SCIENCES AND
RESEARCH
THE TN DR MGR MEDICAL UNIVERSITY
CHENNAI, TAMILNADU
CERTIFICATE
This is to certify that the thesis entitled “STROKE
REHABILITATION” is a bonafide work of Dr. V RAMAMOORTHY
done under my direct guidance and supervision in the Department of Neurology, PSG Institute of Medical Sciences and Research, Coimbatore in fulfillment of the regulations of the TN. Dr MGR Medical University, Chennai for the award of MD Degree in Physical Medicine and Rehabilitation.
ACKNOWLEDGEMENT
This dissertation project would be incomplete without the mention of some of the important people who have been pivotal in helping me to carryout this study.
I am grateful to my Guide Prof. Dr. K. Ramadoss M.D, DM. who has helped me starting from the designing of the study to the statistical analysis. Without his help it would have been impossible to complete this study successfully.
I thank the Principal and the Medical Director for allowing me to utilize the clinical materials and other facilities available in the hospital. I am grateful to all the teaching staffs of the department for helping me in this study.
I also wish to express my thanks to my patients who are the essence of my profession. I pray for their good health.
CONTENTS
Page No.
1. INTRODUCTION 01-02
2. AIMS AND OBJECTIVES 03
3. REVIEW OF LITERATURE 04-34
4. MATERIALS AND METHODS 35-37
5. STATISTICAL ANALYSIS & DISCUSSION 38-58
6. CONCLUSION 59-60
7. BIBLIOGRAPHYH 61-65
7. ANNEXURE
PROFORMA 66-92
1
INTRODUCTION
Stroke is one of the leading causes of mortality and morbidity worldwide. Approximately 20 million people each year suffer from stroke and of these 5 million will not survive1. Developing countries account for 85% of global deaths from stroke. Stroke is also a leading cause of functional impairments, with 20% survivors requiring institutional care after 3 months and 15%-30% being permanently disabled.
Stroke is the most common causes of chronic disability. Of survivors, an estimated one third will be functionally dependent after 1 year experiencing difficulty with activities of daily living (ADL), ambulation, speech and so forth2. Stroke survivors represent the largest group admitted in inpatient rehabilitation hospitals. Another indicator of disability is the fact that approximately 26% of patients with stroke are institutionalized in a nursing home.
Modern advances in stroke research aid better management of stroke patients. What was once a disorder with a pessimistic prognosis has become a treatable disease. In the past, recovery from motor deficit after a stroke remains a puzzling scientific question. Now it has been found out that,
neuronal reorganization,
dynamic changes in the somatotopia of primary motor cortex, recruitment of remote cortices and
participation of associative cortices
are clearly part of rearrangement process.3 It is likely that such mechanisms represent the basis of clinical recovery of stroke patients.
2
restore lost activities, improve quality of life and decrease the long term economic cost of stroke. Proper patients’ selection, realistic goal setting, active participation of both the patient and family and the use of an interdisciplinary team approach are important for the success of stroke rehabilitation. It is desirable to start rehabilitation programs to stroke patients once they are medically stable. Early intervention helps faster motor recovery.
Four programs of treatment, for patients with motor control problems caused by brain damage, were developed in the mid- 1950 and early 1960 based on neurophysiological and developmental research of the time as well as careful observation of the responses made by patients when being handled, positioned, touched or moved in various ways. These traditional therapeutic approaches are,
1. Rood’s Approach
2. Bobath Neuro Development Treatment 3. Brunnstrom’s Movement Therapy
4. Proprioceptive Neuro muscular Facilitation (PNF) Technique.
3
AIMS AND OBJECTIVES
The Primary objective of this study is
- to investigate the effect of intense sensory motor stimulation given in the form of electrical stimulation, olive oil massage and reeducation exercise program in augmenting motor recovery in stroke patients.
The Secondary objectives of this study are to assess the various factors which influence the stroke recovery like,
- the time interval between the onset of stroke and the initiation of rehabilitation program
- the risk factors for stroke
4
REVIEW OF LITERATURE
EPIDEMIOLOGIC ASPECTS
DEFINITION:
The world Health Organization (WHO) defines stroke as “rapidly developing clinical signs of focal (or global) disturbance of cerebral function, with signs lasting 24 hours or longer or leading to death with no apparent cause other than of vascular origin”. This definition includes subarachnoid hemorrhage but excludes transient ischemic attack and hemorrhage or infarction related to infection or tumor.
STROKE MORBIDITY AND MORTALITY IN INDIA4, 5
• Prevalence 55.6 per 100,000 all ages
• 0.63 million deaths(WHO 2005)
• 1.44 – 1.64 million cases of new strokes every year
• 6,398,000 Disability Adjusted Life Years (DALYs)
• 12% of strokes occur in the population aged<40 years
• 28-30 day case fatality ranges from 18-41%
AGE:
The incidence of first stroke rises exponentially with age. In the 55-to59-year-old age group, the risk of stroke is about 5% per year, whereas in the 80-to 84–year–old group the risk is almost 25% per year.6
GENDER
5
significant cause of morbidity and mortality in women, especially young women in the pregnancy and post-partum periods. More women under the age of 45 years die from stroke than from myocardial infarction. A disproportionate percentage of subarachnoid hemorrhages occur in women.
RACE:
Race related differences in incidence and mortality of strokes have also been demonstrated. When compared with whites, blacks have a higher incidence and mortality of stroke which may be in part attributable to a relatively late presentation for medical care. Asians have a higher incidence of stroke than whites but suffer less from heart disease.
GEOGRAPHY:
In India, the crude prevalence rate appears to be higher in urban compared to rural populations. The Parsi population in Mumbai appears particularly at risk, compared with the Indian population. The Parsi people migrated from Iran in the 7th Century to India it is argued that they are ethnically distinct from the Indian population.
PATHOLOGY OF STROKE
Stroke can be classified as hemorrhagic or ischemic in origin.
A) HEMORRHAGIC STROKE:
6
SUBARACHNOID HEMORRHAGE:
Subarachnoid hemorrhage (SAH) also is characterized by sudden, severe headache which may result in loss of consciousness. Vomiting is frequent. Patients can be younger and do not necessarily have preexisting hypertension. Most patients will have a stiff neck (Positive Kernig’s or Brudzinski’s signs). Head CT is most likely to reveal subarachnoid hemorrhage in the first 24 hours; thereafter, the chance of finding blood diminishes. Patients with no clear cause for SAH tend to have the best prognosis. 7 Mortality from subarachnoid hemorrhage is high.
B)ISCHEMIC STROKE:
Ischemic causes of stroke are related to thrombotic, embolic or hemodynamic factors. Thrombotic infarction in large vessels occurs when a thrombus forms on an atherosclerotic plaque. Lacunar infarcts occur in the deep, penetrating arteries where they branch at 90º from main intra cerebral arteries.
Ischemia may be diffuse or localized depending on cerebral blood flow (CBF). Normal CBF is 50 to 55ml/100g/min. At 18ml/100g/min, synaptic transmission failure occurs. These cells still have the potential for recovery. However, when CBF drops to 8ml/100g/min, membrane pump failure occurs and cell death results.
ISCHEMIC PENUMBRA:
7
DIAGNOSTIC AND THERAPEUTIC INTERVENTIONS OF
ACUTE STROKE
Stroke diagnosis, prevention and treatment have dramatically improved over the past several years. New imaging techniques, use of anticoagulants and antiplatelet drugs and surgical advances are all recent additions to the armamentarium for stroke treatment. However, therapeutic nihilism regarding stroke treatment persists and can delay early treatment. Only about 40% of patients present to the hospital within 24 hours of experiencing symptoms. This delay can be critical, given the need to administer thrombolytics within 3 to 6 hours after onset of symptoms - the” therapeutic window” to salvage the penumbra. Unfortunately, patients with milder symptoms who would benefit most are least likely to arrive in time for therapy. Therefore, education of both the public and professional is needed to reduce the time from symptom onset to hospital arrival 9.
DIAGNOSIS OF ISCHEMIC STROKE:
A. Diagnostic approaches to ischemic stroke include the use of sonographic characterization of carotid artery plaques. MRI with or without angiography can also characterize the plaque to identify “craters” increase the likelihood of embolization.
B. Transesophageal echocardiograhic findings can also be helpful for detecting potential cardiac sources of embolism in patients with clinical risks for cardioembolism of unexplained stroke.
8
I. MEDICAL MANAGEMENT
THROMBOLYTIC THERAPY:
With the development of thrombolytic therapy, cerebral ischemia is being termed “brain attack” to convey the same urgency to the situation as is evoked by the term “heart attack”.
A. Tissue plasminogen Activator: Tissue plasminogen activator (t-PA) has become the agent of choice for thrombolysis since the National Institute of Neurological Disorders and Stroke (NINDS). t-PA study group first published results in late 1995. Clinical outcome was improved in patients treated within 3 hours with t-PA despite an increased risk if intracranial hemorrhage.
B. Streptokinase: A second major trail used streptokinase as a thrombolytic agent in ischemic stroke (the Multicentre Acute Stroke Trail, MAST) but found excess mortality in the streptokinase – treated group.
C. Heparin: Heparin is used in patients with acute infarction in an effort to limit neurologic progression or to prevent recurrent embolism in cardio embolic stroke. Low molecular weight heparin has been shown to be effective in reducing the deficit in ischemic strokes.
9
Various drugs have been tried including calcium channel blockers, antagonists of N-methyI-D-asparate, sodium channel blockers and inhibitors of excitatory amino acids. Lubeluzole, a compound that prevents intracellular glutamate concentrations has shown promise in early trials and may be useful in combination with other drugs or as an agent.
D. Aspirin: Aspirin has been used to treat ischemic stroke, both as primary prevention in patient with transient ischemic attacks or high-grade carotid stenosis and as secondary prevention after stroke occurrence.
II. SURGICAL MANAGEMNT
A. Carotid endarterectomy
Treatment of stroke also includes the use of carotid endarterectomy for symptomatic stenosis with 70% to 99% obstruction of the vessel. Restenosis after successful carotid endarterectomy can occur.
B. Percutaneous transluminal carotid angioplasty:
Another invasive approach in treating ischemic stroke is the use of percutaneous transluminal carotid angioplasty.
Management of Hypertension:
10
CO-MORBIDITIES AND COMPLICATIONS
The following co-morbidities and complication are associated with stroke patients:
1. Coronary artery disease 2. Hypertension
3. Diabetes mellitus 4. Deep vein thrombosis 5. Dysphagia
6. Infection 7. Depression 8. Falls
9. Spasticity 10.Sleep apnea 11.Shoulder pain 12.Seizures
FACTORS THAT PREDICT MORTALITY AND DISABILITY AFTER STROKE
I. RISK FACTORS FOR ACUTE STROKE MORBIDITY
1. Stroke severity
2. Low level of consciousness 3. Diabetes mellitus
4. Cardiac disease
11
7. Delay in medical care
8. Elevated blood sugar in non-diabetic 9. Brainstem involvement
10. Hemorrhagic stroke
II. RISK FACTORS FOR DISABILITY AFTER STROKE
1. Severe stroke (minimal motor at 4 weeks) 2. Low level of consciousness
3. Diabetes mellitus 4. Cardiac disease
5. Electrocardiographic abnormalities 6. Old age
7. Delay in rehabilitation 8. Bilateral lesions
9. Previous functional disability 10. Poor sitting balance
11. Global aphasia 12. Severe neglect
13. Sensory and visual deficits 14. Impaired cognition
15. Incontinence (>1-2 weeks) 16. Depression
12
SCANDINAVIAN STROKE SCALE (SSS)
The neurological status of the stroke patient is assessed by the Scandinavian stroke scale. The Scandinavian stroke scale evaluates levels of consciousness, eye movements, power in the arm, hand and leg, orientation, aphasia, facial paresis and gait. The total score ranges from 0 to 58 points.
1. CONSCIOUSNESS:
Fully conscious - 6 Somnolent but can be aroused to full conscious - 4 Reacts to verbal command but not fully conscious - 2
2. EYE MOVEMENTS:
No gaze palsy - 4 Gaze palsy present - 2 Conjugate eye - 0
3. ARM MOTOR POWER:
Raises arm with normal strength - 6 Raises arm with reduced strength - 5 Raises arm with elbow in flexion - 4 Can move but not against gravity - 2 Paralysis - 0
4. HAND MOTOR POWER:
13
5.LEG MOTOR POWER:
Normal strength - 6
Raise straight leg with reduced strength - 5
Raised leg with flexion of knee - 4
Can move but not against gravity - 2
Paralysis - 0
6. ORIENTATION: Correct time, place and person - 6
2 of these - 4
1 of these - 2
Complete disorientation - 0
7. SPEECH: No aphasia - 10
Limited vocabulary or incoherent speech - 6
More than yes or no, but not longer sentences - 3
Only yes/no or less - 0
8. FACIAL PALSY: No facial palsy - 2
Facial palsy present - 0
9. GAIT: Walks 5 minutes without aids - 12
Walks with aids - 9
Walks with the help of another person - 6
Sits with support - 3
Bedridden / wheel chair bound - 0
SEVERITY OF NEUROLOGICAL LESION SSS SCORE STROKE GRADE
14
Thus the neurological status is assessed by Scandinavian stroke scale. The Scandinavian stroke scale has been found to be reliable and its validity has found support in high correlations with other stroke scales.12
FUNCTIONAL INDEPENDENCE MEASURE (FIM)
Early prediction of functional recovery remains a crucial factor in client oriented practice, discharge planning and utilization of rehabilitation resources.
Prediction of length of stay of stroke rehabilitation in-patient was developed based on patient’s age and functional admission. (scored on the FIM). FIM scores at admission are strong predictors of patient’s length of stay with the “Transfer items” having the greatest predictive power. 13
In FIM, there are six items like Self-care, Sphincter control, Transfers, Locomotion, Communication and Social cognition and seven levels like Total assist, Maximal assist, Moderate assist, Minimal assist, Supervision, Modified Independence and Complete Independence.
The FIM requires direct observation of patients to determine functional status. 14 FIM score is based on task performance. 14 Another feature of comprehensiveness of FIM is that it takes only 30minutes to complete. FIM does not lend itself to inconvenience. 14
In a study conducted by Oczkowski and Barreca, patients with admission FIM scores above 96 invariably went home, whereas patient with admission FIM scores less than 37 always requires institutionalization.
15 L E V E L S
7 Complete Independence (Timely, Safely) 6 Modified Independence (Device)
NO HELPER
Modified Dependence 5 Supervision
4 Minimal Assist (Subject = 75% +) 3 Moderate Assist ( Subject = 50%+) Complete Dependence
2 Maximal Assist ( Subject = 25%+) 1 Total Assist (Subject = 0%+)
HELPER
Self –Care ADMIT DISCHG FOL-UP
A. Eating B. Grooming
C. Bathing D. Dressing- Upper Body E. Dressing- Lower Body F. Toileting
Sphincter Control
G. Bladder Management H. Bowel Management
Transfers
I. Bed, Chair, Wheel Chair J. Toilet K. Tub, Shower
Locomotion
L. Walk /Wheelchair
M. Stairs
Motor Subtotal Score
Communication
16
Social Cognition
P. Social Interaction Q. Problem Solving
R. Memory
Cognitive Subtotal Score
Total FIM Note: Leave no blanks; enter 1 if patient not testable due to risk
THE SEVEN STAGES OF STROKE RECOVERY
DEFINITION
The six original Brunnstrom stages are expanded to seven and the definitions, which formerly included only the limbs now incorporate postural control also. The “Chedoke” seven stages of motor recovery are defined as follows:
STAGE 1
Flaccid paralysis is present. Phasic stretch reflexes are absent or hypoactive. Hypoactive tonic stretch reflexes are demonstrated by a decrease in the resistance to passive movement. Active movement cannot be elicited reflexly with a facilitory stimulus or volitionally.
STAGE 2
17
STAGE 3
Spasticity is marked. The primitive, synergistic movements’ patterns can be elicited voluntarily, but are obligatory. In most cases, flexion synergy dominates the arm, the extension synergy the leg.
STAGE 4
Spasticity decreases. Synergy patterns can be reversed if movement takes place in the weaker synergy first. Movements combining antagonistic synergies can be performed when the prime movers are the strong components of the synergy. Righting reactions develop, modify and partially integrate the spinal and brainstem reflexes.
STAGE 5
Spasticity wanes, but is evident with rapid movement and at the extremes of range. Synergy patterns can be reversed even if movement takes place in the strong synergy first. Movements with the weak components of both synergies acting as prime movers can be performed. Righting reactions have integrated the spinal and brainstem reflexes. Balance and equilibrium reactions are present and variety of functional movements is possible.
STAGE 6
Spasticity, as demonstrated by resistance to passive movements, is no longer present. Postures and movements are normal until rapid, complex actions are requested.
STAGE 7
18
The stages of stroke model provide a “Map with different routes” to effective outcomes, helping those within stroke rehabilitation to recognize,
where they are and where they are going.16
NATURAL SPONTANEOUS NEUROLOGICALRECOVERY
There are two different but related ways that patients improve after stroke. The first type of recovery, a reduction in the extent of neurological impairment can results from natural spontaneous neurological recovery from the effects of treatment that limit the extent of the stroke or from other interventions that enhance neurological functioning. This form of recovery presents as improvement in motor control, language ability or other primary neurological functions. 17
The second type of recovery demonstrated by stroke patients is the improved ability to perform daily functions in their environment, within the limitations of their physical impairments 18. The ability to perform these tasks can improve through adaptation and training in the presence or absence of natural neurological recovery. This is the element of recovery on which rehabilitation is thought to exert the greatest effect. Although most improvements in physical functioning occur within first 3-6 months, later recovery is also is commonly seen 19.
RECOVERY OF MOTOR FUNCTION:
19
This sequence of recovery can stop at any stage. Some hemiparetic patients ultimately regain full or nearly complete use of all muscles in an isolated, coordinated fashion, independent of synergy patterns. Others experience incomplete improvement with partial voluntary use of the recovering extremity and a few patients demonstrate minimal or no recovery in motor control.
MECHANISMS OF RECOVERY IN NEUROLOGICAL FUNCTION: Several mechanisms have been proposed to explain the clinically observed phenomenon of spontaneous recovery of neurological function20. These mechanisms generally can be divided into two broad categories. The first mechanism is resolution of local harmful factors, which usually accounts for early spontaneous improvement after stroke (usually within the first 3 to 6 months). These processes include resolution of local edema, resorption of local toxins, improved local circulation and recovery of partially damaged ischemic neurons.
20
FACTORS AFFECTING FUNCTIONAL OUTCOME AFTER STROKE
REVIEW OF REHABILITATION INTERVENTIONS
Review of medical literature shows that there is an association between rehabilitation interventions and outcomes after stroke. Outcome is defined as functional status, living situation, morbidity, mortality, costs, length of stay and quality life. In a critical review of Rehabilitation interventions by David & Deborah, the following rehabilitation interventions were evaluated for their relationship with functional outcome after stroke.
1. Functional deficits at rehabilitations admission 2. Timing of rehabilitation
3. Type of inpatient rehabilitation: interdisciplinary versus multidisciplinary.
4. Type of non-in patient rehabilitation : home health versus out patients versus day
5. Specificity of rehabilitation services 6. Intensity of rehabilitation services.
Outcome was defined as “Functional abilities at rehabilitation
discharge and at follow-up (typically 3 to 12 months)’’. These studies
examined functional outcome with Barthel Index, Kennedy ADL scale and Functional Independence Measure.
RESULTS:
1. FUNCTIONAL DEFICITS AT REHABILITATION ADMISSION:
21
Overall, the available literature demonstrates that decrease functional abilities in the first 1– 4 weeks after stroke are strongly associated with decreased discharge to home rates and decreased functional outcome at both rehabilitation discharge and up to 6 months of follow up. 22
2. TIMING OF REHABILITATION:
The association of the timing of rehabilitation interventions typically defined as either multidisciplinary therapy or interdisciplinary rehabilitation services and outcome after stroke has been examined in 15 studies.
Overall, the available literature demonstrates that early rehabilitation interventions – within 3 to 30 days post stroke – are strongly associated with improved functional outcome. 23
3. TYPE OF INPATIENT REHABILITATION:
INTERDICIPINARY VERSUS MULTIDISCIPLINARY
An interdisciplinary setting is defined as “one in which rehabilitation services are provided by diverse professionals who constitute a team that communicates regularly and used its varying expertise to work toward common goals”.
Multidisciplinary settings usually included similar professional but regular communication and common goal orientation were less consistent. Overall, the available literature demonstrates that interdisciplinary rehabilitation following stroke is strongly associated with improved functional out come, shorter length of day, decreased costs and decreased mortality. 24
4. TYPE OF NON–IN-PATIENT REHABILITATION:
HOME HEALTHVERSUSOUTPATIENTVERSUS DAY
22
after stroke has been examined in seven studies. Overall, the available literature demonstrates that participation in out-patient, home health and day rehabilitation programs is strongly associated with improved functional outcome after stroke. 25
5. SPECIFICITY OF REHABILITATION SERVICES:
The association between the specificity of rehabilitation services, in particular the types of physical, occupational, speech and psychology therapy and functional outcome following stroke has been examined in eight studies.
Richards and associates randomized 27 acute stroke survivors to one or three treatment groups:
1. Intensive, early onset, task specific physical therapy 2. Intensive, early onset, generalized physical therapy or 3. Standard physical therapy
They showed that the intensive, early onset, task specific physical therapy demonstrated the greatest degree of gait recovery at 3 months. Overall, the available literature demonstrates that the task specific therapy services versus more generalized therapy are weakly associated with improved functional outcome after stroke. 26
6. INTENSITY OF REHABILITATION SERVICES:
23
STROKE REHABILITATION
TRADITIONAL THERAPEUTIC APPROACHES
Current stroke rehabilitation practice throughout the world is based on a number of approaches that were developed independently by several pioneers in the 1950s.
Prior to the 1950s, the physical treatment of patients following stroke focused on encouraging the patients to use the unaffected side of the body to compensate for the disabilities of the affected side. The affected limbs were not a prime focus for treatment.
During the 1950s a number of new physiotherapy approaches emerged. The work of many of these pioneers e.g. Bobath (1969), Brunnstrom (1961, 1970) Knott & Voss (1968s) and Rood (1969) remains influential today. They developed their programs primarily from observation and experience.
I. NEURO PHYSIOLOGICAL APPROACHES:
1. BOBATH NEURO DEVELOPMENTAL APPROACH:
This approach is based on the assumption that increase tone and increased reflex activity will emerge as a result of lack of inhibition from a damaged postural reflex mechanism and that movement will be abnormal if it stems from a background of abnormal tone (Bobath 1990). A further assumption is that performing abnormal movements will reinforce more abnormal movements.
2. BRUNNSTROM:
24
II. PROPRIOCEPTIVE EUROMUSCULARFACILITATION TECHNIQUE (PNF)
1. KNOT AND VOSS:
This approach is based on the assumption that people who move normally have passed through a developmental sequence and that after damage it is necessary to return to that developmental sequence before recovery will take place. It also assumes that maximal peripheral stimulation is required to recruit motor response. The use of total patterns of movement is believed to be a way of encouraging and reinforcing movement. This belief is based on the fact that the cortex is thought to control movements in patterns and not as singular muscular actions.
2. ROOD:
This approach is based on the assumption that postural stability and movement patterns are similar in all individuals and follow a developmental sequence. A return to this development frame work of motor sequence is fundamental to these motor responses. She suggests links between motor responses and somatosensory, autonomic and psychological functions. Therefore the relationship between sensory factors and motor functions assumes a major role.
3. JOHNSTONE:
25
4. MOTOR RELEARNING PROGRAMME: (Carr and Shepherd 1987)
This model is based on the assumption that the impaired learn in the same way as the unimpaired as the principles that they follow stem from work that has focused primarily on the learning responses of normal subjects. The program is based on four factors thought to be essential for motor relearning. They are
- elimination of unnecessary muscle activity, - feedback,
- practice and
- the link between postural adjustment and movement.
Thus several different physiotherapy approaches are used in the management of patients who have suffered a stroke but these approaches are not mutually exclusive and are rarely delivered in a uniform or purist manner. All of the approaches aim to improve motor control and all of them demand that the therapist has a specialist training in the individual concepts.
In this study “Intense sensory motor stimulation” in the form of oil massage, re-education exercise program and electrical stimulation are instituted to augment motor recovery in stroke patients.
I. ROLE OF OIL MASSAGE IN STROKE REHABILIATTION
TECHNIQUE:
26
Once the proximal extent is reached the hands can be drawn back to the distal position applying light contact or no contact at all.
THERAPEUTIC USES:
In stroke rehabilitation, effleurage technique is effective
1) in assisting return of venous or lymphatic drainage in the paretic limb. 2) in increasing local circulation.
3) in increasing the stretchability of skin and flexibility of muscles. 28
2. ROLE OF “ROM EXERCISES” IN STROKE MANAGEMENT
A. PASSIVE ROM
In stroke rehabilitation program, PROM exercises are instituted a. to maintain joint and soft tissue integrity
b. to minimize the effects of the formation of contractures c. to maintain mechanical elasticity of muscle
d. to assist circulation and vascular dynamics
e. to enhance synovial movement for cartilage nutrition and diffusion of materials in the joint
f. to decrease or inhibit pain
g. to help maintain the patient’s awareness of movement. 29
B. ACTIVE AND ACTIVE ASSISTIVE ROM
In stroke rehabilitation program, AROM and Active assistive ROM exercises are instituted to
27
b. to maintain physiologic elasticity and contractility of the participating muscle.
c. to provide sensory feedback from the contracting muscles d. to provide a stimulus for bone and joint tissue integrity e. to increase circulation and prevent thrombus formation
f. to develop coordination and motor skills for functional activities
g. to provide enough assistance to the muscles in a carefully controlled manner so that the muscle can function at its maximum level and progressively be strengthened.
3. ROLE OF ELECTRICAL STIMULATION IN MOTOR
RECOVERY
HISTORY:
More than 30years ago, Liberson and colleagues introduced single channel electrical stimulation in stroke patients to prevent foot drop 30 . The technique is now generally known as FES because stimulation replaces or assists functional movements that are lost after injury to or disease of the CNS.
ELECTRICAL STIMULATION:
28
PULSE:
Current is passed to the body tissues by means of wet pads, sponges or a bath of suitable solution. Thus the conduction current generated in the apparatus is changed to a convection current in a wet pads and tissue. The unit of stimulation current is called as a Pulse. This will cause one nerve impulse. If a 1 ms pulse is repeated every 10ms, they will cause a steady tingling sensation as they stimulate sensory nerve and a titanic muscle contraction as they stimulate motor nerves. Such current at higher intensities are used for muscle stimulation and are known as Faradic Stimulation.
The pulse rate can be expressed in Pulses/ Second (PPS) or the pulse frequency in hertz (HZ). In the Health care professions, electrical stimulation is used for 3 purposes;
a. to aid diagnosis
b. as a therapeutic tool and
c. to restore lost or damaged functions. 33
Faradic type pulses:
Faradic type pulses are pulses of 0.1 - 1ms duration with repetition rates of 30 - 100HZ. The effective nerve stimulus is the spike of voltage, which can be about 1 ms in duration; the rest of the pulse having much lower does not cause nerve stimulation.
MECHANISM OF NERVE STIMULATION:
29
For stimulating motor and sensory nerve i.e., large diameter fast conducting nerves, the pulse should be square wave and of short duration (0.5-1ms). Evenly alternating pulses have the advantage of avoiding any risk of chemical damage. Frequencies of around 80-100 HZ seem to be the best.34
MOTOR POINT:
In order to stimulate a normally innervated muscle effectively but painlessly the active electrode is applied to the motor point. This is a point on the skin surface at which maximum muscle contraction can be achieved because it is close to the point where the motor nerve trunk enters the muscle.
THE MOTOR UNIT:
The motor unit consists of an anterior born cell, the alpha motor neuron emanating from it and all the individual muscle fibres it supplies.
ELECTRICAL STIMULATION OF INNERVATED MUSCLE
30
The flow of impulses in the motor nerve serves both to provoke immediate muscle contraction and in the long term to promote muscle fiber growth and change.
ROLE OF ELECTRICAL STIMULATION IN THE MOTOR
RECOVERY AFTER STROKE
Electrical stimulation has been sporadically used in the treatment of hemiplegia. Reported benefits included decreasing spasticity, providing a supplementary means of Range of Movement (ROM) exercises, increasing strength and improving local blood flow in a paretic or paralyzed limb. There are also functional gains in the hemiplegic upper limb following treatment with electrical stimulation.35 Electrical stimulation may facilitate motor recovery after stroke, reduce shoulder pain associated with hemiplegia and reduce cerebral spasticity 36 Electrical stimulation combined with voluntary activity led to similar or in a few cases even greater strength gains than that due to voluntary exercise alone.
Electrical stimulation has very favorable results that have been repeatedly presented 37. Sonode and co-worker showed that the use of electrical stimulation could be a valuable complement to the normal training of the arm of hemiplegic patients in increasing motor functions significantly 38. Even modest improvement in ability may significantly enhance the quality of
life39 . After electrical stimulation, there will be improvement of functions. Apart from muscle strengthening, the electrical stimulation effect led to an improvement of proprioception and supported relearning of motions. 40
31
in hemiplegic patients (Baker and parker, 1986) especially for the patient with shoulder pain and for the reduction of shoulder subluxation. 41
Electrical stimulation has been applied as an alternative to manual passive movement to help prevent the loss of motion due to spasticity of the opposing muscles. This has been used successfully on the wrist and in finger movements of hemiplegic patients. The restoration of shoulder motion in plegic patients was successful by electrical stimulation 42
Electrical stimulation is extensively used therapeutically to initiate and facilitate voluntary contraction of muscles in stroke patients.
ELECTRICAL STIMULATION FOR THE REDUCTION OF SPASTICITY
The effects of electrical muscle stimulation on spasticity are variable. In general, there have been three approaches. First, stimulation of antagonists to utilize the effect of reciprocal inhibition. Secondly, stimulation of the spastic muscle themselves and thirdly, alternately stimulating agonist and antagonist muscles. This latter approach has been tried using low frequency (3-35 HZ) 0.2ms pulses for some minutes daily over several weeks. The pulse frequencies are based on eutrophic stimulation and on the principle that afferent stimulation reinforces the presynaptic inhibition of motor neurons, thus reducing spasticity. After applying electrical stimulation, a statistically significant improvement was noted in all muscle tone / spasticity parameters in a clinical study.
MUSCLE FATIGUE AFTER ELECTRICAL STIMULATON
32
The choice of stimulation frequency is an important factor in reducing muscle fatigue. Although higher frequency stimulation generates stronger muscle contraction, muscle fatigue soon appears44.
Benton and colleagues reported that rapid muscle fatigue occurs during continuous stimulation at frequencies higher than 30 to 40 HZ. Handa and colleagues 45 reported that a frequency of about 20 HZ would be recommended in clinical electrical stimulation. Based on these results, low frequency stimulation has been used in patients for continuous stimulation. Physiologically muscle fatigue has been sub grouped in to 2 types according to their physiological mechanisms;
Low frequency fatigue at 5 to 30 HZ and High frequency fatigue at 50 to 100HZ. 46
1. Low frequency fatigue – induced by low frequency stimulation and characterized by a subsequent long term loss of force.
2. High frequency fatigue - induced by high frequency stimulation and characterized by a subsequent rapidly recovering loss of force.
The mechanism of low frequency fatigue is thought to be an impaired excitation-contraction coupling so that less force is generated for each individual membrane excitation. 47
33
TECHNIQUE OF APPLICATION
The patient is positioned so that the part to be treated is comfortably supported with muscles to be stimulated in a shortened position, although this may be modified when movement is to be produced, e.g. slight knee flexion allowing quadriceps stimulation to cause extension.
The skin surfaces to which the current will be applied must be examined and any cuts, abrasions or other lesions that might cause uneven current distribution is insulated (with a dab of petroleum jelly) or avoided. These areas should be washed to remove sebum and epithelial cells and left damp; using hot water warms the skin and helps to lower resistance further. The pads or sponges should be soaked in warm tap water, saline or sodium bicarbonate solution, which are somewhat better conductors particularly in soft water areas applied to the skin. Fixation is achieved with a rubber strap, a crepe or similar bandage or simply by body weight.
The nature of the treatment and the sensation to be expected, a tingling sensation and muscle contraction should be explained to the patient with reassurance that there is no way that any damage can be caused by this treatment.
PRECAUTIONS
The major resistance to current flow is the skin so that any break in the skin provides a low resistance pathway and therefore a high local current intensity may be painful.
34
gradually over a few minutes, subjects become accustomed or accommodate to the electrical stimulation, so that the higher intensities are easily tolerated.
35
MATERIALS AND METHODS
BACKGROUND AND PURPOSE:
Review of literature shows that there will be natural, spontaneous neurological recovery after stroke. The mechanism to explain recovery is
Neuroplasticity. Brain plasticity is the ability of the nervous system to modify its structural and functional organization. The most plausible forms of plasticity are collateral sprouting of new synaptic connections and unmasking of previously latent functional pathways.
Experimental evidence indicates that plasticity can be altered by several external conditions, including pharmacological agents, electrical stimulation and environmental stimulation. Many different electrical stimulation applications have been explored since the pioneering work of Liberson et al on foot drop.
So in this study electrical stimulation is used to augment motor recovery in patients being rehabilitated after acute stroke, in addition to olive oil massage and reeducation exercise programme.
METHODS:
In this study, 20 hemiplegics admitted to PSG Hospitals, affiliated to the PSG Institute of Medical Sciences & Research, Coimbatore between March 2011 and 31st May 2011 were selected. No specific selection criteria with reference to age, severity of paralysis, aphasia, neglect, incontinence and cognitive function were applied. But stroke cases of longer duration were not included in this study. On admission to the rehabilitation facility, age and gender were documented for each patient as were the type and site of the cerebral lesion. Duration between stroke onset and rehabilitation admission were also recorded.
36
After thorough neurological examination, CT Brain was done to confirm the diagnosis. Then the neurological status was assessed by Scandinavian Stroke Scale and functional status was assessed by Functional Independence Measure. Then the treatment programme started.
ELECTRICAL STIMULATION
Electrical stimulation parameters:
Pulse width : 300ms Intensity : 100v Frequency : 50 Hz Duty cycles:
On time: 5 sec
Off time: 10 sec
THE MUSCLES STIMULATED IN THE UPPER LIMB:
Deltoid, Supraspinatous, Biceps, Triceps, Common flexors of forearm, Common extensors of forearm and the Intrinsic muscles of hand.
THE MUSCLES STIMULATED IN THE LOWER LIMB:
Gluteus maximus, Quadriceps, Tibialis anterior
37
pattern was taught. ADL training to the upper limb and gait training to the lower limb were taught.
OUTCOME MEASURES:
Outcomes were assessed in every two weeks.
The neurological recovery was assessed by Scandinavian stroke scale. The functional recovery was assessed by Functional independence measure.
FOLLOW UP:
The patients were followed up till June 15th 2011; in the follow-up it was found that most patients were able to maintain their functions and make further improvements. Also their physiological well-being seemed quite good.
38
STATISTICAL ANALYSIS & DISCUSSION
HYPOTHESIS- I
I. There will be significant level of neurological recovery in the treated group of stoke patients during the time of discharge and in the follow-up period, when compared to their neurological status at the time of admission.
Ia. There will be significant level of neurological recovery in the stroke patients during the time of discharge when compared to their neurological status at the time of admission.
Ib. There will be significant level of neurological recovery in the stroke patients during the time of follow-up when compared to their neurological status at the time of admission.
HYPOTHESIS- II
II. There will be significant increase in the functional independence level of the stroke patients during the time of discharge and the follow-up, when compared to the functional independence level at the time of admission.
IIa. There will be significant increase in the functional independence of the patients at the time of discharge when compared to their functional independence level at the time of admission.
39
STATISTICAL ANALYSIS
DISCUSSION:-
To analyze a data, two types of statistical techniques are used. They are,
a) Descriptive statistical technique and b) Inferential statistical technique.
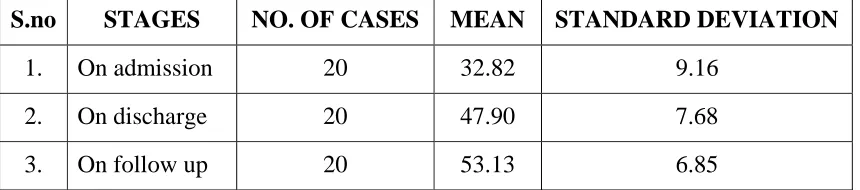
[image:45.612.110.540.384.479.2]In the descriptive statistics, Mean and Standard deviation are calculated for the scores and tabulated as follows:-
Table No: 1
Shows Mean, Standard Deviation of Scandinavian stroke scale scores of stroke patients at different stages
S.no STAGES NO. OF CASES MEAN STANDARD DEVIATION
1. On admission 20 32.82 9.16 2. On discharge 20 47.90 7.68 3. On follow up 20 53.13 6.85
The above table shows the mean score of Scandinavian stroke scale (SSS) on discharge and follows up. The standard deviation also seems to be within the normal limits. It does not skewed very much. So this distribution can be said as normal distribution.
40
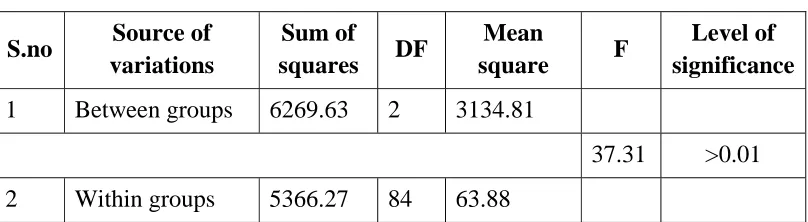
Table No: 2
Shows “ANOVA of Scandinavian stroke scale scores of different groups of stroke patients”
S.no Source of variations
Sum of
squares DF
Mean
square F
Level of significance
1 Between groups 6269.63 2 3134.81
37.31 >0.01 2 Within groups 5366.27 84 63.88
The F ratio 37.31 was found to be significant at 0.01 level indicates that stroke level of different stages is significantly different from one another. The hypothesis I has been proved by this statistical finding.
To analyze further which group is different from another group, ‘student‘t’ test’ was used.
Table No: 3
Shows Mean, Standard deviation and‘t’ value of Scandinavian stroke scale scores on admission and discharge
S.no Group No. of
cases Mean
Standard
deviation T P
1 On admission 20 32.82 9.16
6.79 >0.01 2 On discharge 20 47.90 7.68
[image:46.612.124.527.474.568.2]41
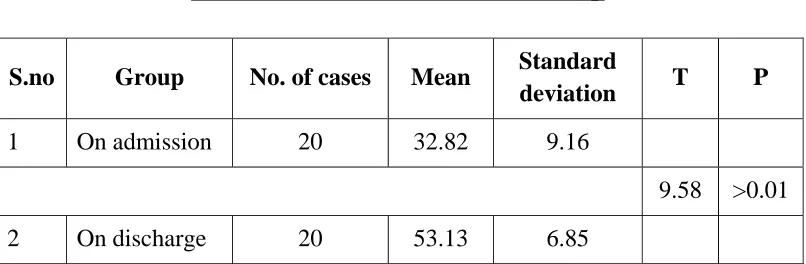
[image:47.612.124.527.177.309.2]To analyze the mean score of admission and follow up, again the‘t’ test was calculated as follows.
Table No: 4
Shows Mean, Standard deviation and ‘t’ value of Scandinavian stroke scale scores on admission and follow-up
S.no Group No. of cases Mean Standard
deviation T P
1 On admission 20 32.82 9.16
9.58 >0.01 2 On discharge 20 53.13 6.85
The above ‘t’ value of 9.58 which is significant at 0.01 level, indicates that the mean score of follow up was significantly different from mean score of admission level. This finding proves the hypothesis Ib.
DISCUSSION:
The above results indicate that the condition of the stroke patients has significantly improved at the time of discharge and follow up when compared to the time of admission. It is possible to say that the different forms of
“intense sensory motor stimulation” would have contributed much for the
42
Table No: 5
Shows Mean Standard deviation of functional independence measure scores of stroke patients at various stages
S.no Group No. of cases Mean Standard deviation
1. On admission 20 75.79 19.22 2. On discharge 20 105.17 12.75 3. On discharge 20 115.35 12.00
The above table reveals that the mean and standard deviation of functional independence scorers of stroke patients. The mean score of functional independence levels of the patients during admission, is very low than the mean score of functional independence at the time of discharge and follow up. Similarly the measure of standard deviation indicates that there is not much deviation in the distribution.
To analyze further and to find out the significant differences between the means, the “analysis of variant” (ANOVA) was worked out. The results are as follows:
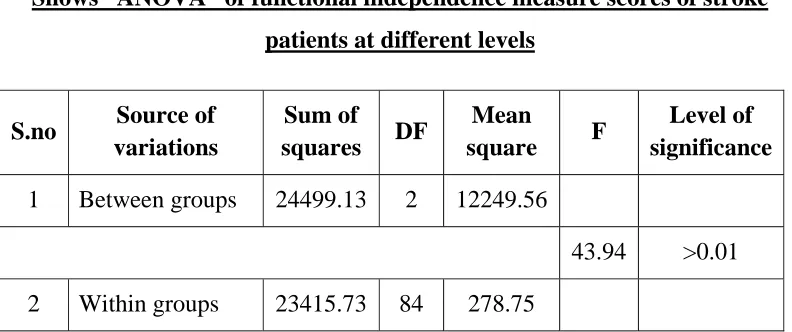
Table No: 6
Shows “ANOVA” of functional independence measure scores of stroke patients at different levels
S.no Source of variations
Sum of
squares DF
Mean
square F
Level of significance
1 Between groups 24499.13 2 12249.56
[image:48.612.123.519.508.674.2]43
The F ratio of the above table 43.94 which is significant at 0.01 level reveals that, there is significant difference in the functional independence levels among the three groups. This result proved the hypothesis II.
[image:49.612.123.525.267.403.2]To analyze further which group is differently from another group, the “student‘t’ test” was used. The results are tabulated as follows:
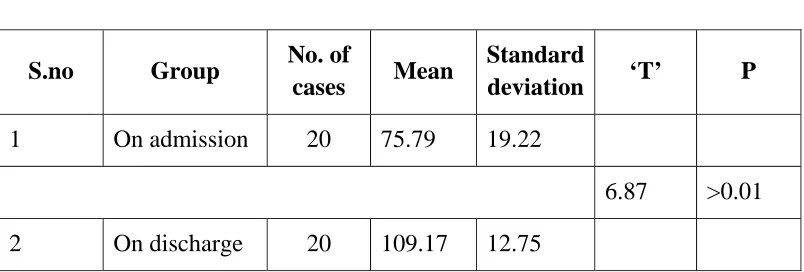
Table No: 7
Shows Mean, Standard deviation and “t” value of functional independence measure scores on admission and discharge
S.no Group No. of
cases Mean
Standard
deviation ‘T’ P
1 On admission 20 75.79 19.22
6.87 >0.01
2 On discharge 20 109.17 12.75 The above‘t’ value 6.87 which is significant at 0.01 level, indicates that the functional independence level of the patients have significantly improved when compared to the functional independence levels of the patients during admission. These findings prove the hypothesis IIa.
44
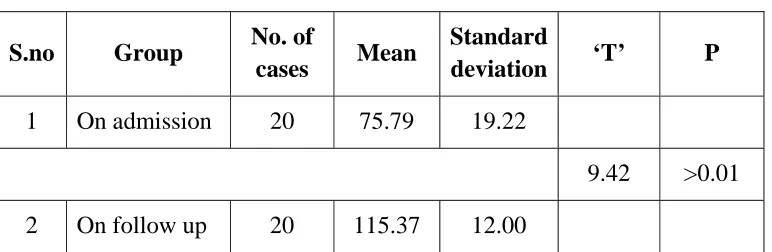
Table No: 8
Shows Mean, Standard deviation and “t” value of functional independence measure scores on admission and follow up
S.no Group No. of
cases Mean
Standard
deviation ‘T’ P
1 On admission 20 75.79 19.22
9.42 >0.01 2 On follow up 20 115.37 12.00
The‘t’ value 9.42 which is significantly at 0.01 levels indicate that, the functional independence level of the patients during follow up is significantly more when compared to the functional independence level at the time of admission. This result proves the hypothesis IIb
.DISCUSSION
The above findings prove that the functional independence of the stroke patients have improved very much at time of discharge and follow up.
45
level of functional independency at the time of admission, at the time of discharge and at the time of follow-up.
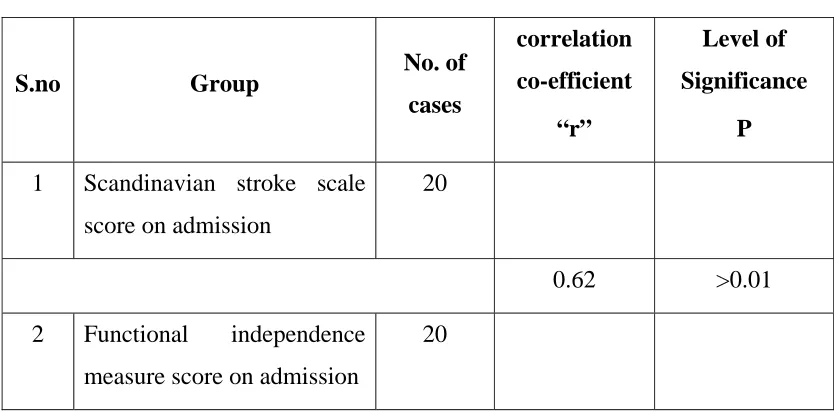
[image:51.612.114.531.252.459.2]To find out the relationship between these two levels, the ‘Correlation Coefficient Techniques’ has been used. The results are given below:
Table No: 9
Shows the correlation between and Scandinavian stroke scale scores on admission and functional independence measure score on admission
S.no Group No. of cases
correlation co-efficient
“r”
Level of Significance
P
1 Scandinavian stroke scale score on admission
20
0.62 >0.01 2 Functional independence
measure score on admission
20
46
Table No: 10
Shows the correlation between and Scandinavian stroke scale scores on admission and functional independence measure score on discharge
S.no Group No. of cases
correlation co-efficient
“r”
Level of Significance
P
1 Scandinavian stroke scale
score on discharge 20
0.81 >0.01 2 Functional independence
measure score on discharge 20
The above table showing the correlation coefficient value of 0.81 which is significant at 0.01 levels indicates that the high level of relation between the recovery of stroke at time of discharge and functional independence level at the time of discharge.
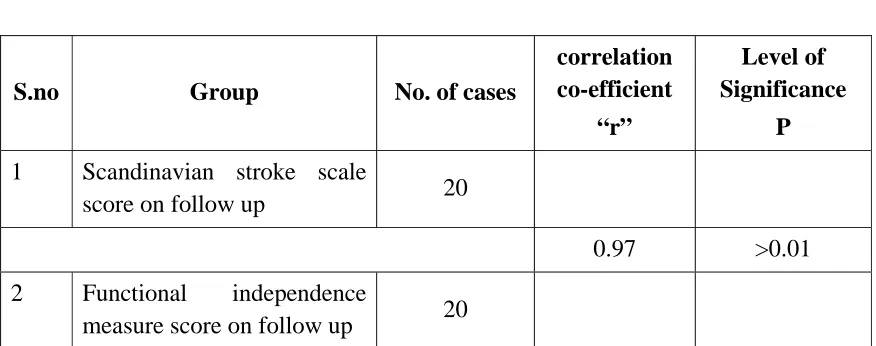
Table No: 11
Shows the correlation between and Scandinavian stroke scale scores on admission and functional independence measure score on follow up
S.no Group No. of cases
correlation co-efficient
“r”
Level of Significance
P
1 Scandinavian stroke scale
score on follow up 20
0.97 >0.01 2 Functional independence
[image:52.612.105.543.486.659.2]47
The correlation value 0.97 which is significant at 0.01 levels shows the high level of relation between the recovery of stroke and functional independent level.
The above correlation coefficient value suggests that, when the severity of stroke level increases, the functional independence level significantly decreases. Whereas, when there is improvement of the stroke state, the functional independence level will also increase significantly.
It was decided to analyze further, the magnitude of stroke, the neurological recovery and the functional independency in different possible parameters like duration of treatment, time lag before admission, pathology of stroke, topography of the brain affected and vascular territory of different cerebral arteries affected.
Since the total number of cases in certain conditions is found to be less, the researchers could not use any parametric tests and confirmed only with the non parametric tests to analyze the data.
The percentage was calculated for each condition and the same was discussed.
Table No: 12
Shows the rate of neurological recovery (Scandinavian stroke scale score) of stroke patients who have undergone treatment for different duration.
S. no Duration of Treatment
Neurological Recovery (SSS Score)
On admission On discharge On follow up
48
It is learnt from the above table that the stroke cases with severe neurological damage (less Scandinavian stroke scale score) on admission required longer duration of treatment.
Table No: 13
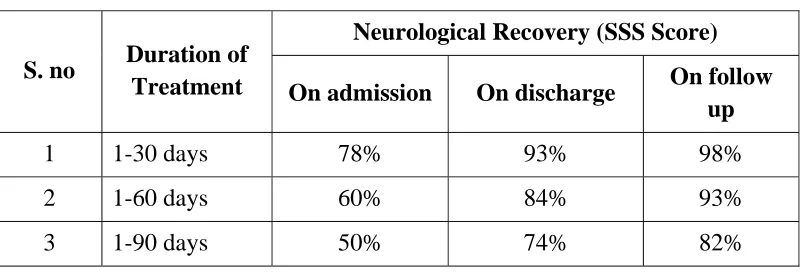
Shows the rate of functional recovery (FIM score) of stroke patients who have undergone treatment for different duration.
S. no Duration of Treatment
Neurological Recovery (SSS Score)
On admission On discharge On follow up
[image:54.612.124.527.223.359.2]1 1-30 days 78% 93% 98% 2 1-60 days 60% 84% 93% 3 1-90 days 50% 74% 82% From the above table, it is clear that the stroke cases with severe functional impairments (less FIM score) on admission required longer duration of treatment.
Table No: 14
Shows the rate of neurological recovery of stroke cases admitted for different time lag period
S. no Time lag Neurological Recovery (SSS Score)
On admission On discharge On follow up
49
[image:55.612.124.525.225.343.2]The above table shows the neurological recovery (percentage of SSS score) is maximum at discharge and follows up in the group of stroke cases which were admitted for treatment with short time lag.
Table No: 15
Shows the rate of functional recovery of stroke cases admitted for different time lag period
S. no Time lag Functional Recovery (FIM Score)
On admission On discharge On follow up
1 1-30 days 59% 85% 93% 2 1-60 days 65% 80% 89% 3 1-90 days 52% 77% 85% The above table shows the functional recovery (percentage of FIM score) on discharge and follow up is maximum in the group of stroke cases which were admitted early for treatment (short time lag).
Table No: 16
Shows the rate of neurological recovery (SSS Scores) in different pathological groups
S. no Pathology
Neurological Recovery (SSS Score)
On admission On discharge On follow up
[image:55.612.125.525.509.641.2]50
Table No: 17
Shows the rate of functional recovery (FIM Scores) in different pathological groups
S. no Pathology
Functional Recovery (FIM Score)
On admission On discharge On follow up
[image:56.612.123.528.154.290.2]1 Embolism 64% 80% 96% 2 Hemorrhagic 45% 68% 68% 3 Thrombotic 60% 84% 92% From the above two tables (16 & 17), the inference drawn is that neurological and functional recovery on discharge and follow up are greater in the embolic and thrombotic stroke cases; whereas neurological and functional recovery on discharge and follow up are less in hemorrhagic stroke cases.
Table No: 18
Shows the rate of neurological recovery (SSS Scores) in different levels of brain (Topograph)
S. no Topograph
Neurological Recovery (SSS Score)
On admission On discharge On follow up
51
Table No: 19
Shows the rate of functional recovery (FIM Scores) in different levels of brain (Topograph)
S. no Topograph
Functional Recovery (FIM Score)
On admission On discharge On follow up
1 Cortical level 60% 85% 93% 2 Internal Capsular Level 40% 78% 86% 3 Brainstem level 72% 92% 99% From the above two tables (18 & 19), it is learnt that neurological and functional recovery on discharge and follow up are fair if the stroke is at the level of the internal capsule. The neurological and functional recovery on discharge and follow up are better if the stroke is at the levels of cortex or brainstem.
Table No: 20
Shows the rate of neurological recovery (SSS Scores) of stroke cases at various cerebral artery territory levels
S. no
Territory of cerebral
artery involved
Neurological Recovery
On admission On discharge On follow up
[image:57.612.124.527.491.655.2]52
Table No: 21
Shows the rate of functional recovery (FIM Scores) of stroke cases at various cerebral artery territory levels
S. no
Territory of cerebral artery
involved
Functional Recovery (FIM Score)
On admission On discharge On follow up
1 ACA* - - - 2 PCA* - - - 3 Basilar artery 72% 92% 99% 4 MCA 52% 83% 98% *: No cases at these levels of study.
It is clear from the two tables (20 & 21) that the rate of neurological and functional recovery on discharge and follow up are better in stroke cases due to basilar artery territory involvement than middle cerebral artery territory involvement.
Table No: 22
Shows the rate of motor recovery in the extremities (SSS Scores) of stroke patients who have undergone treatment for different duration
Duration of treatment
Motor Recovery (SSS Score)
On admission On discharge On follow up
1-30 days UL LL
0% 75% 92% 83% 97% 100% 1-60 days UL
LL
24% 70% 87% 42% 77% 93% 1-90 days UL
LL
[image:58.612.111.524.514.672.2]53
Table No: 23
Shows the rate of motor recovery in the extremities (FIM Scores) of stroke patients who have undergone treatment for different duration.
Duration of treatment
Motor Recovery (FIM Score)
On admission On discharge On follow up
1-30 days UL LL
61% 80% 93% 86% 100% 100% 1-60 days UL
LL
40% 75% 90% 37% 76% 92% 1-90 days UL
LL
29% 43% 73% 23% 60% 72% From the above tables it is learnt that the neurological and functional
motor recovery in both extremities on discharge and follow up are maximum in stroke cases whose admission Scandinavian stroke scale scores and functional independence measure scores were high in both limbs. The stroke cases which have low Scandinavian stroke scale scores and low functional independence measure scores on admission required longer duration of treatment.
Table No: 24
Shows the rate of motor recovery (SSS Scores) in the extremities of stroke cases admitted for treatment in different time lag period
Time lag Motor Recovery (SSS Score)
On admission On discharge On follow up
0-30 days UL LL
24% 74% 88% 40% 79% 95% 31-60 days UL
LL
9.5% 51% 64% 50% 68% 80% 61-90 days UL
LL
[image:59.612.101.526.543.723.2]54
Table No: 25
Shows the rate of motor recovery (FIM Scores) in the extremities of stroke cases admitted for treatment in different time lag period
Time lag Motor Recovery (FIM Score)
On admission On discharge On follow up
0-30 days UL LL
42% 76% 92% 37% 77% 89% 31-60 days UL
LL
48% 68% 81% 47% 72% 84% 61-90 days UL
LL
27% 62% 73% 30% 32% 84% The findings from the above tables (24 & 25) prove that neurological
and functional motor recovery in both extremities on discharge and follow up are more in stroke groups which were admitted early for rehabilitation (short time lag).
Table No: 26
Shows the rate of motor recovery in the extremities (SSS Scores) in different pathological groups
S.no Duration of treatment Motor Recovery (SSS Score)
On admission On discharge On follow up
1 Embolism UL LL
0% 66% 75% 0% 72% 94% 2 Hemorrhage UL
LL
0% 0% 0% 16% 16% 27% 3 Thrombosis UL
LL
[image:60.612.104.538.525.703.2]55
Table No: 27
Shows the rate of motor recovery in the extremities (FIM Scores) in different pathological groups
S.no Duration of treatment Motor Recovery (SSS Score)
On admission On discharge On follow up
1 Embolism UL LL
64% 94% 100% 14% 57% 85% 2 Hemorrhage UL
LL
35% 42% 43% 28% 68% 68% 3 Thrombosis UL
LL
41% 73% 87% 39% 79% 91% It is clear from the above tables (26 & 27) that the neurological and
functional motor recovery in both extremities on discharge and follow up are better in stroke groups due to embolism and thrombosis; recovery is less in hemorrhagic pathology.
Table No: 28
Shows the rate of motor recovery (SSS Scores) in the extremities in cases of stroke at different levels of brain (Topograph)
S.no Topograph Motor Recovery (SSS Score)
On admission On discharge On follow up
1 cortical level UL LL
21% 67% 90% 44% 82% 97% 2 Internal capsular UL
level LL
7% 56% 73% 41% 62% 79% 3 Brainstem level UL
LL
[image:61.612.114.531.523.703.2]56
Table No: 29
Shows the rate of motor recovery (FIM Scores) in the extremities in cases of stroke at different levels of brain (Topograph)
S.no Topograph Motor Recovery (FIM Score)
On admission On discharge On follow up
1 cortical level UL LL
40% 75% 99% 40% 75% 88% 2 Internal capsular UL
level LL
40% 63% 77% 32% 71% 83% 3 Brainstem level UL
LL
71% 100% 100% 45% 71% 97% The above tables (28 & 29) prove that neurological and functional
motor recovery in the extremities on discharge and follow up are better if the stroke occurs at cortical or brain stem level. Motor recovery is fair if stroke occurs at internal capsular level.
Table No: 30
Shows the rate of motor recovery (SSS Scores) in the extremities of stroke cases at various cerebral artery territory levels
S. no
Territory of cerebral artery
involved
Motor Recovery (SSS Score)
On admission On discharge On follow up
1 ACA* - - - 2 PCA* - - - 3 Basilar UL artery
LL
50% 75% 100% 28% 72% 100% 4 MCA UL
LL
[image:62.612.111.542.524.717.2]57
Table No: 31
Shows the rate of motor recovery (FIM Scores) in the extremities of stroke cases at various cerebral artery territory levels
S. no Territory of cerebral artery
involved
Motor Recovery (FIM Score)
On admission On discharge On follow up
1 ACA* - - - 2 PCA* - - - 3 Basilar UL artery
LL
71% 100% 100% 46% 72% 97% 4 MCA UL
LL
43% 76% 86% 38% 75% 92% *: No cases at these levels of study.
From the above tables (30 & 31) it is learnt that neurological and functional motor recovery on discharge and follow up are better if the basilar artery territory is involved. Motor recovery is fair in the cases of middle cerebral artery involvement.
Table No: 32
Shows the distribution of Scandinavian stroke scale scores at different stages of stroke
S.no SSS Score grade No. of cases on admission
No. of cases on discharge
No. of cases on follow up
[image:63.612.113.537.560.688.2]58
[image:64.612.102.521.286.419.2]The above distribution table proves the beneficial effects of the “intense sensory motor stimulation” in augmenting the stroke recovery. At the time of admission, only three cases were in the mild grade (45-48) of Scandinavian stroke scale score. But at time of discharge and follow up 17 cases have moved to mild grades of Scandinavian stroke scale. This shows the magnitude of neurological recovery with intense sensory motor stimulation.
Table No: 33
Shows the distribution of Functional independence measure scores at different stages of stroke
S.no FIM Score grade No. of cases on admission
No. of cases on discharge
No. of cases on follow up
1 <50 3 0 0 2 50-75 6 1 0 3 75-100 9 3 3 4 >100 2 16 17
59
CONCLUSION
The following conclusions are drawn from the above study:
There was a significant level of neurological and functional recovery in the study group during the time of discharge and in the follow up period, when compared to their neurological and functional status at the time of admission. This shows the effectiveness of intensive sensory motor stimulation in augmenting motor recovery in stroke patients.
The improvement in the neurological and functional status observed at the time of discharge was maintained during the follow up period.
Stroke cases with severe neurological damage, as evidenced by low Scandinavian stroke scale score on admission required longer duration of treatment.
The neurological and functional recovery, as evidenced by the high percentage of Scandinavian stroke scale score and Functional independence measure score on discharge and follow up are maximum in the stroke cases which were admitted for treatment with short time lag.
In the hemorrhagic stroke cases, the neurological recovery at the time of discharge and follow up are less when compared to thrombotic and embolic stroke cases.
The neurological and functional recovery on discharge and follow up are better if the lesion is at the level of the cortical than at th