HAEMATOLOGICAL PROFILE IN THE DIFEERENTIAL
DIAGNOSIS OF MICROCYTIC HYPOCHROMIC ANAEMIA
IN CHILDREN
Dissertation submitted in
Partial fulfillment of the regulations required for the award of M.D. DEGREE
IN
PATHOLOGY
THE TAMILNADU
DR.M.G.R. MEDICAL UNIVERSITY, Chennai,
CERTIFICATE
This is to certify that the dissertation entitled Haematological profile in the differential diagnosis of Microcytic Hypochromic Anaemia in Children - is a bona fide work done by Dr.Karthika.V, postgraduate student in the department of pathology, Coimbatore Medical College, Coimbatore under the supervision of Dr.M.Murthy,MD, Professor & Head, Department of Pathology, Coimbatore Medical College, Coimbatore and under the guidance of Dr.C.Lalitha,MD, Additional Professor, Department of Pathology, Coimbatore Medical College, Coimbatore in partial fulfillment of requirements of the Tamilnadu Dr. MGR Medical University for the award of MD Degree in Pathology.
Guide Dr. C. Lalitha, MD, Additional Professor, Department of Pathology, Coimbatore Medical College, Coimbatore.
Dr. R. Vimala, MD, Dr. M. Murthy, MD, Dean, Professor & Head, Coimbatore Medical College, Department of Pathology,
INTRODUCTION:
Anaemia, whether clinically overt or not is a common condition encountered by the family physician. The most commonly encountered disorders manifesting with mild microcytic hypochromic anaemia are iron deficiency anemia (IDA) and Thalassemia Trait (TT)1,2. Hypochromic microcytic aneamia could also be due to anaemia of chronic disease or lead poisoning. The establishment of an accurate diagnosis is of great importance in ensuring correct treatment. Administration of iron to a patient with hypochromic aneamia due to a cause other than iron deficiency is not only useless but also leads to undesirable effects of increase in body iron stores. Thalassemia Minor and Thalassemia Intermedia may pass off as iron deficiency anaemia, if only peripheral smear was the sole diagnostic modality.
β-Thalassemia is also an iron loading anemia, meaning that thalassemic patients have a dramatic increase in iron absorption from the gut due to their increased erythropoietic rate3–6. Together with the iron influx from chronic transfusions the setting of iron overload is observed in thalassemic patients. Inadvertent iron therapy will prove detrimental in such situations.
Consequently, poor iron homeostasis during this period can result in disordered development. Inadequate tissue iron levels can lead to reduced erythropoiesis and poor O2-carrying capacity. The nervous system, which develops rapidly during the late fetal and early neonatal period, seems to be particularly susceptible to iron deficiency and excess 8. Also, Iron excess can have severe effects on neuron development 6–8. Thus, events occurring in early life can have long-lasting effects on neuronal function in the adult. Excessive iron in the circulation leads to abnormal accumulation in organs such as liver, spleen and heart, leading ultimately to liver disease, cardiac dysfunction, arthropathy, gonadal insufficiency and other endocrine disorders (Hoffman et al., Hematology, Basic Principles and Practice15).
AIM OF THE STUDY
1. To find out causes of microcytic hypochromic anaemia in children & their respective prevalence.
2. To study red cell indices in various types of hypochromic microcytic anaemia.
3. To analyze the Serum Iron, Total Iron Binding Capacity, Serum Ferritin levels in various types of hypochromic microcytic anaemia.
AIM OF THE STUDY
1. To find out causes of microcytic hypochromic anaemia in children &
their respective prevalence.
2. To study red cell indices in various types of hypochromic microcytic
anaemia.
3. To analyze the Serum Iron, Total Iron Binding Capacity, Serum Ferritin
REVIEW OF LITERATURE
DEFINITION:
Anaemia is defined as a reduction in the concentration of circulating haemoglobin or oxygen carrying capacity of blood below the level that is expected for healthy persons of same age and sex in the same environment.
PREVALENCE:
Anaemia remains a widespread public health problem with major consequences for human health as well as social and economic development. Although estimates of the prevalence of anaemia vary widely and accurate data are often lacking, it can be assumed that significant proportions of young children and women of childbearing age are anaemic (WHO 2001, 2003). Preschool children are more affected than women, with reported prevalence in excess of 60% in many countries. Nutritional deficiency constitutes most common cause of anaemia (Iron, B12, & Folic acid).
Thalassemia primarily affects people of Mediterranean, Southeast Asian, and African ancestry in malaria-endemic regions [J Nippon med Sch 2004;7112].
THE PREVALENCE AND DISTRIBUTION OF IRON
DEFICIENCY WORLDWIDE:
Iron deficiency is the most prevalent and the most common micronutrient deficiency in the developing world today (Tatala et al,199816; Asobayire et al.200117;Abalkhail and Shawky, 200218;Hashizume et al.200319).
Data presented in shows regions with the numbers of anemic cases in these regions as reported by WHO (WHO, 2001).
Percentage of affected population
Age group/y Industrialized Countries Non-industrialized Countries
0-4 years 20.1 39
5-14 years 5.9 48.1
Females 15-59 years 10.3 42.3
Males 15-59 years 4.3 30
HEMATOPOIESIS
EMBRYONIC HEMATOPOIESIS
Erythropoiesis takes place within the primitive circulation (intravascular) and is megaloblastic in type. Multipotent progenitors derived from the mesoderm are present at early stages of gestation. For many years, investigators have believed that yolk sac blood islands contained Hematopoietic Stem Cells (HSC) capable of primitive hematopoiesis and of migration to the developing liver to initiate definitive hematopoiesis. Challenging the idea of a singular origin of hematopoiesis in the yolk sac, it has been proposed that there is a more potent intraembryonic HSC site in the Aorta-Gonado-Mesonephros (AGM) region. HSCs arise for the first time in the AGM region and migrate to the yolk sac and fetal liver, the main source of hematopoietic cells in fetal life. Around the time of birth, HSCs migrate from the liver to the bone marrow, to be responsible for adult hematopoiesis.
At about sixth week of gestation, erythropoiesis begins in the fetal liver extravascularly, with mature cells entering the fetal circulation. Erythropoiesis is also detectable in the spleen by the 12th week, this remaining the primary site of erythropoiesis untilthe 24th week.
BONE MARROW HAEMATOPOIESIS
:This commences at around week 16 to 18, as fetal liver
Haem is complex of protoporphyrin and iron. Succinyl coA + Glycine
δ Amino levulinic acid
Protoporphyrin IX Fe 2+ Haem
+ Globin
Haemoglobin
GLOBIN SWITCHING:
HbGower 2 is present from 4 to 13 weeks of gestation. HbPortland also persists from 4 to 13 weeks but is found in infants with homozygous Thalassemia. HbF is the major fetal form and accounts for 90 to 95% of the total haemoglobin until 34 to 36 weeks gestation. Adult haemoglobin (HbA) is detectable from week 11 of gestation, after which time the proportion of HbA increases as HbF declines. The amount of HbF in neonates varies from 50 to 90%, but thereafter declines at a rate of 3% per week and is generally less than 2 to 3% by the age of 6 months.
Relative proportions & constitutions of different haemoglobins are; Adults:
Hb A - α2β2 - 97% Hb A2 - α2δ2 - 2.5% Hb F - α2γ2 - 0.5 Newborn:
Hb F - α2γ2 - 80% Hb A - α2β2 - 20% Embryonic Hb:
FETAL BLOOD CELL VALUES
Haemoglobin concentration rises from a mean of 11.7 g/dl at 18 weeks to 13.6 g/dl at >30 weeks, with a steady rise in hematocrit (0.37 l/l to 0.43 l/l) and concomitant fall in mean cell volume (131 fl to 114 fl). Circulating normoblasts constitute 45% of nucleated cells at 18 weeks, falling to 17% at >30 weeks. Lymphocyte percentage falls from 88% to 68%, with neutrophils only rising significantly after 30 weeks (8% at 26 to 29 weeks to 23% at >30 weeks). Eosinophil, monocyte, and basophil percentages remain reasonably constant throughout. Platelet concentration also remains constant. (Oxford Handbook).
MEASUREMENT OF ERYTHROPOIESIS
Normal red blood cell production is extremely effective, and most red blood cells live, or have the potential to live, a normal life span. Under certain conditions, however, a fraction of red blood cell production is ineffective, with destruction of nonviable red blood cells either within the marrow or shortly after the cells reaches the blood.
EFFECTIVE ERYTHROPOIESIS
It
is most simply estimated by determining the reticulocyte count. Thisreticulocyte count may give an erroneous impression of the actual rate of red cell production because of premature release of reticulocytes into the circulation.
INEFFECTIVE RED BLOOD CELL PRODUCTION:
Ineffective erythropoiesis is suspected when the reticulocyte count is low or is normal or only slightly increased in the presence of erythroid hyperplasia in the bone marrow. In certain disorders, such as Addisonian pernicious anemia, Thalassemia, and sideroblastic anemia, ineffective erythropoiesis is a major component of total erythropoiesis. This can be quantified by ferrokinetics. Using ferrokinetic methods, ineffective erythropoiesis is calculated as the difference between total plasma iron turnover and erythrocyte iron turnover plus storage iron turnover.
HEMATOPOIETIC REGULATION
Hematopoietic Stem Cells (HSCs). HSC proliferation is intimately linked to the stromal cells and Extra Cellular Matrix (ECM) in distinct microenvironmental niches. They composed of a variety of molecules, including fibronectin, laminin, collagens, and proteoglycans. Some components of the ECM bind to cytokines produced by the stroma, immobilizing them within the microenvironmental niches and thus creating a zone in which HSCs and cytokines can coalesce.
IRON METABOLISM
Most of the iron is present in the oxygen carrying protein of the red blood cells-haemoglobin. Iron turnover is also dominated by the synthesis and breakdown of haemoglobin. Haem is synthesized in nucleated red cells in the bone marrow by a pathway ending with the incorporation of iron into protoporphyrin IX by ferrochelatase. Haem breakdown takes place in phagocytic cells, largely those in the spleen, liver and bone marrow. Iron is released from haem by haem oxygenase and is largely reused for haem synthesis. Every day about 30 mg of iron are used to make new haemoglobin and most of this obtained from the breakdown of old red cells.
iron. This is iron in ferritin or its insoluble derivative haemosiderin which is available for haem synthesis if necessary.
DIETARY IRON ABSORPTION
Iron absorbed depends on 13
• The amount of iron in the diet
• Its bioavailability
• The body’s need for iron
• Age and
• Inflammatory states with hepcidin release
Nonhaem iron is released from food as Fe 3+ and reduced to Fe2+ by a membrane – bound ferrireductase, Dcytb.
Iron is transported across brush-border membrane by the metal transporter, DMT-1. Some iron is incorporated into ferritin and lost when the cells are exfoliated.
Iron destined for retention by the body transported across the serosal membrane by ferroportin-1. Before uptake by transferrin, Fe2+ is oxidised to Fe3+ by hephaestin or by plasma ceruloplasmin.
entering the labile iron pool and following a common pathway with iron of nonhaem origin14.
REGULATION OF IRON ABSORPTION
Iron absorption may be regulated both at the stage of mucosal uptake and at the stage of transfer to the blood. As epithelial cells develop in the crypts of Lieberkuhn their iron status reflects that of plasma (transferrin saturation) and this programmes the cells to absorb iron appropriately as they differentiate along the villus.
Transfer to the plasma depends on the requirements of the erythron for iron and the level of iron stores. This regulation is mediated directly by hepcidin, a peptide synthesized in the liver in response to iron and inflammation. Hepcidin blocks intestinal iron absorption and iron release from liver and spleen. The main mechanism by which hepcidin exerts its effects appears to be control of ferroportin. Indeed, ferroportin is the only known cellular iron exporter which cannot mediate iron release from the cell once hepcidin exerts its actions.
CELLULAR IRON UPTAKE AND RELEASE
initiates endocytosis of the local membrane. The resulting endosome contains the transferrin-transferrin receptor complex. The pH of the endosome is then reduced by a proton pump to induce a conformational change in holotransferrin, which releases its iron. Iron is transported into the cell via DMT-1. This iron is then either stored as ferritin or used within the cell (for Hb synthesis in erythroid precursors). The apotransferrin and transferrin receptor return to the cell surface where they dissociate at neutral pH so that the cycle can start again.
The reticuloendothelial macrophages play a major role in recycling iron resulting from the degradation of haemoglobin from senescent erythrocytes. They engulf red blood cells and release the iron within using haem oxygenase. The iron is rapidly released to plasma transferrin or stored as ferritin. Little is known about the mechanism of release, but ferroportin 1 may be as essential component.
Ferritin is found in all the cells and in the highest concentration in liver, spleen and bore marrow14.
IRON NEEDS DURING INFANCY AND CHILDHOOD
To meet the needs of iron for growth and to replace normal losses, iron intake must supplement the approximately 75 mg of iron per kilogram of body weight that is present at birth (Widdowson, Spray, et al.21). Iron losses from the body are small and relatively constant. About two thirds of iron losses in infancy occur when cells are extruded from the intestinal mucosa and the remainder when cells are shed from the skin and urinary tract. In the normal infant, these losses average approximately 20 mg per kilogram per day. An infant who weighs 3kg at birth and 10kg at one year of age will require approximately 270 to 280mg of additional iron during the first year of life to maintain normal iron stores [Widdowson et al.21].
After one year of age, the diet becomes more varied and there is less information from studies on which to base dietary recommendations. The recommended dietary allowance decreases to 10mg per day for children between 4 and 10 years of age and then increases to 18mg per day at the age of 11 to provide for the accelerated growth that take place during adolescence (Elk et al.23). Two thirds of body iron is present in circulating red blood cells as haemoglobin. Each gram of haemoglobin contains 3.47 mg of iron; thus, each ml of blood lost from the body (haemoglobin 15 g/dl) results in a loss of 0.5 mg of iron (Conrad et al.).
Hookworms also reported as other causative bleeding agents as 35% of ID total reported to suffer from hookworm infections. Necator americanus or Ancylostoma duodenale are the most common parasitic species involved in bleeding; however, further investigation is required for the identification of such parasites (Hopkins et al.25).
IRON DIFICIENCY ANAEMIA
Iron balance is usually achieved by regulation of iron absorption in the proximal small intestine. Either diminished absorbable dietary iron or excessive loss of body iron can cause iron deficiency.
as important as absorption in terms of maintaining iron equilibrium, it is a more passive process than absorption. Consistent errors in maintaining this equilibrium lead to either iron deficiency or iron overload (Conrad et al. ). Also some constituents present in the food regulate the absorption of Iron. Ascorbic acid enhances the absorption of non-heme iron, as do meat, fish, and poultry (Derman et al.26). Inhibitors of absorption include bran, polyphenols, oxalates, phytates, vegetable fiber, the tannins in tea, and phosphates (Charlton and Bothwell et al.27).
Iron-deficiency anemia can be the consequence of several factors, including:
• Insufficient iron in the diet
• Poor absorption of iron by the body
• Ongoing blood loss, most commonly from menstruation or from gradual blood loss in the intestinal tract
• Periods of rapid growth
• Damage of intestines
• Infection and disturbance of mucosa
• Elevation of pancreatic secretions
difference. Toddlers also tend to drink a lot of cow's milk, often more than 24 ounces a day. During the first stages of puberty, when growth spurt occurs, boys are at risk of iron-deficiency anemia. Adolescent girls are at higher risk because of menstrual blood loss and smaller iron stores when compared to boys (Christopher et al.28).
SYMPTOMS OF IRON DEFICIENCY ANEMIA
Many people with iron deficiency anemia will not suffer from additional symptoms; however several common symptoms of iron deficiency anemia are well defined.
The symptoms include:
• Headache,
• Abnormal pallor or lack of color of the skin,
• Irritability,
• Lack of energy or tiring easily (fatigue),
• Increased heart rate (tachycardia),
• Sore or swollen tongue,
• Enlarged spleen,
DIAGNOSIS OF IRON DEFICIENCY ANEMIA
Iron-deficiency anemia develops as an end result of a series of steps that begin with depletion of stored iron. First, iron disappears from the bone marrow, and the red-cell distribution width becomes abnormal. Next, there is a loss of transport iron, reflected by a reduced serum iron level. Then, erythropoiesis becomes iron-deficient, as indicated by a reduced mean corpuscular volume and an increased concentration of red-cell protoporphyrin. The result is overt anemia.
Diagnosis of moderate or severe iron-deficiency anemia is easy. The disease is characterized by low MCV, reduced serum ferritin level, reduced serum iron level, increased serum iron-binding capacity, increased red-cell protoporphyrin level, and increased red-cell distribution width. The diagnosis of mild forms of iron-deficiency anemia may present a greater challenge. The laboratory tests may be less reliable, and the values of iron deficient and iron-sufficient persons overlap considerably (Charlton et al., Yip et al.27). The following represent general considerations:
• A complete blood count (CBC) may reveal low haemoglobin levels and low hematocrit (the percentage of red blood cells in whole blood).
• Serum iron directly measures the amount of iron in blood, but may not accurately reflect iron concentrations in cells.
• Serum ferritin reflects total body iron stores. It is one of the earliest indicators of depleted iron levels, especially when used in conjunction with other tests, such as (CBC).
The most useful single laboratory value for the diagnosis of iron deficiency may be plasma ferritin. Ferritin is the cellular storage protein for iron. Plasma ferritin differs from its cellular counterpart in several respects, and appears to be a secreted protein of different origin (Arosio et al.29). Plasma ferritin values often falls under 10% of its baseline levels with significant iron deficiency.
ANAEMIA OF CHRONIC DISEASE
PATHOPHYSIOLOGY
erythropoiesis. The increase in iron storage appears to be mediated by pro-inflammatory cytokines.
Tumor necrosis factor-alpha, for example, inhibits synthesis of the iron storage protein ferritin in macrophages and hepatocytes. Additionally, the expression of the membrane protein DMT1 is upregulated by interferon-gamma, bacterial lipopolysaccharide and tumor necrosis factor-alpha. This protein mediates iron transport into the intestinal mucosal cell as well as into activated macrophages. Moreover, export of iron from these cells is inhibited through down regulation of the expression of ferroportin.
Hepcidin appears to play a central role in this setting, because it is more abundantly expressed under the influence of lipopolysaccharide and interleukin-6 secretion. This, in turn, yields an additional inhibition of iron absorption from the gut. Furthermore, the action of aforementioned cytokines, especially that of interferon-gamma, leads to a direct suppression of erythropoiesis. It has been proposed that the responsible mechanisms are an induction of apoptosis and inhibition of erythropoietin expression.
differentiate into red blood cells. This effect may be an important additional cause for the decreased erythropoiesis seen in anaemia of inflammation, even when erythropoietin levels are normal, and even aside from the effects of hepcidin.
In the short term, the overall effect of these changes is likely positive: it allows the body to keep more iron away from bacterial pathogens in the body, while producing more immune cells to fight of infection. Bacteria, like most living forms, depend on iron to live and multiply. However, if inflammation continues, the effect of locking up iron stores is to reduce the ability of the bone marrow to produce red blood cells.
CLINICAL PROFILE
β
-THALASSEMIA
PATHOPHYSIOLOGY OF β-THALASSEMIA:
Thalassaemia is inherited as an autosomal recessive disorder characterized by a microcytic hypochromic anaemia, and a clinical phenotype varying from almost asymptomatic to a lethal haemolytic anaemia. It is characterized by decreased or absent globin chain synthesis and by ineffective erythropoiesis. It is classified according to the defective globin chain and clinical severity.
Individuals who are homozygotes for β-Thalassemia genes (β+/β+, β0/β0) have a severe, transfusion dependent anaemia called β-Thalassemia Major. Heterozygotes with one Thalassemia gene and one normal gene (β+/β or β0/β) usually have a mild microcytic anaemia that causes no symptoms. This condition is known as Thalassemia Minor or Thalassemia Trait. Thalassemia Intermedia are is the third genetic variant of the β -Thalassemias,(β+/β+ or β0/ β) which incorporates a less severe anemia than Thalassemia Major with inefficient erythropoiesis as well as peripheral hemolysis.
membrane damage, and premature destruction within the bone marrow leading to ineffective erythropoiesis, and also lysis of premature red cells in the spleen (hemolysis).
Leg ulcers, pulmonary arterial hypertension, extramedullary hematopoiesis, and thrombotic events are some of the complications that Thalassemia Intermedia patients. Thalassemia Intermedia encompasses a wide clinical spectrum. Mildly affected patients are completely asymptomatic until adult life, experiencing only mild anemia and maintaining haemoglobin levels between 7 to 10 g/dl. These patients require only occasional blood transfusions, if any. Patients with more severe Thalassemia Intermedia generally present between the ages of 2 and 6 years, and although survival does not depend on regular transfusion therapy, growth and development can be retarded. Thalassemia Minor is more common than Thalassemia Major (Robbins). These patients are usually asymptomatic; anaemia is mild.
Recognition of β Thalassemia Trait is important on two accounts:
1. Differentiation of microcytic hypochromic anaemia from Iron deficiency anaemia.
2. Genetic counseling.
[J Niipon Med Sch 2004: 7112]. This shows the importance of screening for hypochromic microcytic anaemia.
Differentiation can be reasonably made between Iron deficiency anaemia and β Thalassemia Trait using Red cell counts. Elevated Red cell count especially in the presence of mild anaemia was a reliable indicator of β Thalassemia Trait.(Nishi madhan et al.) in this study 287 Trait had an elevated RBC count in contrast to 9 in Iron deficient subjects.
DIAGNOSIS
CLINICAL DIAGNOSIS
Thalassemia Major is usually suspected in an infant younger than two years of age with severe microcytic anemia, mild jaundice and hepatosplenomegaly. Thalassemia Intermedia presents at a later age with similar but milder clinical findings. Carriers are usually asymptomatic, but sometimes may have mild anemia. Hematologic Diagnosis RBC indices show microcytic anemia. Thalassemia Major is characterized by reduced Hb level (<7 g/dl), mean corpuscular volume (MCV) > 50 < 70 fl and mean corpuscular Hb (MCH) > 12< 20 pg.
PERIPHERAL BLOOD SMEAR
• Affected individuals show RBC morphologic changes [microcytosis, hypochromia, anisocytosis, poikilocytosis (speculated tear-drop and elongated cells), and nucleated RBC (i.e., erythroblasts). The number of erythroblasts is related to the degree of anemia and is markedly increased after splenectomy.
•
Carriers have less severe RBC morphologic changes than affected individuals. Erythroblasts are normally not seen. Qualitative and quantitative Hb analysis (by cellulose acetate electrophoresis and DE-52 microchromatography or HPLC) identifies the amount and type of Hb present. The Hb pattern in β-Thalassemia varies according to β -Thalassemia type. In beta0 -Thalassemia, homozygotes HbA is absent and HbF constitutes the 92-95% of the total Hb. In beta+ Thalassemia homozygotes and beta+/beta0 genetic compounds HbA levels are between 10 and 30% and HbF between 70-90%. HbA2 is variable in β-Thalassemia homozygotes and it is enhanced in beta Thalassemia Minor.MOLECULAR GENETIC ANALYSIS
procedures [36]. The most commonly used methods are reverse dot blot analysis or primer-specific amplification, with a set of probes or primers complementary to the most common mutations in the population from which the affected individual originated.
[image:31.612.96.545.349.677.2]• If targeted mutation analysis fails to detect the mutation, beta globin gene sequence analysis can be used to detect mutations in the beta globin gene.
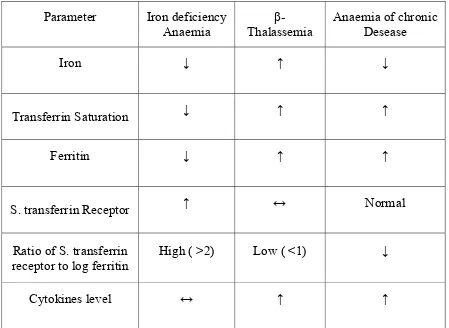
Table-4;
Serum values in various hematological profiles of
microcytic hypochromic anaemia
:
Parameter Iron deficiency
Anaemia Thalassemia β- Anaemia of chronic Desease
Iron ↓ ↑ ↓
Transferrin Saturation ↓ ↑ ↑
Ferritin ↓ ↑ ↑
S. transferrin Receptor ↑ ↔ Normal
Ratio of S. transferrin receptor to log ferritin
High ( >2) Low ( <1) ↓
RED CELL INICES AND FUNCTIONS
:Several studies have derived discriminatory functions based on RBC indices that can be used to differentiate between patients with
Thalassemia and those with Iron deficiency anaemia (Shine and lal et al.39).
Red cell indices used to are;
• Mentzer index (MI)
• Shine and lal index (S&L)
• England and Fraser index (E &F)
• Srivastava index (S)
• Green and King index (G&K)
• RDW index (RDWI)
• Ricerca index (R)
These indices have been proposed during the past 35 years to discriminate between the two ( Sirdah et al.42). An ideal discrimination index should have high sensitivity and specificity and is easy to calculate. (M.A. Ehsani et al.53)
PERIPHERAL SMEAR EXAMINATION
:
MICROCYTES:
Microcytes usually result from defect in haemoglobin synthesis. It should be distinguished from red cell fragmentation. Both abnormalities can lead to a reduction in the mean cell volume. However low MCV is common in association with a defect in Haemoglobin synthesis, where as it is uncommon in fragmentation syndromes because the fragments usually comprise only a small percentage of erythrocytes.
HYPOCHROMASIA:
Normal central pallor will be increased due to defective haemoglobin synthesis.
BASOPHILIC STIPPLING:
poisoning (Dacie and Lewis). Coarse basophilic stippling is defined as easily identified, uniformly distributed basophilic inclusions.
PREKERATOCYTES:
They are RBCs with 1 or more sharp-edged, submembranous vacuoles and central pallor. They are commonly observed in Iron deficiency anaemia (Alexandara et al).
PENCIL CELLS:
They
are elongated, hypochromic RBCs, in which the long axis wasmore than 3 times the length of the short axis, more commonly seen in IDA compared to Beta TT.
TARGET CELLS:
MATERIAL AND METHODS
STUDY DESIGN:-
Prospective study
STUDY POPULATION:-
Patients aged 1-12 years with microcytic hypochromic anaemia.
SAMPLE SIZE:-
A total of forty patients with hypochromic microcytic anaemia were subjected to assessment of hematological profile. Approximately 1200 samples of hypochromic microcytic anaemia are received in the department of pathology per year representing 3.67% of incidence.
STUDY PERIOD:-
One and a half years [February 2009 to August 2010].
METHODOLOGY:-
Patients aged 1-12 years with microcytic hypochromic anaemia are selected with following inclusion and exclusion criteria.
INCLUSION CRITERIA:-
• Age group 1-12 years.
• Patients with clinical symptoms of anaemia.
II. EXCLUSION
CRITERIA:-• Age below one year and above twelve years.
• Peripheral smear with dimorphic picture.
• H/O transfusion within past two months.
• Children on haematinics.
REFERENCE VALUE
(dacie and lewis):Indices 1 year 2- 6 years 6- 12 years Red cell count x1012/l 4.5(+/-)0.6 4.6 (+/-)0.6 4.6(+/-)0.6
Haemoglobin g/l 126(+/-)15 125(+/-)15 135(+/-)20 PCV l/l 0.34(+/-)0.04 0.37(+/-)0.03 0.40(+/-)0.05 MCV fl 78(+/-)6 81(+/-)6 86(+/-)9 MCH pg 27(+/-)2 27(+/-)3 29(+/-)4
MCHC g/l 340(+/-)20 340(+/-)30 340(+/-)30
Reticulocyte x109/l 30-100 30-100 30-100
[PCV- Packed Cell Volume, MCV- Mean Cell Volume, MCH- Mean Cell Hb, MCHC – Mean Cell Hb Concentration].
DETECTION PRINCIPLE:
This instrument performs blood cell count by DC detection method. Blood sample is aspirated, measured to a predetermined volume, diluted at the specified ratio, and then fed into the each transducer. The transducer chamber has a minute hole called aperture. On both sides of the aperture there are electrodes between which flows the direct current. Blood cells suspended in the diluted sample pass through the aperture, causing direct current resistance to change between the electrodes. As the current resistance changes, the blood cell size is detected as electric pulses. Blood cell count is calculated by counting the pulses, and a histogram of blood cell size is plotted by determining the pulse size. Also analyzing a histogram makes it possible to obtain various analysis data.
To analyze the haemoglobin by automated methods, the cyanmethaemoglobin or oxyhaemoglobin methods have so far been the mainstream.
Serum Iron level assay:
Method: Ferrozine method without deproteinization. Serum Iron binding capacity:
Method: Spectrophotometric assay.
Ferritin estimation:
PRINCIPLE OF IRON & TIBC ESTIMATION:
Iron bound to transferrin, is released in an acidic medium and the ferric ions are reduced to ferrous ions, the Fe(II) ions react with ferrozine to form a violet coloured complex. Intensity of the complex formed is directly proportional to the amount of Iron present in the sample.
For TIBC, the serum is treated with excess of Fe(II) to saturate the Iron binding sites on transferrin. The excess Fe(II) is adsorbed and precipitated and the Iron content in the supernatant is measured by spectrophotometry to give the TIBC.
Acidic medium
Fe(III) Fe(II)
Fe(II) + Ferrozine violet coloured complex
RED CELL INDICES:
1. Mean corpuscular volume (MCV) in femtolitres
Packed cell volume in %
MCV = x 10 Red cell count in millions/cmm
2. Mean corpuscular haemoglobin (MCH) in picograms
Haemoglobin (gm/dl)
3. Mean corpuscular haemoglobin concentration (MCHC) in gm/dl
Haemoglobin (gm/dl)
MCHC = x 100 Packed Cell Volume (%)
4. Reticulocyte count:
Reticulocyte counted
Reticulocyte count = x 100 Number of red cells
Following indices were also obtained for these patients
Red Blood Cell (RBC) count RBC Distribution Width (RDW)
Mean cell volume Mentzer index =
Red blood cell count
Shine and Lal Index = Mean cell volume 2 X Mean corpuscular
Haemoglobin X 0.01
England & Fraser Index =Mean cell volume-Red blood cell-5Hb-3Hb
Mean corpuscular Hb Srivasthava index =
Red blood cell
Green & king index = Mean cell volume2 X RDW
Mean cell volume X RDW RBC Distribution width index =
RBC Red cell distribution width Ricerca index =
Red blood cell count
Threshold values of Indices used to discriminate between Iron deficiency
anaemia and β–Thalassemia Trait
Indices IDA β - TT
Ricerca Index >4.4 <4.4
RBC count <5 >5 RBC distribution width >14 <14
Mentzer index >13 <13
Shine and Lal index >1530 >1530
England and Fraser Index Positive Negative Srivastava Index >3.8 <3.8
Green and King Index >65 <65 RBC distribution width index >220 <220
RED CELL DISTRIBUTION WIDTH:
OBSERVATION AND RESULTS
Newly diagnosed cases of microcytic hypochromic anaemia admitted to
Coimbatore Medical College hospital with no prior blood transfusion or iron
treatment were randomly enrolled. A total of 44 cases were enrolled as per
inclusion and exclusion criteria.
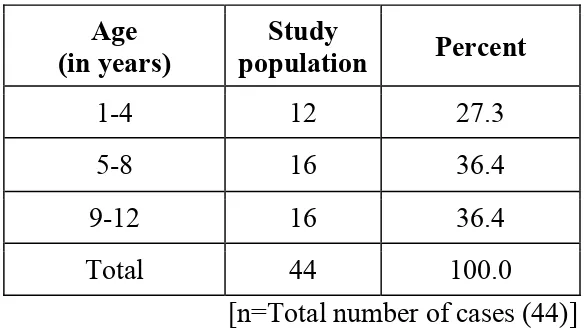
AGE:
Patient with Microcytic Hypochromic Anaemia with age between 1-12 years
were included in this study. Out of 44 cases, 27.3% were below 4 years,
[image:41.612.160.453.401.565.2]36.4% were between 5-8 years & 36.4% were between 8-12 years.
Table-1: Age incidence
Age (in years)
Study
population Percent
1-4 12 27.3
5-8 16 36.4
9-12 16 36.4
Total 44 100.0
[n=Total number of cases (44)]
SEX
Among the randomly enrolled 44 patients, 25 were girls while the remaining
SEVERITY OF ANAEMIA
Mild anaemia (Hb 10-12 g/dl) was present in 26 cases, moderate anaemia
(Hb 8-9.9 g/dl) in 13 cases and severe anaemia (Hb <8 g/dl) in 5 cases.
Table-2: Severity of anaemia:
Hb (g/dl) populationStudy Percent
< 8 26 59.1 8 – 9.9 13 29.5 10 – 11 5 11.4
Total 44 100.0
MEAN CORPUSCULAR VOLUME (MCV)
[image:42.612.189.428.177.348.2]97.7% of study population had MCV below 80 fl.
Table-3: MCV distribution
MCV(fl) Study
population Percent
<80 43 97.7
80 – 100 1 2.3
MEAN CORPUSCULAR HAEMOGLOBIN
[image:43.612.183.431.170.310.2]93.2% had MCH below 25pg.
Table-4: MCH distribution
MCH (pg) populationStudy Percent
25 & below 41 93.2
26 – 34 3 6.8
Total 44 100.0
MEAN CORPUSCULAR HAEMOGLOBIN CONCENTRATION
95.5% had MCHC below 30 g/dl.
Table-5: MCHC distribution
MCHC (g/dl) populationStudy Percent
30 & below 42 95.5
31 – 37 2 4.5
[image:43.612.173.425.499.654.2]SERUM FERRITIN:
Out of 44 cases, 52.3% had S. Ferritin below 12ng/dl, 20.5 % had S. Ferritin
between 12-50ng/dl & 27.3% had S. Ferritin above 50ng/dl.
Table-6: Serum Ferritin
S. Ferritin (ng/dl)
Study
population Percent
<12 23 52.3
12-50 9 20.5
>50 12 27.3
Total 44 100.0
TOTAL IRON BINDING CAPACITY:
Out of 44 cases, 6.8% had TIBC < 250 µg/dl, 45.5% had TIBC between
[image:44.612.187.426.205.366.2]250-400 µg/dl & 47.7% had TIBC >400 µg/dl.
Table-7: Total Iron binding capacity (TIBC)
TIBC (µg/dl) population Study Percent
<250 3 6.8
250-400 20 45.5
>400 21 47.7
SERUM IRON IN FEMALE CHILDREN:
Out of 25 girls in the study population, 80% had S. Iron < 60 µg/dl, 4% had
S. Iron 60- 160 µg/dl & 16% had S. Iron >160 µg/dl.
Table-8: Serum Iron in girls
S. Iron (µg/dl)
No. of girls in
the study Percent
<50 20 80.0
50-150 1 4.0
>150 4 16.0
Total 25 100.0
SERUM IRON IN MALE CHILDREN:
[image:45.612.176.437.205.366.2]89. 5% of boys in the study population had a S. Iron below 35µg/dl.
Table-9: Serum Iron in boys
S. Iron (µg/dl) No. of boys in the study Percent
<50 18 94.7
50-150 - -
>150 1 5.3
Total 19 100.0
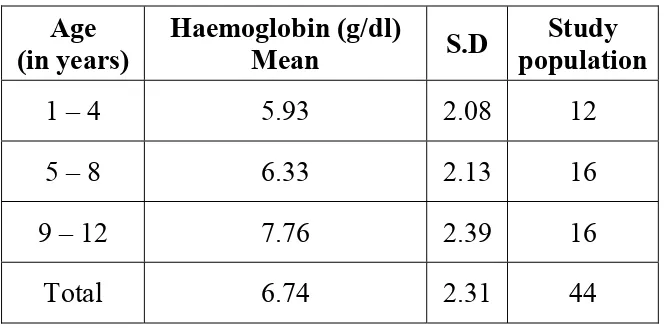
[image:45.612.172.441.499.655.2]AGE WISE STATISTICAL ANALYSIS
Mean haemoglobin level does not vary significantly with age. When
ANOVA test was conducted (F=2.765; P>0.05) the mean haemoglobin was
highest in the age group of 9- 12 years (7.76 g/dl) and lowest in the age
[image:46.612.141.473.267.431.2]group of 1-4 years (5.93 g/dl).
Table-10: Haemoglobin in various age groups
Age (in years)
Haemoglobin (g/dl)
Mean S.D
Study population
1 – 4 5.93 2.08 12
5 – 8 6.33 2.13 16
9 – 12 7.76 2.39 16
Total 6.74 2.31 44
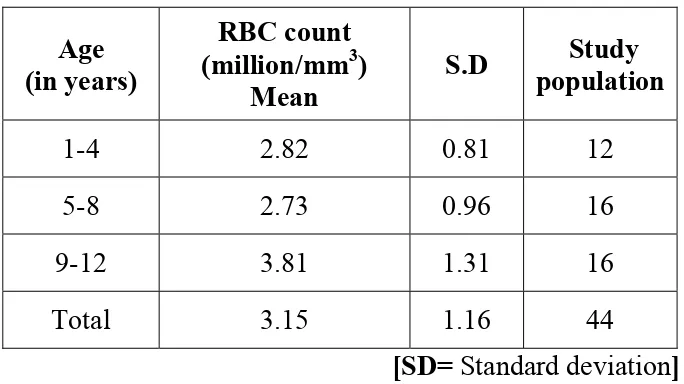
RBC COUNT IN VARIOUS AGE GROUPS
Mean RBC counts varied significantly with age. When ANOVA test was
conducted (F= 4.799; P<0.05*) the mean RBC count was highest in the age
group of 9- 12 years (3.81million/ mm3) and lowest in the age group of 5-8
Table-11: RBC count in various age groups
Age (in years)
RBC count (million/mm3)
Mean
S.D population Study
1-4 2.82 0.81 12
5-8 2.73 0.96 16
9-12 3.81 1.31 16
Total 3.15 1.16 44
[SD= Standard deviation]
HAEMATOCRIT IN VARIOUS AGE GROUPS
Mean haematocrit does not vary significantly based on age. When ANOVA
test was conducted (F= 3.098 ; P>0.05) the mean haematocrit was highest
in the age group of 9- 12 years ( 22.33%) and lowest in the age group of
5-8 years (17.10%).
Table-12: Haematocrit (HCT) in various age groups
Age (in years)
HCT (%)
Mean S.D
Study population
1 – 4 17.59 6.96 12 5 – 8 17.1 6.3 16 9 – 12 22.33 6.2 16
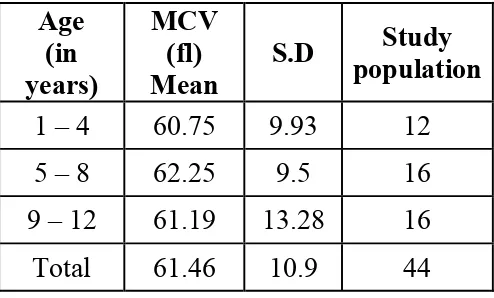
[image:47.612.136.478.133.325.2]MEAN CORPUSCULAR VOLUME IN VARIOUS AGE GROUPS
Mean MCV varied significantly with age. When ANOVA test was
conducted (F= 0.069; P < 0.05*) the MCV was highest in the age group
5-8 years (62.25 fl) and lowest in the age group of 1-4 years(60.75 fl).
Table-13: Mean corpuscular volumein various age groups
Age (in years)
MCV (fl) Mean
S.D populationStudy
1 – 4 60.75 9.93 12 5 – 8 62.25 9.5 16 9 – 12 61.19 13.28 16
Total 61.46 10.9 44
MCH IN VARIOUS AGE GROUPS
Mean MCH does not vary significantly with age. When ANOVA test was
conducted (F= 0.250; P>0.05) the mean MCH was highest in the age group
of 5-8 years (19.27pg) and lowest in the age group of 1-4 years (17.99 pg).
Table-14: Mean corpuscular haemoglobin in various age groups
Age (in years)
MCH (pg)
Mean S.D
Study population
1-4 17.99 5.18 12
5-8 19.27 4.68 16
9-12 18.61 4.57 16
[image:48.612.183.430.232.381.2]MEAN CORPUSCULAR HAEMOGLOBIN CONCENTRATION IN
VARIOUS AGE GROUPS
Mean MCHC does not vary significantly based on age. When ANOVA test
was conducted (F= 0.757; P >0.05) the mean MCHC was highest in the age
group 9-12years (25.05g/dl) and lowest in the age group of 1-4 years
[image:49.612.181.461.321.476.2](23.20g/dl).
Table-15: Mean corpuscular haemoglobin concentration in Various age
groups
RED CELL DISTRIBUTION WIDTH IN VARIOUS AGE GROUPS
Mean RDW varied significantly based on age. When ANOVA test was
conducted (F= 4.961; P<0.05*) the mean RDW was highest in the age group
1-4 years (53.01fl ) and lowest in the age group of 9-12 years (44.15fl).
Age (in years)
MCHC (g/dl)
Mean S.D
Study population
1-4 23.20 2.00 12
5-8 23.78 4.95 16
9-12 25.05 4.40 16
Table-16: Red cell distribution width in various age groups
Age (in years)
RDW (fl)
Mean S.D
Study population
1-4 53.01 9.94 12
5-8 50.68 8.14 16
9-12 44.15 5.51 16
Total 48.94 8.56 44
SERUM IRONIN VARIOUS AGE GROUPS
Mean S. Iron does not vary significantly with age. When ANOVA test was
conducted (F= 0.217; P>0.05) the mean Iron was highest in the age group of
1-4 years (66.40 gµ/dl) and lowest in the age group of 5-8 years (45.99µg/dl)
Table-17: Serum Iron in various age groups
Age (in years)
Serum Iron(µg /dL)
Mean S.D
Study population
1-4 66.40 96.57 12
5-8 45.99 80.07 16
9-12 52.61 70.98 16
[image:50.612.156.455.104.257.2]TIBC IN VARIOUS AGE GROUPS
Mean TIBC does not vary significantly based on age. When ANOVA test
was conducted (F= 0.569; P>0.05) the mean TIBC was highest in the age
group 5-8 years (402.53µg/dl) and lowest in the age group of 9-12 years
(372.40 µg/dl). Table-18: TIBC in various age groups
Age (in years)
TIBC (µg /dl)
Mean S.D
Study population 1-4 380.18 109.17 12
5-8 402.53 68.33 16
9-12 372.20 73.17 16
Total 385.40 82.01 44
FERRITIN IN VARIOUS AGE GROUPS
Mean ferritin does not vary significantly based on age. When ANOVA test
was conducted (F= 0.928; P>0.05) the mean ferritin was highest in the age
group of 1-4 years (195.15ng/dl) and lowest in the age group of 5-8 years
(43.30ng/dl). Table-19: Ferritinin various age groups
Age (in years)
Ferritin (ng /dl) Mean
S.D population Study
1-4 195.15 533.78 12
5-8 43.30 83.58 16
GENDERWISE STATISTICAL ANALYSIS
Mean Haemoglobin level does not vary significantly between boys and girls.
When t-test was applied (t= 0.087; P>0.05) the average haemoglobin in boys
[image:52.612.167.445.226.363.2]was 6.77g/dl & for girls 6.71g/dl.
Table-20: Distribution of Haemoglobin in both sexes
Gender
Haemoglobin (g/dl) Mean
S.D population Study
Girls 6.71 2.32 25
Boys 6.77 2.35 19
Total 6.74 2.31 44
DISTRIBUTION OF RBC COUNT IN BOTH SEXES
Mean RBC counts do not vary significantly between boys and girls. When
t- test was applied (t=1.707; P>0.05) the average RBC count in girls was
3.40 million/mm3 where as for boys it was 2.81 million/mm3
Table-21: Distribution of RBC count in both sexes
Gender (million/mmRBC count 3)
Mean
S.D population Study
Girls 3.40 1.38 25
Boys 2.81 0.68 19
DISTRIBUTION OF HAEMATOCRIT IN BOTH SEXES
Mean Haematocrit does not vary significantly between boys and girls. When
t- test was applied (t= 0.559; P>0.05) the average HCT in girls was 19.63%
where as for boys it was 18.47%.
Table-22: Distribution of Haematocrit in both sexes
Gender
HCT (%) Mean
S.D populationStudy
Girls 19.63 7.58 25
Boys 18.47 5.64 19 Total 19.13 6.76 44
DISTRIBUTION OF MCV IN BOTH SEXES
MCV does not vary significantly between boys and girls. When
t- test was applied (t=1.985; P>0.05) the average MCV in boys was 65.07fl
where as for girls it was 58.71fl.
Table-23: Distribution of MCV in both sexes
Gender
MCV (fl) Mean
S.D populationStudy
Girls 58.71 11.75 25
Boys 65.07 8.68 19
DISTRIBUTION OF MCH IN BOTH SEXES
Mean MCH does not vary significantly between boys and girls. When
t- test was applied (t= 0.256; P>0.05) the average MCH in girls was
18.52pg where as for boys it was 18.89 pg.
Table-24: Distribution of MCH in both sexes
Gender MCH (pg) Mean
S.D populationStudy
Girls 18.52 4.77 25
Boys 18.89 4.71 19
Total 18.68 4.69 44
DISTRIBUTION OF MCHC IN BOTH SEXES
Mean MCHC does not vary significantly between boys and girls. When
t- test was applied (t=0.556; P>0.05) the average MCHC in girls was
24.39g/dL where as for boys it was 23.68 g/dl.
Table-25: Distribution of MCHC in both sexes
Gender
MCHC (g/dl) Mean
S.D Study population
Girls 24.39 4.08 25
Boys 23.68 4.24 19
DISTRIBUTION OF RDW IN BOTH SEXES
Mean RDW does not vary significantly between girls and boys. When
t- test was applied (t=1.067; P>0.05) the average RDW in girls was 47.74fl
[image:55.612.173.436.230.374.2]where as for boys it was 50.52 fl.
Table-26: Distribution of RDW in both sexes
Gender RDW (fl)Mean S.D population Study
Girls 47.74 9.03 25
Boys 50.52 7.84 19
Total 48.94 8.56 44
DISTRIBUTION OF SERUM IRON IN BOTH SEXES
Mean serum Iron does not vary significantly between boys and girls. When
t- test was applied (t=1.575; P>0.05) the average serum Iron in girls was
70.31µg/dl where as for boys it was 32.46 µg/dl.
Table-27: Distribution of Serum Iron in both sexes
Gender Serum Iron (µg/dl) Mean
S.D population Study
Girls 70.31 98.31 25
Boys 32.46 40.69 19
[image:55.612.175.440.558.698.2]DISTRIBUTION OF TIBC IN BOTH SEXES
Mean TIBC does not vary significantly between boys and girls. When
t- test was applied ( F=1.079; P>0.05) the average serum Iron in girls was
[image:56.612.172.440.232.381.2]373.79 µg/dl where as for boys it was 400.68 µg/dl.
Table-28: Distribution of TIBC in both sexes
Gender (µg/dl) TIBC Mean
S.D Study population
Girls 373.79 90.81 25
Boys 400.68 68.12 19
Total 385.40 82.01 44
DISTRIBUTION OF FERRITIN IN BOTH SEXES
Mean ferritin does not vary significantly between boys and girls. When
t- test was applied (t=0.796; P>0.05) the average ferritin in girls was 141.87
ng/dl where as for boys it was 70.81 ng/dl.
Table-29: Distribution of ferritin in both sexes
Gender Ferritin (ng/dl) Mean
S.D population Study
Girls 141.87 370.69 25
Boys 70.81 131.43 19
[image:56.612.171.442.562.715.2]STATISTICAL ANALYSIS BETWEEN
β–TT AND MILD
TO MODERATE (8-11.5 G/DL) IDA
Mean haemoglobin varied significantly between IDA, β-TT. When t-test
was applied (t=3.239; P<0.01) the mean Haemoglobin in IDA patients was
8.99g/dl where as for β-TT 10.57g/dl.
Table-30: Distribution of Haemoglobin in IDA & β-TT
Anaemia Haemoglobin(g/dL)Mean S.D
Mild to moderate
anaemia
IDA 8.99 .81 11
Β- TT 10.57 .23 3 Total 9.33 .98 14
DISTRIBUTION OF MCV INIDA & β-TT
Mean MCV varied significantly between IDA, β-TT. When t-test was
applied (t=5.402; P<0.01**) the mean MCV in IDA patients was 68.45 (fl)
[image:57.612.153.462.256.387.2]where as for β-TT 38.91(fl). (**- significant at 1% level)
Table-31: Distribution of MCV in IDA & β-TT
Anaemia MCV (fl) Mean S.D
Mild to moderate
anaemia
IDA 68.45 9.20 11
β- TT 38.91 .16 3
DISTRIBUTION OF MCH IN IDA & β-TT
Mean MCH do not vary significantly between IDA, β-TT. When t-test was
applied (t=1.938; P>0.05) the mean MCH in IDA patients was 20.79 pg
[image:58.612.157.458.230.385.2]where as for β-TT 17.04 pg.
Table-32: Distribution of MCH in IDA & β-TT
Anaemia MCH (pg)
Mean S.D
Mild to moderate
anaemia
IDA 20.79 3.24 11
Β- TT 17.04 .80 3
Total 19.99 3.27 14
DISTRIBUTION OF MCHC IN IDA & β-TT
Mean MCHC do not vary significantly between IDA, β-TT. When t-test was
applied (t=1.382; P>0.05) the mean MCHC in IDA patients was 23.83g/dl
where as for β-TT 27.52 g/dl.
Table-33: Distribution of MCHC in IDA & β-TT
Anaemia MCHC (g/dl)
Mean S.D
Mild to moderate
anaemia
IDA 23.83 4.49 11
Β- TT 27.52 .54 3
[image:58.612.148.464.575.709.2]DISTRIBUTION OF RDW INIDA & β-TT
Mean RDW varied significantly between IDA, β-TT. When t-test was
applied (t=5.407; P<0.01) the mean RDW in IDA patients was 47.77 fl
[image:59.612.171.442.231.375.2]where as for β-TT 35.02 fl.
Table-34: Distribution of RDW in IDA & β-TT
Anaemia RDW (fl) Mean S.D
Mild to moderate
anaemia
IDA 47.77 3.66 11
Β-TT 35.02 3.42 3
Total 45.04 6.45 14
DISTRIBUTION OF SERUM IRON IN IDA & β-TT
Mean serum Iron does not vary significantly between IDA, β-TT. When
t-test was applied (t=1.248; P> 0.05 ) the mean serum Iron in IDA patients
were 50.11 µg/dl whereas for β-TT 131.03 µg/dl.
Table-35: Distribution of S.Iron in IDA & β-TT
Anaemia
Serum Iron (µg/dl)
Mean
S.D
Mild to moderate anaemia
IDA 50.11 92.19 11
β-TT 131.03 130.36 3
[image:59.612.160.457.562.700.2]DISTRIBUTION OF TIBC INIDA & β-TT
Mean TIBC varied significantly between IDA, β-TT. When t-test was
applied (t=3.115; P<0.01) the mean TIBC in IDA patients were 424.87µg/dl
[image:60.612.160.451.232.383.2]whereas for β-TT 322.42 µg/dl.
Table-36: Distribution of TIBC in IDA & β-TT
Anaemia TIBC(µg/dl)Mean S.D
Mild to moderate
anaemia
IDA 424.87 52.65 11
β-TT 322.42 37.97 3
Total 402.92 65.25 14
DISTRIBUTION OF SERUM FERRITIN IN IDA & β-TT
Mean serum ferritin varied significantly between IDA, β-TT. When t-test
was applied (t= 22.800; P<0.01) the mean serum ferritin in IDA patients
were 12.51 ng/dl whereas for β-TT 206.63 ng/dl
Table-37: Distribution of Serum Ferritin in IDA & β-TT
Anaemia Ferritin (ng/dl) Mean S.D
Mild to moderate
anaemia
IDA 12.51 8.01 11
Β-TT 206.63 26.54 3
[image:60.612.154.459.573.706.2]DISCUSSION
The current study mainly focused on the utility of serum iron profile,
hemoglobin electrophoresis and peripheral smear in microcytic hypochromic
anaemia. This study also attempted to elucidate the diagnostic accuracy of
seven indices to discriminate mild to moderate Iron deficiency from
β - Thalassemia.
AGE, SEX INCIDENCE & SEVERITY OF ANAEMIA
:The present study included patients between the age group of 1- 12 years.
Two thirds of anaemic children were between the age of 5 & 12 years. This
could be attributed to the increasing nutritional demands of growth spurt and
puberty compounded by less attention to nutrition, amidst demanding academic
pressures.
In the present study, girls with microcytic hypochromic anaemia out number
the boys. This female preponderance could be due to less care of the girl child
in Indian settings. Distribution of Hb, RBC, HCT, MCV, MCH, MCHC, RDW
do not vary significantly in both sexes.
Mild anaemia (Hb10- 12 g /dl) was present in 26 cases (11.4%),
moderate anaemia (Hb 8 -9.9g/dl) in 13 cases (29.5%) and severe anaemia (Hb
PREVALENCE OF IDA:
A study conducted by Mohemmed et al. in the 2006 & Looker et al.(37) in
1997, found that IDA is most prevalent in children.
This finding correlates with the present study where 72.73% of microcytic
hypocromic anaemia was found to be due to Iron deficiency.
[β-Thalassemia trait; 6.82%, β-Thalassemia major; 6.882% & anaemia of
chronic disease; 13.64%].
This is an expected observation as early childhood represents a period of
rapid growth and depletion of blood iron. (Looker et al.37). On the other hand,
adolescent girls are also more susceptible to iron deficiency because of poor
dietary intake in conjunction with high iron requirements related to rapid
growth and menstrual blood loss. This study reflects similar findings probably
due to the same factors.
VALUE OF RED CELL INDICES IN DIFFERENTIATING
BETWEEN
Β
ETA-TT & IDA:
Mean haemoglobin varied significantly between IDA, β-TT. The mean
Hemoglobin in IDA patient was 8.99g/dL whereas for β-TT 10.57g/dL. Mean
MCV varied significantly between IDA, β-TT, mean MCV in IDA patient was
MCV is known to be significantly low in β-Thalassemia as compared to
Iron deficiency anaemia. Mean MCH does not vary significantly between IDA,
β-TT, mean MCH in IDA patient was 20.79 pg whereas for β-TT 17.04 pg.
Mean MCHC does not vary significantly between IDA, β-TT, mean MCHC in
IDA patient was 23.83g/dl whereas for β-TT 27.52 g/dl.
RED CELL INDICES AND ITS USES:
A study conducted by M.A.Ehani et al.38 included 284 patients aged
(range 10 – 38 years), this study utilized 4 indices including England and Fraser
Index , Mentzer Index, Srivastava index & RBC count to discriminate 130 cases
of IDA & 154 cases of b TT. Youden's index provides an appropriate measure
of validity of a particular technique or question by taking into account both
sensitivity and specificity 33,34, and was first used by Demir et al.38 Youdens
index was calculated, showed MI (90.1) to be superior to Srivastava index
Table-38:
Following table shows sensitivity, specificity & Youden’s
index calculated by
Ehani et al.
38Indices Sensitivity (%) Specificity (%) Youden’s index
England &Fraser Index
IDA
B –TT
99.2
69.5
69.5
99.2 68.7 Mentzer Index IDA B-TT 94.6 95.5 95.5 94.6 90.1 Srivastava index IDA B-TT 88.5 85.7 85.7 88.5 74.2 RBC count IDA B= TT 86.2 98.1 98.1 86.2 84.3
According to another study conducted by Damier et al.38 sample size included
was 63, best two indices were RBC count & RDWI. Youden’s index calculated
A study conducted by Ntaios et al.40 (2007), sample size included were 493, it
was concluded that best two indices was Green and King, England and Fraser
index, Youden’s index calculated was 70.9 , 63.2 respectively.
A study conducted in the year 2007 by Beyan et al.41 included a sample size of
111; it was concluded that best two indices were RBC count & Green and king
indices, Youden’s index calculated was 73.7& 65.5 respectively.
A study conducted in the year 2008 by Sirdah et al42 included a sample size of
2196; it was concluded that best two indices were Green and king indices, Red
cell distribution width index, Youden’s index calculated was 68.6 & 68.4
respectively.
Another study conducted by Urrechaga et al (2008)43, sample size included
were 318, they come to a conclusion that best indices was Green and King,
Table-39
: Youden’s index in various studies:
References Sample size Best indices Youden’ index
Damier et al.
(2002) 63
RBC count
RDWI
82
80
Ntaios et
al.(2007) 493
Green & king
England & Fraser
70.9
63.2
Beyan et al.
(2007) 111
RBC count
Green & King
73.7
65.5
Sirdah et
al.(2008) 2196
Green &King
RDWI
68.6
68.4
Urrechaga et al.
(2008) 318 Green & King 80.9
Ehani et al. 284 Mentzer 90.1
The S&L index was first defined by Shine and Lal in 1977 and was reported to
have a sensitivity of 100%, a specificity of 11.8%and an efficiency value of
Yeo et al.44. found the S&L index and mean cell volume (MCV) to be
applicable when applied to pregnant women in Singapore.
Lafferty et al.45found the S&L index, MI and MCV to be valuable in
distinguishing IDA and β-TT minor cases; the RDW and the E&F indices were
not useful.
In studies including schoolchildren in Jordan, MI, MCV ≤72 fl, and E&F and
S&L indices correctly identified 91.6%, 82.4%, 81.3% and 62.6%, respectively,
of microcytosis cases as having or not having the β-TT trait12.
AlFadhli et al.46 found the E&F index to be the most discriminatory and the
S&L index the least when comparing patients with IDA to those with β-TT or
TT minor.
A study conducted by Okan et al.47 found the S&L and G&K indices to be
best at differentiating IDA from β-TT patients, and the RDW index to be the
worst. In particular, the S&L index had the highest Youden index value in
discriminating β-TT cases from those with moderate-to-severe IDA and also
Table-40: Following table shows sensitivity, specificity, positive predictive
value, negative predictive value & Youden’s index calculated in Okans et al
study
Indices Sensitivity (%)
Specificity (%)
PPV (%) NPV (%)
Youden’s index Red blood cell count
IDA B TT 75 86 86 75 84.2 77.4 77.4 84.2 61
Red cell distribution width IDA b- TT 98 6 6 98 51 75 75 51 4 Mentzer index IDA B-TT 78 82 82 78 81.2 78.8 78.8 81.2 60
Shine and Lal index IDA b-TT 100 91 91 100 91.7 100 100 91.7 91
England & Fraser index IDA B –TT 97 78 78 97 81.5 96.2 96.2 81.5 75 Srivastava index IDA b- TT 79 74 74 79 75.2 77.8 77.8 75.2 53
Table-41: Following table shows sensitivity, specificity, Positive predictive
value, negative predictive value found in the present study:
Indices Anaemia Sensitivity Specificity PPV NPV Y.I
Mentzer index
IDA 100.0 100.0 100.0 100.0 100.0
B-TT 100.0 100.0 100.0 100.0
Shine and Lal Index IDA 9.1 100.0 100.0 23.1 9.1 B-TT 100.0 9.1 23.1 100.0
England Fraser Index
IDA 100.0 100.0 100.0 100.0 100.0
B-TT 100.0 100.0 100.0 100.0
Srivasthava index
IDA 100.0 100.0 100.0 100.0 100.0 B-TT 100.0 100.0 100.0 100.0
Green & king index IDA 100.0 100.0 100.0 100.0 100.0 B-TT 100.0 100.0 100.0 100.0
RBC Distribution width index
IDA 100.0 33.3 84.6 100.0 33.3
B-TT 33.3 100.0 100.0 84.6
Ricerca index
IDA 100.0 0.0 78.6 0.0 0.0 B-TT 0.0 100.0 0.0 78.6
Compared to the previous study, present study showed 100% sensitivity,
specificity in 4 indices. This could be due to the small sample size in the present
The present study found that, to differentiate mild to moderate
IDA ( Hb 8.5 – 11 g/dl) from β-TT Mentzer index, England and Fraser
index, Srivastava index & Green and king index had highest specificity as
well as Youden’s index. However RBC distribution width index was found
to have reasonable specificity and sensitivity when compared to Shine and
[image:70.612.87.551.349.599.2]lal index & Ricerca index.
Table- 42:
Hematological parameter
Parameter Ehana et al. Present study
IDA B-TT IDA b-TT
Hb (g/dl) 9.3(+/-)1.89
11.24(+/-)
1.37 8.99(+/-)0.81
10.57(+/-) 0.23
MCV (fl) 70.04(+/-) 7.94
62.02 (+/-) 4.57
68.45(+/-) 9.20
38.91(+/-) 0.16
MCH (pg/cell) 21.30 (+/-) 3.52 19.68 (+/-) 1.53 20.79(+/-) 3.24 17.04(+/-) 0.8
MCHC (g/dl) 29.88(+/-) 2.86 30.93(+/-) 1.71 23.83(+/-) 4.49 27.52(+/-) o.54
A study conducted by Ehana et al.38 found that MCHC was low in Iron
deficiency anaemia, whereas MCV, MCH were low in Thalassemia & MCHC
SUMMARY AND CONCLUSION
• In the present study of 44 children with microcytic hypochromic
anaemia 12 were in 1-4 year age group (27.3%), 16 were in 5-8 year
age group (36.4%) & 16 were in 9-12year age group (36.4 %).
• Out of 44 patients studied, 56.8% were girls, 43.2% were boys.
• Mild anaemia was observed in 11.4% of children; moderate anaemia
was observed in 29.5 % of children, severe anaemia was observed in
59.1% of cases.
• Out of 44 cases, IDA constituted 72.73%, β-Thalassemia trait
constituted 6.82%, β-Thalassemia major constituted 6.882% &
Anaemia of chronic disease constituted 13.64%.
• Following median values were obtained:
For IDA- RBC count- 2.58million/mm3, Hemoglobin- 5.85g/dl,
MCH- 19.2 pg, MCHC- 22.45g/dl, RDW- 50.4 fl, S.Iron- 22µg/dl, Serum
• β Thalassemia trait: -
RBC count 5.36 million/mm3, MCV-62.1fl, MCH- 20.6 pg,
MCHC-22.1g/dl, S.Iron-199.8µg/dl, Serum Ferritin-307.3ng/dl & TIBC-
267.1µg/dl.
• Mean haemoglobin, MCV, MCH, RDW were lower in boys. Mean
RBC, MCHC, HCT were higher in girls. Mean Serum Iron & Ferritin
were low and TIBC was high in girls.
• Out of 44 cases, 14 with mild to moderate anaemia caused clinical
confusion between Iron deficiency anaemia and β-Thalassemia trait.
After doing Iron profiles and electrophoresis 11 were concluded as
Iron deficiency anaemia, and 3 were concluded as β-Thalassemia trait.
• In remaining 30 cases, 3 turned out to β-Thalassemia major and 6
were found to be anaemia of chronic disease.
• In 6 children with anaemia of chronic disease, 3 were suffering from
pneumonia, other two were suffering from urinary tract infection and
• MCV was found to be lower in β-Thalassemia Trait than in IDA,
which could have a useful application in differentiating these two
conditions.
• 7 indices were used to differentiate mild to moderate Iron deficiency
anaemia and β-Thalassemia trait. For differentiating these two entities,
Youdens index showed that Mentzer index, England and Fraser index,
Srivastava index & Green and King index were equally superior to
RBC Distribution width index, Shine and lal index & Ricerca index in
that order.
• In microcytic hypochromic anaemia peripheral smear, red cell indices,
Serum Iron profile including Serum Iron, TIBC, Serum Ferritin and
Haemoglobin electrophoresis were found to be useful parameters in
the precise assessment of anaemia and its type.
• Hb Electrophoresis, Serum Iron profile & Red cell indices are
BIBLIOGRAPHY
1. Wharton BA. Iron deficiency in children: detection and prevention.
Br J Haematol 1999; 106: 270−80.
2. Lukens JN. The thalassemias and related disorders: an overview. In: Lee
GR, et al., editors. Wintrobe’s Clinical Hematology. 10th ed. Giza: Mass
Publishing, 1999: 405-33.
3. Adamsky K, Weizer O, Amariglio N, et al. Decreased hepcidin mRNA
expression in thalassemic mice. British Journal of Haematology.
2004;124(1):123–124.
4. Breda L, Gardenghi S, Guy E, et al. Exploring the role of hepcidin, an
antimicrobial and iron regulatory peptide, in increased iron absorption in
β-thalassemia. Annals of the New York Academy of Sciences. 2005;1054:
417–422.
5. Gardenghi S, Marongiu MF, Ramos P, et al. Ineffective erythropoiesis in
β-thalassemia is characterized by increased iron absorption mediated by
down-regulation of hepcidin and up-regulation of ferroportin.
Blood. 2007; 109(11):5027–5035.
6. Kattamis A, Papassotiriou I, Palaiologou D, et al. The effects of
erythropoetic activity and iron burden on hepcidin expression in patients
7. Dunn LL, Rahamanto YS, Richardson DR. Iron uptake andmetabolism in
the new millennium. Trends Cell Biol. 2007; 17(2):93–100.
8. Fredriksson A, Schroder N, Eriksson P, Izquierdo I, Archer T. Maze
learning and motor activity deficits in adult mice induced by iron exposure
during a critical postnatal period. Brain Res Dev Brain Res.
2000;119(1):65–74.
9. Pin˜ ero DJ, Li NQ, Connor JR, Beard JL. Variations in dietary.
10. Lozoff B, Beard J, Connor J, Barbara F, Georgieff M, Schallert T. Long
lasting neural and behavioural effect of iron deficiency in infancy. Nutr
Rev. 2006;64(5 pt 2):S34–S41.
11. Shafir T, Angulo-Barroso R, Jing Y, Angelilli ML, Jacobson SW, Lozoff
B. Iron deficiency and infant motor development. EarlHum Dev.
2008;84(7):479–485.
12. Miho maeda, Yoshitaka Fukunaga, two children with thalassemia
identified during screening for anaemia in junior High school: J Nippon
med sch 2004 ; 71 (4).
13. Stefan D Anker and Stephen von Haeling: anaemia in chronic heart
failure. First edition, Unimed 2009, 27