JOURNAL OFVIROLOGY,
0022-538X/99/$04.0010 May 1999, p. 3764–3777 Vol. 73, No. 5
Copyright © 1999, American Society for Microbiology. All Rights Reserved.
Host-Specific Modulation of the Selective Constraints
Driving Human Immunodeficiency Virus
Type 1 env Gene Evolution
PATRIZIA BAGNARELLI,1* FRANCESCA MAZZOLA,1STEFANO MENZO,1 MARIA MONTRONI,2LUCA BUTINI,2ANDMASSIMO CLEMENTI3
Institute of Microbiology1and Laboratory of Clinical Immunology, Institute of Internal Medicine,2 University of Ancona, Ancona, and Department of Biomedical Sciences,
University of Trieste, Trieste,3Italy
Received 17 September 1998/Accepted 19 January 1999
To address the evolution of human immunodeficiency virus type 1 (HIV-1) within a single host, we analyzed the HIV-1 C2-V5 env regions of both cell-free genomic-RNA- and proviral-DNA-derived clones. Sequential samples were collected over a period of 3 years from six untreated subjects (three typical progressors [TPs] and three slow progressors [SPs], all with a comparable length of infection except one. The evolutionary analysis of the C2-V5 env sequences performed on 506 molecular clones (253 RNA- and 253 DNA-derived sequences) highlighted a series of differences between TPs and SPs. In particular, (i) clonal sequences from SPs (DNA and
RNA) showed lower nucleotide similarity than those from TPs (P50.0001), (ii) DNA clones from SPs showed
higher intra- and intersample nucleotide divergence than those from TPs (P < 0.05), (iii) higher host-selective pressure was generally detectable in SPs (DNA and RNA sequences), and (iv) the increase in the genetic distance of DNA and RNA sequences over time was paralleled by an increase in both synonymous (Ks) and nonsynonymous (Ka) substitutions in TPs but only in nonsynonymous substitutions in SPs. Several individual peculiarities of the HIV-1 evolutionary dynamics emerged when the V3, V4, and V5 env regions of both TPs and SPs were evaluated separately. These peculiarities, probably reflecting host-specific features of selective constraints and their continuous modulation, are documented by the dynamics of Ka/Ks ratios of hypervari-able env domains.
Infections with retroviruses are characterized by different (moderate to high) levels of intrahost viral genetic variation. This viral variability is dependent upon mutation, recombina-tion, degree of viral replicarecombina-tion, and the host’s selective pres-sure (including immune responses and target cell range) (9, 21, 43, 44, 45, 48). In human immunodeficiency virus type 1 (HIV-1) infection, the viral population is represented by re-lated, nonidentical genetic variants (11, 16, 17, 36). The error-prone nature of the HIV-1 reverse transcriptase (RT) (3–5, 54) and the absence of a 39-exonuclease proofreading activity de-termine in vitro about 331025mutations per nucleotide per replication cycle (32). Although the mutation rate observed in vivo is lower than that predicted from the fidelity of purified RT (since a number of newly generated variants are unable to replicate or are cleared by the host’s immune system) (32), the viral replication dynamics (18, 50) and the host’s selective forces determine a continuous process of intrahost HIV-1 evo-lution (8, 20, 31, 33, 39, 42, 51).
A growing body of molecular studies has addressed the role of HIV-1 variability and its influence on virus-host relation-ships. Early reports have indicated that virus diversity increases with time during the infection (41). Subsequently, a compara-tive study on HIV-1-infected subjects with different patterns of disease progression has shown that virus diversity is directly associated with prolonged survival of patients and is inversely correlated with CD41-T-cell decline (51). Recent research has
addressed the questions of (i) whether different intrasubject HIV-1 evolution rates reflect differences in host-mediated se-lective forces and (ii) whether specific patterns of viral genetic evolution are associated with differences in disease progres-sion. In this context, studies of the complexity of proviral HIV-1 sequences in peripheral blood mononuclear cells (PB-MCs) have documented in both infected adults and infants lower genetic diversity of HIV-1 env variants in samples from rapid progressors than in patients exhibiting slow CD41-T-cell
decline (8, 14, 19). More recently, we have described rare V3 variants in cell-free replicating virus from nonprogressor indi-viduals, the probable consequence of sustained pressure by strong selective constraints (35). Overall, the data currently suggest that viral genetic variability is the molecular counter-part of a continuous dynamic interplay between viral factors (i.e., HIV-1 replication dynamics and the generation of vari-ants by mutation and recombination) and host factors (i.e., selective pressure) (42, 45). In this context, intrahost evolution of HIV-1 populations may be compatible with a Darwinian model system, as recently suggested (14, 51).
The complete elucidation of the mechanisms of intrahost HIV-1 evolution is of crucial importance for understanding the natural history of this infection and developing effective anti-HIV-1 strategies. Although viral evolution in primary anti-HIV-1 infection has been described (23, 56) and the intervention of the host’s selective forces in driving this evolution has clearly been documented (51, 55), several questions on the biological and pathogenic role of HIV-1 variability remain unanswered. First, in the light of the evidence that the levels of selective constraints for HIV-1 evolution are host dependent (55), it is of crucial importance to clarify type, nature, dynamics, and biopathological role of the individual features of the host’s * Corresponding author. Mailing address: Institute of Microbiology,
University of Ancona, Via Pietro Ranieri, I-60100 Ancona, Italy. Phone: 39-71-5964849. Fax: 39-71-5964852. E-mail: bagnarelli@popcsi .unian.it.
3764
on November 9, 2019 by guest
http://jvi.asm.org/
selective forces. Second, due to the complex functional role of different gp120 regions in viral entry (52), it is important to evaluate comparatively the dynamic features of the host’s se-lective forces which are active on these regions. In the present study, we addressed intrahost HIV-1 evolution (of both repli-cating [cell-free] virus and proviral DNA) in sequential sam-ples collected over a period of 3 years from six symptomless, untreated, HIV-1-infected subjects (five of whom had compa-rable periods of infection) with different immunological pro-gressions. Our principal aims were (i) to gain insights into the dynamic features of the different evolutionary parameters within infected hosts, (ii) to evaluate the correlation between these parameters and the pattern of infection progression, and (iii) to evaluate comparatively the levels of selective forces on different HIV-1 env hypervariable domains.
MATERIALS AND METHODS
Patients.Six untreated, HIV-1-infected asymptomatic subjects (four males and two females) were selected for this study on the basis of the slope of their CD41-T-cell counts. Three of them (subjects A to C) were typical progressors
(TPs), showing gradual decline of CD41T cells over time (loss of circulating
CD41T cells per year: subject A, 128; subject B, 87; and subject C, 153; mean
loss of subjects A to C, 125 cells/year), and three were slow progressors (SPs; subjects D to F), showing CD41-T-cell levels constantly higher than 600 perml
and a mean loss of 14 cells per year (subject D, 31; subject E, 24; and subject F, 2). The risk factor for all subjects was intravenous drug use, although subject E was the sexual partner of subject B. In the absence of documented seroconver-sion or a previous negative test for anti-HIV-1 antibodies, the beginning of the infection was dated at the first positive serologic test. Five subjects had compa-rable periods of infection (average, 7.9 years; range, 7.0 to 10.5 years); the first sample of subject A was closer to the time of seroconversion (1 year; see below). All subjects had a similar age (mean, 30.5 years; range, 27 to 33 years, at the time the first sample was obtained).
Clinical samples and purification of nucleic acids.Peripheral venous blood was collected on EDTA. Plasma was prepared by centrifugation at 3,0003g for 10 min at 4°C and stored at280°C until further analysis. PBMCs were recovered after centrifugation over Ficoll-Hypaque density gradient, washed twice in phos-phate-buffered saline, and resuspended in 10% dimethyl sulfoxide and 90% fetal calf serum for cryopreservation in liquid nitrogen until further testing. Sequential samples of cryopreserved PBMCs and parallel plasma samples were available for patient A at 1, 3, and 4 years of infection; for patient B at 7, 9, and 11 years of infection; for patient C at 6.5, 7.5, and 8.5 years of infection; for patient D at 8, 9, and 10 years of infection; for patient E at 7.5, 8.5, and 10 years of infection; and for patient F at 10.5, 11.5, and 12.5 years of infection. The serial time points are indicated, for each subject, by numbers from I to III. Isolation of RNA and DNA (from plasma and PBMC samples, respectively) was performed as previously described (1).
Quantitation of cell-free and cell-associated HIV-1-specific nucleic acids. Plasma viremia, cell-associated proviral DNA, and HIV-1 transcripts in PBMCs (both unspliced and multiply spliced) were quantified by competitive PCR and competitive RT-PCR, as described elsewhere (1, 2, 34).
Oligonucleotide primers.Oligonucleotides were synthesized in our laboratory by using an Oligo 1000 synthesizer (Beckman, Palo Alto, Calif.) with the phos-phoramidite chemistry. The positions (pNL4-3 numbering system) of the V31 and V52 primers used for amplification of the HIV-1 env C2-V5 sequence were as follows: V31, nucleotides 6939 to 6966; and V52, nucleotides 7803 to 7778. The positions of the internal sequencing primers V32 and V41 were as follows: V32, nucleotides 7367 to 7340; and V41, nucleotides 7304 to 7326.
Amplification, cloning, and sequencing procedures.The reverse transcription of HIV-1 RNA present in plasma was performed with primer V52 (25 pmol) and 200 U of SuperScript II RNase H-RT (Bethesda Research Laboratories, Gaith-ersburg, Md.) at 37°C for 30 min in a final volume of 20ml in the presence of 3.0 mM MgCl2, 75 mM KCl, 50 mM Tris (pH 8.3), 10 mM dithiothreitol, 0.5 mM concentrations of each deoxynucleosidetriphosphate (dNTP), and 20 U of recombinant RNasin RNase inhibitor (Promega Corp., Madison, Wis.). An amount of cDNA equivalent to 100ml of plasma and DNA equivalent to 23105 PBMCs were used for PCR amplification in 13buffer (1.5 mM MgCl2, 50 mM KCl, 10 mM Tris [pH 8.8], 0.01% Triton X-100) containing 0.2 mM concentra-tions of each dNTP, 50 pmol of each V52 and V31 primers, and 2 U of Dynazyme II DNA polymerase (Finnzymes Oy, Espoo, Finland) in a final volume of 100ml. Tubes were loaded on a GeneAmp PCR System 9600 (Perkin-Elmer, Norwalk, Conn.). After denaturation (2 min at 95°C), the amplification profile (denatur-ation at 95°C for 15 s, annealing at 60°C for 15 s, and extension at 72°C for 1 min) was repeated for 50 cycles, followed by a final extension at 72°C for 10 min. In order to avoid cross-contamination, only one sample at a time was processed, and HIV-1 negative samples were included in each set of sample preparation. Ex-traction mixtures and amplification buffers were tested along with the
above-mentioned controls in each set of amplification reaction; clinical samples were amplified in duplicate.
Before molecular cloning, a 10-ml aliquot of the amplified product was run on a 10% polyacrylamide gel electrophoresis to screen for the appropriate-sized band (ca. 865 bp); the remaining 90ml was resolved by electrophoresis on a 1.5% low-melting-point agarose gel (SeaPlaque; FMC BioProducts, Rockland, Maine) in TAE buffer (Tris-acetate, 1 mM EDTA). The correct DNA fragment was excised from the gel, purified by the QIAquick DNA Clean-Up system (Qiagen GmbH, Hiden, Germany) according to the manufacturer’s protocol for recov-ering DNA from low-melting-point agarose gels, and eluted in water. The puri-fied product was cloned into pGEM-T vector (Promega) according to the man-ufacturer’s instructions. Single colonies were picked up, spread to a new agar plate, and allowed to grow overnight at 37°C. Clones bearing the insert were identified by PCR; briefly, single colonies from each subculture were touched with a tip and immediately rinsed in the 13PCR buffer containing 25 pmol of each V31 and V52 primer, 0.2 mM concentrations of each dNTP, and 2 U of Dynazyme DNA polymerase in a final volume of 50ml. In order to achieve bacterial lysis, initial denaturation at 95°C for 10 min preceded PCR amplifica-tion; subsequently, the same amplification profile described above was repeated for 35 cycles. Four to five reagent controls were run in parallel to check for contamination. Finally, an aliquot (10ml) of the reaction was run on a 10% polyacrylamide gel to screen for positive clones.
To sequence the cloned inserts, amplified products from 8 to 17 clones per clinical sample (either proviral-DNA- or genomic-RNA-derived clones) were sequenced directly. The double-stranded DNA was sequenced in both forward and reverse directions with primers V31 and V52, spanning a region from amino acids 240 to 528 (with Env signal peptide in pNL4-3 map as the starting amino acid) that includes part of the C2 conserved region; the V3, V4, and V5 hyper-variable domains; the T4 binding domain; and the gp120-gp41 cleavage domain. The V32 reverse primer and the V41 forward primer were coupled with V31 and V52, respectively, as internal sequencing primers. DNA sequencing was per-formed by using the ABI PRISM Dye terminators cycle sequencing ready reac-tion kit (Perkin-Elmer) according to the manufacturer’s instrucreac-tions. Sequencing reactions were resolved by electrophoresis on a 5% polyacrylamide gel in an AB373 automated sequencer (Perkin-Elmer). The rate of misincorporation due to the procedure described above was evaluated on pNL4-3 after PCR, cloning, and sequencing of 17 subcultures: overall, we observed nine point mutations (mostly transitions) over a total of 14,705 sequenced bases, corresponding to 1 misincorporation per 1,634 bases.
Sequence analysis.Sequence editing and assembling were performed by using the Sequence Navigator program (Perkin-Elmer) included in the AB373 soft-ware package. All alignments of both nucleotide and amino acid sequences were performed with the CLUSTAL W 1.7 program. All positions with an alignment gap in at least one sequence were excluded from pairwise comparisons. Simple sequence similarity comparisons were performed by using the Megalign program (DNAstar, Inc., Madison, Wis.). Phylogenetic reconstructions were generated by using programs from version 3.572 of the Phylogeny Inference Package (PHYLIP) (12). The DNADIST (with Kimura’s two-parameters method and a transition/transversion ratio of 2.5) and the DNAPROT (with Kimura’s formula) programs (24) were applied to generate a pairwise matrix of evolutionary dis-tances of nucleotide and amino acid sequences, respectively. Phylogenetic trees were constructed from the same distance matrices with the NEIGHBOR pro-gram (neighbor-joining algorithm). Bootstrap analysis was performed with SEQBOOT (100 resamplings), followed by DNADIST or DNAPROT, NEIGH-BOR, and CONSENSE programs. The B-clade consensus sequence, defined as the most common amino acid in a given position, was used as an outgroup. Intrasample and intersample sequence variations were expressed as the mean distance for all pairwise comparisons between sequences within a sample or from two different samples, respectively. Rates of synonymous nucleotide substitutions per synonymous site (Ks) and antonymous substitutions per antonymous site (Ka) were estimated by the method of Nei and Gojobori (39) by using the Jukes-Cantor correction for multiple substitutions, as implemented in the MEGA program package (version 1.02, 1993).
Statistical analysis.All of the analyses were performed with StatView version 4.5 (Abacus Concepts, Berkeley, Calif.). The unpaired t test was used to compare group means. The Friedman test was used to analyze variations of virological and evolutionary parameters with time. Two-way analysis of variance (ANOVA table for two-factor repeated measures) was used to compare group means for evo-lutionary parameters at the different time points.
Nucleotide sequence accession numbers.The sequences described here have been submitted to the GenBank and assigned accession no. AF105432 to AF105680 (proviral-DNA-derived sequences) and AF105717 to AF105961 (cell-free genomic-RNA-derived sequences).
RESULTS
Virological monitoring of the six HIV-1 infected subjects.
Different parameters of HIV-1 activity (plasma viremia, un-spliced and multiply un-spliced HIV-1 transcripts in PBMCs, and proviral DNA molecules) were monitored in the same samples
on November 9, 2019 by guest
http://jvi.asm.org/
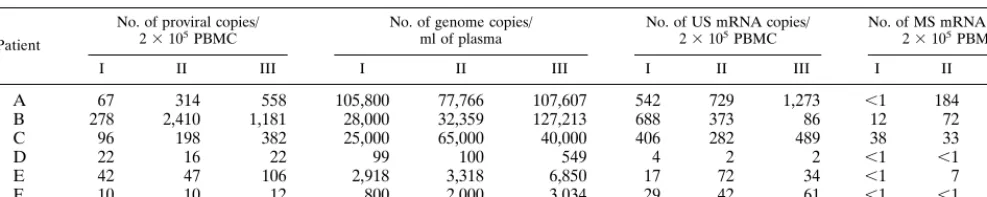
used for molecular sequencing by quantitative assays (compet-itive PCR and compet(compet-itive RT-PCR). These results are sum-marized in Table 1. All of these parameters were generally higher in TPs than in SPs. In the period under study, no significant variation was observed in the two groups for all of the virological indexes analyzed (Friedman test; P.0.05).
HIV-1 env C2-V5 sequences of cell-free genomic RNA in plasma and proviral DNA in PBMCs from six symptomless
subjects. The nucleotide sequences of the HIV-1 env C2-V5
region of both cell-free virus in plasma and proviral DNA in PBMCs were obtained after purification of nucleic acids, am-plification, cloning, and sequencing of a set of three serial samples from each subject. Sampling spanned a period of 2.0 to 3.5 years, and 536 viral sequences were analyzed on the whole. Potentially inactivating mutations were observed in 30 molecular clones from all subjects, in both DNA- and RNA-derived sequences. In particular, in subjects A to C, 12 clones showed inactivating mutations (three frameshifts and three in-frame stop codons in DNA-derived clones and two frame-shifts and four in-frame stop codons in RNA-derived clones), of which 1 was revealed in C2, 1 in V3, 1 in C3, 5 in V4, 1 in C4, and 3 in V5. In sequences from subjects D to F, 18 inac-tivating mutations were observed, 14 of which involved DNA-derived clones (six frameshifts and eight in-frame stop
co-dons), while two frameshifts and two in-frame stop codons were observed in RNA-derived sequences; 2 of the 18 inacti-vating mutations were observed in C2, 1 in V3, 1 in C3, 5 in V4, 5 in C4, and 4 in the COOH-terminal domain, upstream the gp120-gp41 cleavage site. The coding potential of the C2-V5 open reading frame was maintained in 506 molecular clones (253 derived from plasma RNA and 253 from proviral DNA), 494 of which were unique HIV-1 nucleotide sequences. The numbers of molecular clones for each subject were as follows: subject A, 85; subject B, 89; subject C, 83; subject D, 83; subject E, 85; and subject F, 81. To determine the evolutionary rela-tionships among these viral variants, the nucleotide sequences were subjected to phylogenetic analysis by feeding the Kimura two-parameter distance matrix into the neighbor-joining tree. Figure 1 shows that sequences from each patient (both DNA-and RNA-derived clones) formed a monophyletic group which was supported by bootstrap analysis. Furthermore, sequences of each subject clustered close to the HIV-1 MN strain used as a representative of clade-B sequences of the M group. The pattern of intersubject viral evolution is consistent with a star phylogeny, as the branch lengths separating the different clus-ters were very similar; the pattern of intrasubject viral evolu-tion indicates that sequences are not clearly discriminated in subtrees in any subject, except for the RNA clones from
[image:3.612.58.552.84.182.2]sub-FIG. 1. Phylogenetic trees of HIV-1 env C2-V5 DNA and RNA nucleotide sequences. Phylogenetic analysis of all viral sequences (253 from proviral DNA and 253 from plasma RNA) was performed by feeding the Kimura two-parameter distance matrix into the neighbor-joining tree. Distinct clusters of viral sequences corresponding to each subject were found, indicating the absence of cross-contamination. The HIV-1 MN strain was used as prototype of clade-B env sequences. Branch lengths are drawn to scale. Bootstrap proportions are shown in the appropriate branch point.
TABLE 1. Molecular parameters of viral activitya
Patient
No. of proviral copies/
23105PBMC No. of genome copies/ml of plasma No. of US mRNA copies/23105PBMC No. of MS mRNA copies/23105PBMC
I II III I II III I II III I II III
A 67 314 558 105,800 77,766 107,607 542 729 1,273 ,1 184 175
B 278 2,410 1,181 28,000 32,359 127,213 688 373 86 12 72 1
C 96 198 382 25,000 65,000 40,000 406 282 489 38 33 85
D 22 16 22 99 100 549 4 2 2 ,1 ,1 ,1
E 42 47 106 2,918 3,318 6,850 17 72 34 ,1 7 31
F 10 10 12 800 2,000 3,034 29 42 61 ,1 ,1 ,1
aSerial time points are given. Patients A to C, TPs; patients D to F, SPs. Roman numerals refer to individual samples. US, unspliced HIV-1 transcripts; MS, multiply
spliced HIV-1 transcripts.
3766 BAGNARELLI ET AL. J. VIROL.
on November 9, 2019 by guest
http://jvi.asm.org/
[image:3.612.111.493.490.691.2]ject D and both the DNA and the RNA clones from subject B, whose relevant characteristics are discussed below. Finally, the average branch lengths of SPs (subjects D to F) were similar to those of TPs (subjects A to C).
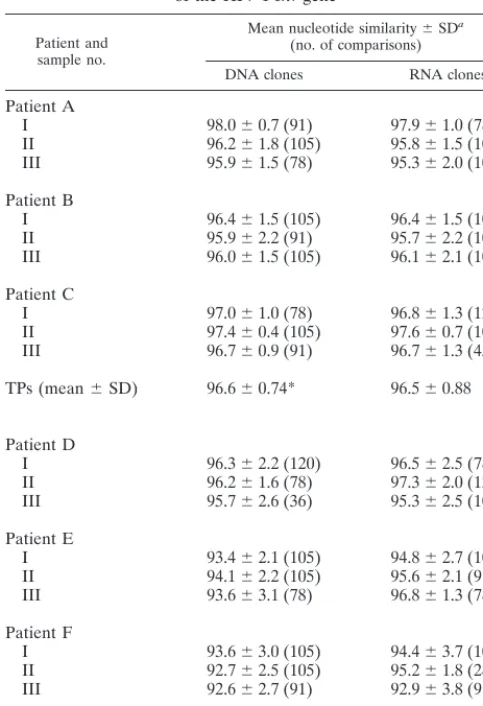
Intrahost nucleotide sequence similarity of the HIV-1 C2-V5
env sequence. Analysis of HIV-1 sequence similarity of all DNA- and RNA-derived clones (Table 2) documented in TPs a higher intrasample percent similarity (mean value 6 the standard deviation, 96.54 60.79) than in SPs (94.8361.49) (unpaired t test54.294; two-tail P value, 0.0001). A significant difference was also observed when the mean values of all pair-wise comparisons relative to the DNA-derived clones were compared between the two groups (unpaired t test 54.537; two-tail P value, 0.0005). In contrast, the comparison of RNA-derived clones did not reach the significant level of 5% (t test5
1.951; P value, 0.0688). Moreover, the analysis did not reveal any significant difference between DNA and RNA clones in TPs at any time point, and although high sequence heteroge-neity was noted in DNA-derived clones from subjects E and F (Table 2), no difference was found in the SPs between DNA-and RNA-derived clones when evaluating the mean values of all pairwise comparisons relative to each sample (t test 5 21.786; P value, 0.093).
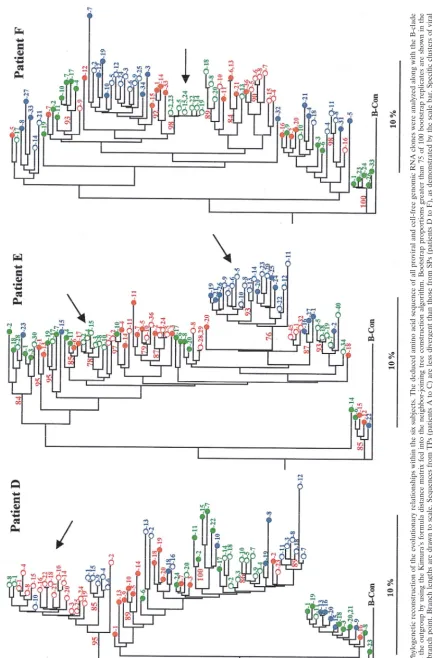
Phylogenetic analysis of viral sequences within the six
HIV-1-infected subjects. To investigate evolutionary relationships
over time, a phylogenetic analysis of C2-V5 HIV-1 env se-quences was performed separately in each patient. The de-duced amino acid sequences of all proviral DNA- and cell-free genomic RNA-derived clones were analyzed, along with the B-clade consensus as the outgroup. The phylogenetic trees (Fig. 2) evidenced branch lengths greater in the viral variants ob-tained from SPs (subjects D to F) than from TPs (subjects A to C). In fact, the mean divergence of all sequences relative to a single subject (calculated by using Kimura’s formula distance matrix) were significantly higher in SPs (subjects D to F, 9.61, 10.07, and 11.26%, respectively) than in TPs (subjects A to C, 7.35, 7.96, and 7.60%, respectively) (unpaired t test, 5.123; P value, 0.0069). When the analysis was performed in each patient within either DNA- or RNA-derived sequences, no difference could be evidenced between the mean divergence of DNA and RNA clones in SPs; by contrast, RNA-derived se-quences diverged more than DNA sese-quences in TPs (unpaired t test, 6.093; P value, 0.0037).
An intermingling of HIV-1 sequences from different points in time and from RNA and DNA clones was evident in all cases. However, clusters of variants characteristic of RNA clones were the predominant form at some time points prin-cipally in SPs (Fig. 2, arrows). The cluster of RNA-derived variants in subject D and the major cluster of RNA and DNA viral sequences relative to the third sample of subject E were characterized by the insertion of a glycosylation site in the V4 sequence (see below); in subject F, a cluster of RNA sequences was observed in the first sample. Additionally, a major cluster of viral sequences (including both RNA and DNA clones) relative to the second and third samples of patient B was characterized by important amino acid changes in the V3 loop (see below).
Analysis of the host’s selective pressure on the C2-V5 env
sequence. In order to evaluate whether and to what extent
nucleotide sequence variability and accumulation rates of syn-onymous and antsyn-onymous substitutions varied with sampling time (both within each subject and between TPs and SPs), the pairwise comparisons of sequences within and between each time point were performed for DNA- and RNA-derived clones. Mean intertime values are given in Table 3. In the absence of a known ancestor sequence, all the sequences of the first sample represented the term of comparison for all the subsequent sequences within each patient. SPs showed higher diversity (mean intratime distance, 3.96 6 0.94 [data not shown]) and evolution rate (mean intertime distance, 4.046
0.91) than TPs (mean intratime distance, 2.78 6 0.49 [not shown]; mean intertime distance, 3.0960.72) when sequences from proviral DNA were analyzed (t test5 3.319; P value, 0.0043; and t test52.456, P value, 0.0259, respectively). Dif-ferences were not significant when cell-free RNA sequences were evaluated. Accumulation of synonymous (Ks) and ant-onymous (Ka) substitutions, and Ka/Ks ratios were analyzed to screen for positive selection for amino acid changes in the C2-V5 sequence. Mean values of Ka, Ks, and Ka/Ks ratio are given in Table 3. The accumulation of antonymous substitu-tions and the Ka/Ks ratios were significantly higher in SPs than in TPs in DNA- or RNA-derived sequences (for DNA clones, Ka t test53.644 and P50.0022 and Ka/Ks t test53.751 and P50.0017; for RNA clones, Ka t test52.282 and P50.0365 and Ka/Ks t test5 3.099 and P 5 0.0069). In contrast, no significant difference between the two groups was observed when the rates of synonymous substitutions were compared, thus indicating that the differences in the Ka/Ks ratios ob-TABLE 2. Nucleotide sequence similarity in the C2-V5 region
of the HIV-1 env gene
Patient and sample no.
Mean nucleotide similarity6SDa (no. of comparisons) DNA clones RNA clones
Patient A
I 98.060.7 (91) 97.961.0 (78)
II 96.261.8 (105) 95.861.5 (105)
III 95.961.5 (78) 95.362.0 (105)
Patient B
I 96.461.5 (105) 96.461.5 (105)
II 95.962.2 (91) 95.762.2 (105)
III 96.061.5 (105) 96.162.1 (105)
Patient C
I 97.061.0 (78) 96.861.3 (120)
II 97.460.4 (105) 97.660.7 (105)
III 96.760.9 (91) 96.761.3 (45)
TPs (mean6SD) 96.660.74* 96.560.88
Patient D
I 96.362.2 (120) 96.562.5 (78)
II 96.261.6 (78) 97.362.0 (136)
III 95.762.6 (36) 95.362.5 (105)
Patient E
I 93.462.1 (105) 94.862.7 (105)
II 94.162.2 (105) 95.662.1 (91)
III 93.663.1 (78) 96.861.3 (78)
Patient F
I 93.663.0 (105) 94.463.7 (105)
II 92.762.5 (105) 95.261.8 (28)
III 92.662.7 (91) 92.963.8 (91)
SPs (mean6SD) 94.261.45* 95.461.35
aMean nucleotide similarity6the standard deviation between all pairwise comparisons of sequences from within each time point (intrasample). A signif-icant difference between the two groups is indicated by an asterisk.
on November 9, 2019 by guest
http://jvi.asm.org/
[image:4.612.53.295.90.443.2]3768 BAGNARELLI ET AL. J. VIROL.
on November 9, 2019 by guest
http://jvi.asm.org/
FIG. 2. Phylogenetic reconstruction of the evolutionary relationships within the six subjects. The deduced amino acid sequence of all proviral and cell-free genomic RNA clones were analyzed along with the B-clade consensus as the outgroup by using the Kimura’s formula distance matrix fed into the neighbor-joining tree construction algorithm. Bootstrap propo rtions greater than 75 of 100 bootstrap replicates are shown in the appropriate branch point. Branch lengths are drawn to scale. Sequences from TPs (patients A to C) are less divergent than those from SPs (patients D to F ), as demonstrated by the scale bar. Specific clusters of viral variants in SPs, which are characteristic of RNA clones, are indicated by arrows. A major cluster of viral variants in patient B (arrow) is characteriz ed by major amino acid changes in the V3 loop. The dif ferent samples are indicated in color: green (first), red (second), and blue (third). The clone number is reported close to the symbols. The plasma-derived sequences ( E ) and provirus-derived sequences ( F ) are indicated.
on November 9, 2019 by guest
http://jvi.asm.org/
[image:6.612.90.524.62.721.2]TABLE 3. Nucleotide sequence variation in the C2-V5 region of HIV-1 env gene
Patient and sample no. (yrs postinfection)
DNA-derived clonesa RNA-derived clonesa
No. sequenced/
no. compared Mean divergence(range) Mean Ka(SE) Mean Ks(SE) Ka/Ks No. sequenced/no. compared Mean divergence(range) Mean Ka(SE) Mean Ks(SE) Ka/Ks
Patient A
I (1) 14 1.69 (0.25–2.67) 1.56 (0.26) 2.14 (0.54) 0.73 13 1.90 (0.13–3.84) 1.96 (0.29) 1.69 (0.46) 1.16
II (3) 15/29 2.72 (0.13–4.54) 2.68 (0.33) 3.02 (0.62) 0.88 15/28 2.97 (0.00–4.93) 3.04 (0.34) 2.67 (0.53) 1.14
III (4) 13/27 2.89 (0.13–4.60) 2.85 (0.34) 3.06 (0.53) 0.93 15/28 3.15 (0.13–5.26) 3.07 (0.35) 3.40 (0.59) 0.90
Patient B
I (7) 15 3.20 (1.16–5.82) 2.51 (0.34) 4.80 (0.89) 0.52 15 2.97 (0.25–4.99) 2.56 (0.37) 4.98 (0.97) 0.51
II (9) 14/29 3.87 (0.51–7.06) 3.11 (0.36) 4.90 (0.75) 0.63 15/30 3.77 (0.25–7.32) 2.91 (0.33) 5.94 (0.96) 0.49
III (11) 15/30 4.02 (1.00–6.92) 3.17 (0.36) 5.31 (0.80) 0.60 15/30 4.87 (0.51–8.37) 3.64 (0.49) 6.80 (1.03) 0.54
Patient C
I (6.5) 13 2.66 (0.76–4.58) 2.41 (0.32) 3.47 (0.73) 0.69 16 2.85 (0.25–4.88) 2.42 (0.33) 4.39 (0.87) 0.55
II (7.5) 15/28 3.09 (0.00–5.70) 2.92 (0.34) 3.56 (0.60) 0.82 15/31 3.62 (0.25–7.23) 3.28 (0.40) 4.81 (0.74) 0.68
III (8.5) 14/27 3.65 (0.76–6.20) 3.39 (0.35) 4.42 (0.64) 0.77 10/26 4.18 (0.13–7.32) 3.75 (0.43) 5.67 (0.85) 0.66
TPs (mean6SD) 3.0960.72* 2.7360.51* 3.8561.06 0.7360.13* 3.3660.86 2.9660.58* 4.4861.64 0.7460.27*
Patient D
I (8) 16 2.83 (0.00–6.15) 2.79 (0.30) 2.62 (0.71) 1.07 13 3.13 (0.38–6.79) 2.98 (0.39) 2.99 (0.69) 1.00
II (9) 13/29 3.06 (0.00–5.87) 3.03 (0.37) 2.70 (0.64) 1.12 17/30 3.96 (0.00–8.40) 3.66 (0.47) 3.17 (0.69) 1.15
III (10) 9/25 2.97 (0.00–6.15) 2.87 (0.38) 3.07 (0.67) 0.93 15/28 4.05 (0.00–7.21) 3.99 (0.45) 3.38 (0.67) 1.18
Patient E
I (7.5) 15 4.08 (0.62–6.45) 4.30 (0.44) 3.18 (0.60) 1.35 15 3.03 (0.25–5.40) 3.49 (0.43) 2.09 (0.52) 1.67
II (8.5) 15/30 4.16 (0.36–7.03) 4.28 (0.38) 3.33 (0.59) 1.29 14/29 3.38 (0.00–6.26) 3.53 (0.37) 2.37 (0.49) 1.49
III (10) 13/28 4.63 (0.12–8.28) 4.92 (0.44) 3.23 (0.57) 1.52 13/28 4.12 (0.25–8.32) 4.58 (0.47) 2.25 (0.44) 2.04
Patient F
I (10.5) 15 4.25 (0.38–7.41) 4.09 (0.50) 4.74 (0.71) 0.86 15 3.81 (0.00–7.64) 3.57 (0.46) 4.94 (0.96) 0.72
II (11.5) 15/30 5.00 (0.00–8.80) 4.57 (0.44) 5.82 (0.78) 0.79 8/23 4.35 (0.00–7.32) 3.78 (0.41) 4.89 (0.85) 0.77
III (12.5) 14/29 5.34 (0.38–8.68) 5.15 (0.46) 5.90 (0.79) 0.87 14/29 5.07 (0.00–9.13) 7.97 (1.18) 6.26 (0.84) 1.27
SPs (mean6SD) 4.0460.91* 4.0060.89* 3.8461.30 1.0960.25* 3.8860.64 4.1761.49* 3.5961.45 1.2560.43*
aMean nucleotide divergence, synonymous and antonymous substitutions (Ka and Ks; expressed as a percentage), and Ka/Ks ratios between all pairwise comparisons of sequences from between (intersample) time points
are given. A significant difference between the two groups is indicated by an asterisk.
3770
BAGNARELLI
ET
AL.
J.
V
IROL
.
served between TPs and SPs substantially depend on differ-ences in Ka values.
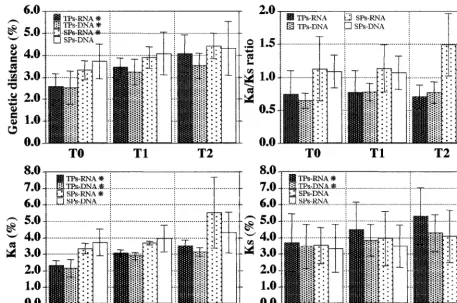
The dynamic features of the host’s selective pressure on the HIV-1 C2-V5 region in TPs and SPs is schematically repre-sented in Figure 3. The intersample mean values of the pa-rameters of viral evolution (shown in Table 3) relative to each group were plotted against time points expressed as categories (T0, T1, and T2). The data obtained from DNA- and RNA-derived sequences were analyzed separately, and each point represents the mean value6the standard deviation of values obtained from the three patients in each group. The rate of increase over time was evaluated by using the Friedman test for repeated measures, and the significant increments at the 5% level are indicated by an asterisk close to the symbol in each graph. Notably, the increase over time of genetic distance observed in both RNA- and DNA-derived clones from TPs was paralleled by a significant increase of both Ks and Ka, while the increase with time of the genetic distance of RNA clones from SPs was substantially dependent on Ka variations. Although the SPs showed higher values for genetic distance, Ka, and the Ka/Ks ratio than the TPs, the differences between groups were not statistically significant (ANOVA table for repeated mea-sures). This could depend on the low number of subjects in-cluded in this study and the wide spread of data within each group.
Modulation of the host’s selective pressure on the
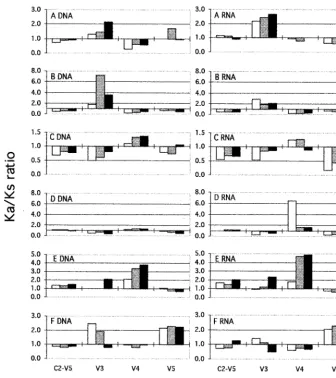
hyper-variable regions V3, V4, and V5 of the HIV-1 env gene.To
assess whether positive selection had been operating differ-ently in the HIV-1 env hypervariable regions during the period under study, the intertime Ka/Ks ratios were evaluated
[image:8.612.73.531.75.378.2]sepa-rately in the V3 (from codon 294 to codon 329, starting from the env signal peptide in the pNL4-3 map), V4 (from codon 383 to codon 416), and V5 (from codon 456 to codon 471) regions. Figure 4 shows the dynamics of selective pressure within each patient on the complete C2-V5 HIV-1 env se-quence and on the three hypervariable regions. All pairwise comparisons of sequences from within the first sample (intra-time) and between each subsequent sample compared with the first (intertime) were performed for both DNA- and RNA-derived clones. The trend over time of Ka/Ks ratios was similar in the DNA- and RNA-derived clones, with few exceptions (Fig. 4, subject B, second V3 time point, and subject D, first V4 time point). As documented above, generally higher Ka/Ks values were observed in the C2-V5 sequences of SPs compared with those of TPs, although a low ratio value (1.0 to 2.0) was generally observed in most samples from SPs (either DNA- or RNA-derived). Interestingly, when single hypervariable se-quences were analyzed, sharp individual differences could be appreciated among all six infected subjects, and higher levels of selective pressures could be documented. In particular, a sus-tained positive selection for the V3 sequence was observed in two TPs (subjects A and B) and only at some time points in two SPs (subjects E and F). By contrast, the V4 region was under positive selection in all of the samples obtained from subjects D and E (both SPs) and at some time points in subject C (a TP). Finally, the V5 region was under positive selective pres-sure in only one SP subject (subject F). Parallel analysis of a conserved sequence (T4 binding domain; from codon 413 to codon 455, starting from the env signal peptide in the pNL4-3 map) showed a comparable Ka/Ks mean value in TPs and SPs FIG. 3. Dynamics of HIV-1 evolutionary parameters in TP and SP subjects. Bars represent the mean values6the standard deviations of the genetic distance, antonymous (Ka) and synonymous (Ks) substitutions, and Ka/Ks ratio (see Table 3) relative to subjects grouped for the clinical status (TPs and SPs) and nucleic acid sequenced (RNA and DNA) at the three time points (T0, T1, and T2). Asterisks close to the group’s symbol indicate that the rate of increase over time reaches the significant level of 5% for that group (Friedman test).
on November 9, 2019 by guest
http://jvi.asm.org/
(0.78260.713 and 0.97460.635, respectively). The compar-ative data indicate that, probably due to the limited size of the three hypervariable domains, the analysis of complete C2-V5 region measures prevalently sequences which are not under selection, thus reducing the influence of the small regions under strong selective forces, and that great individual differ-ences may be revealed with the analysis of single hypervariable sequences, suggesting important differences in the nature and intensity of these forces.
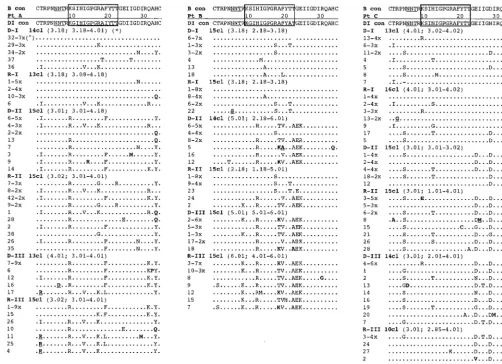
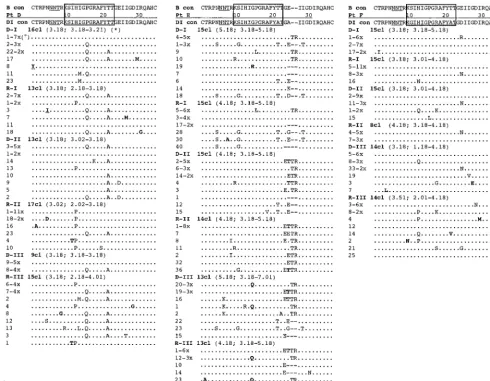
Analysis of V3, V4, and V5 sequences.The V3 loop-deduced
amino acid sequences of all proviral DNAs and cell-free genomic RNAs within each subject were aligned by using the CLUSTAL W program. Alignments are shown in Fig. 5. Amino acid sequences within each host were compared with the majority consensus sequence from the first proviral sample. The V3 loop had a length of 35 amino acid residues in all subjects but one (subject E showed an insertion of two amino acids [a threonine and an arginine] downstream of the princi-pal neutralization domain in the majority of clones after the first sampling time). The two cysteine residues responsible for disulfide bridge formation were conserved in all of the clones but one, relative to subject D (where the first cysteine changed
to tyrosine). The 59 and 39 conformational domains and the N-linked glycosylation site proximal to the 59end were gener-ally conserved in all subjects. Amino acid residues never or very rarely (,0.5%) described in the latest version of the HIV compendium (49) were present in all subjects. The GPGR motif at the loop apex of V3 was the predominant form in all subjects; however, in subject D the loop apex was changed to GQGR in 37 sequences of the 83 distributed in the three samples, this tetrameric tip of the V3 loop being very rarely described (0.6% of all clones analyzed so far) (49). Finally, the charge of the V3 domain at the physiological pH was calcu-lated within sequences from each time point. All subjects but subject B showed a net charge characteristic of monocyto-tropic, nonsyncytium-inducing viral variants (13), which re-mained substantially stable during the observation period. As evidenced in the alignments shown in Fig. 5, evolution with time of the viral population was observed in all TPs, an accu-mulation of amino acid changes being revealed during the observation period. The evolution was gradual in subject A (with the exception of a cluster of minor variants characterized by a change at site 14 [isoleucine to valine] that was maintained at all time points). In contrast, a major shift in the viral pop-FIG. 4. Dynamic features of the selective forces on the complete HIV-1 C2-V5 env sequence and on the hypervariable regions V3, V4, and V5 within each subject. Intratime (first sample) and intertime (second and third samples) Ka/Ks values were plotted for the complete C2-V5 sequence of HIV-1 gp120, and the V3, V4, and V5 regions were analyzed separately. The data are shown as positive or negative histograms starting from Ka/Ks51. Sample points are indicated by white (first), shaded (second), and black (third) bars.
3772 BAGNARELLI ET AL. J. VIROL.
on November 9, 2019 by guest
http://jvi.asm.org/
[image:9.612.133.469.71.449.2]ulation was observed in subject B starting from the second sample. These variants were identified by changes at sites 13 (histidine to arginine) and 25 (glutamic acid to lysine or argi-nine) which, along with an alanine-to-lysine mutation at posi-tion 19, determined an increase in the net charge of the V3 loop (DNA samples, from 3.18 to 5.01; RNA samples, from 3.18 to 6.01). These mutations are presumably responsible for the antigenic variation and the change in cell tropism (37) and, interestingly, these mutations in the V3 loop are responsible for the major cluster observed in the C2-V5 phylogenetic re-construction (Fig. 2, subject B). Furthermore, these results substantiate the evidence of positive selection in the V3 se-quences of subjects A and B as shown above, while the V3 sequences of SPs were fairly homogeneous during the period under study, with no specific variants emerging as predominant forms at any time points except for subject D. In subject D, a major cluster characteristic of RNA clones was identified by a proline at positions 13 and 16 and a threonine at position 22; interestingly, the same RNA clones clustered in the C2-V5 phylogenetic reconstruction, but these variants were also char-acterized by the insertion of an N-linked glycosylation site in the V4 loop (Fig. 2, subject D).
The predicted amino acid sequences of the V4 loop (not shown) were analyzed. All of the sequences from each subject were compared with the consensus sequence deduced from the first proviral sample. The two cysteine residues involved in disulfide bridge formation of the V4 loop were generally highly conserved, but in three cases the first cysteine had changed to arginine (subjects B and F) or tyrosine (subject E). On the whole, aligned sequences from SPs showed a longer V4 loop (mean codon number and standard deviation of 40 6 2.08) than those from TPs (3464.51). The potential N-linked gly-cosylation sites (NXT or NXS sequons) conserved in the B-clade consensus were generally maintained in all of the sub-jects. Length polymorphism was observed in the V4 region of the HIV-1 env gene from the subjects with slow, progressing infection; in most cases, the polymorphism was associated with duplications, deletions, and shifts of glycosylation sites. As stated above, these variations could be the relevant character-istics of the distinct clusters of viral variants observed in the phylogenetic reconstruction of the entire C2-V5 region (sub-jects D and E). Moreover, greater heterogeneity in both num-ber and position of N-linked glycosylation sites was character-istic of the sequence sets from SPs. This observation could be of special interest, since glycosylation may contribute to the structural conformation of the protein and may obscure linear epitopes, eventually influencing cell tropism and host immune response (46). In contrast, limited length polymorphism was observed in the V5 domain of the six patients, the number of codons varying from 16 to 18 in TPs and from 16 to 20 in SPs (data not shown). The potential N-linked glycosylation site was conserved in all sequence sets from each subject, and some-times (subjects A, E, and F) a duplication of the NXT or NXS sequons was also observed.
DISCUSSION
The HIV-1 envelope glycoproteins mediate virus entry into target cells by binding receptors of the cell membrane and fusing viral and cellular structures. Recent crystallographic studies (27, 47, 52) have clarified the complex role of the viral glycoprotein gp120 in the early phase of the infection. The inter- and intrahost variability of the HIV-1 gp120 poses a major problem for the development of effective methods of immunization against this virus even though other factors, in-cluding the low antigenicity and immunogenicity of this viral
protein, could also play an important role (7). In the present study, we analyzed HIV-1 env C2-V5 sequence evolution in sequential samples from symptomless patients by parallel eval-uation of proviral DNA in PBMCs and cell-free genomic-RNA-derived clones. The data indicate that several evolution-ary features concerning the complete C2-V5 sequence are related to the pattern of disease progression of each patient (TPs or SPs) and that intratime or intertime evolutionary pa-rameters evaluated in specific hypervariable HIV-1 regions identify host-specific characteristics. Moreover, the study indi-cates that HIV-1 env gene evolution is the result of a contin-uous modulation of the pressure of the host’s selective forces on distinct sequences of these glycoproteins, which have crucial biological importance.
The genetic evolution of the viral population within an in-fected host is a hallmark of HIV-1 infection. Recent research has highlighted the dominant role of positive selection in this evolution (14, 51, 55), and it has been observed that HIV-1 transmission does not reset the evolutionary clock (26), since the accumulation of mutations is a continuous process both intrasubject and between subjects. An additional aspect of the HIV-1 evolution concerns its relevant features in patients with different patterns of disease progression; in other words, it is important to verify whether (and to what extent) the charac-teristics of virus evolution reflect a specific pattern of disease progression. Finally, since it has been observed that the degree of positive pressure for amino acid changes of viral proteins is host dependent (55), it should be clarified whether, in a given host, the selective forces act constantly on the viral structures or whether their impact is modulated during the natural history of the infection.
A difference in percent similarity (all DNA- and RNA-de-rived clones) was observed between TPs and SPs (P50.0001); this difference was mainly due to DNA clones. This finding perfectly agrees with previous studies addressing HIV-1 ge-netic variability in infected subjects with different clinical out-comes (14, 31, 51). As a confirmation of these results, a higher diversity (intratime distance) and evolution rate (intertime dis-tance) was documented in SPs than in TPs when sequences from proviral DNA were analyzed (P values of 0.0043 and 0.0259, respectively), but such differences did not reach signif-icance when cell-free RNA sequences were considered. Over-all, these data (together with the phylogenetic analysis of se-quences) are consistent with the assumption that, in SPs, proviral DNA sequences in PBMCs are largely representative not only of the replicating virus but also of archival or unex-pressed viral variants.
To determine whether the results of viral diversity are a consequence of different levels of selective constraints and to further analyze the role of the selective forces in HIV-1 env evolution, the rate of nonsynonymous (antonymous) over syn-onymous nucleotide substitutions was evaluated. An excess of antonymous over synonymous substitutions is an unambiguous index of positive selection at the molecular level, and estima-tion of synonymous and antonymous substituestima-tion rates has provided an important tool for studying the molecular process of sequence evolution. In HIV-1 infection, positive selection of viral genes has recently been addressed by use of different model systems (6, 14, 38, 51, 53, 55). Several methods for estimating synonymous and antonymous substitution rates use either comparison between two sequences (28, 30, 39) or an explicit codon substitution model (15). In the present study, we used the analysis of intratime and intertime Ka and Ks (39) to evaluate the level of host-selective forces on the C2-V5 HIV-1 env sequence and, separately, on the gp120 V3, V4, and V5 regions. The accumulation of antonymous substitutions and
on November 9, 2019 by guest
http://jvi.asm.org/
the Ka/Ks ratio in the C2-V5 sequence were significantly higher in SPs than in TPs, when DNA- or RNA-derived se-quences were analyzed. By contrast, no significant difference between the two groups was observed when the rate of synon-ymous substitutions was compared. These results indicate that the differences in the Ka/Ks ratio observed between TPs and SPs principally depend on differences in Ka values, thus lend-ing substance to the concept of a higher level of selective forces operating in SPs. Since all subjects (except subject A) had a comparable length of infection, the data, taken together, sug-gest that the greater level of selective pressure in SPs reflects host-dependent differences rather than accumulation of muta-tions due to the length of the immunocompetent period.
According to the neutral theory of molecular evolution, pro-tein sequence evolution is under purifying selection and ran-dom genetic drift and the rate of variation is due to the dif-ference in functional constraints (25). However, in the analysis of evolutionary parameters, the effect of the length of a given sequence has to be considered, since in almost all proteins where positive selection has been observed, only a few amino
[image:11.612.53.556.73.437.2]acid sites were found to be responsible for the adaptive evolu-tion (22). As a consequence, the Ka/Ks ratio in a large porevolu-tion of the gene may be substantially different from that of specific sites included in this portion. To address this aspect in the HIV-1 env gene, we analyzed comparatively the dynamics of evolutionary parameters in different portions of the C2-V5 HIV-1 sequence and in DNA- or RNA-derived clones. Inter-estingly, while generally Ka/Ks values ranging from 1.0 to 2.0 were observed in the C2-V5 regions of SPs (and lower than 1.0 in TPs), a sustained positive selection (reaching Ka/Ks values higher than 2.0) was observed in the V3 sequence in two TPs (A and B) and, only at some time points, in two SPs (E and F) when the single third hypervariable sequence of the env gene was analyzed. The results obtained with the present study in the evaluation of the V3 sequence in SPs infected for 7 to 10 years, together with the data of a previous study of nonpro-gressors documenting ongoing selective pressure on the V3 loop of replicating virus by comparing two samples (collected at seroconversion and 5 years later) (31), suggest that in SPs the process of adaptive evolution of the V3 loop is a very early FIG. 5. Deduced amino acid sequence alignments of the V3 loop from the six subjects. The B-clade consensus sequence reported above each alignment shows the most common amino acid found in each position among 1,078 viral variants (see reference 49). The sequences from each subject are aligned with the majority consensus sequence from the first proviral sample (DI con) at the top of each alignment. The clinical sample from which the sequences were derived, i.e., proviral DNA or plasma RNA, are indicated as D or R, respectively. The serial time points are indicated by Roman numbers, and the actual number of clones sequenced within each sample is indicated by a number followed by “cl” (clones). The deduced amino acid sequences are identified by the clone number. Dots indicate identity with the reference sequence, while dashes represent gaps introduced to maintain the alignment. Underlined residues indicate unique variants not identified before, and residues in boldface indicate vary rare variants (,0.5%). The box at the top of each alignment identifies the principal neutralization domain; the N-linked glycosylation site is underlined. Symbols: *, median net charge and range at physiological pH; °, frequency of clones with identical amino acid sequences.
3774 BAGNARELLI ET AL. J. VIROL.
on November 9, 2019 by guest
http://jvi.asm.org/
event, strictly following (or even paralleling) primary infection. Specific research is needed to verify whether the particular dynamics of the V3 adaptive evolution in this subgroup of HIV-1-infected hosts is dependent on the nature or on the level (or both) of the host’s selective constraints. Nevertheless, the results of the V3 sequence shown here confirm recent evolutionary data obtained by us in a cross-sectional analysis (35), where no difference in intratime Ka/Ks ratio was ob-served between eight nonprogressors and a control population of TPs. Interestingly, the data shown here in SPs (documenting differences in the levels of selective pressure between the C2-V5 sequence and the V3 hypervariable region) also suggest that env regions other than V3 are under strong selective pressure during the infection. Indeed, the V4 region was under positive selection in all of the samples obtained from subjects D and E (both SPs) and at some time points in subject C (a TP), and the V5 region was under positive selective pressure in only one SP (subject F). Taken together, these results (besides confirming that in SPs stronger selective constraints are de-tectable in the complete C2-V5 sequence) highlight the indi-vidual features of these constraints, since host-dependent dif-ferences, in terms of the regions which are maintained under strong selective forces and of the duration of this selection, could be observed in both SPs and TPs. Finally, a methodolog-ical aspect deserves attention. It has been observed that
cur-rent methods for evaluating positive natural selection probably underestimate the levels of host selective forces, since they do not assume that different sites in a protein may have different “selection intensities” (40). Although the real impact of this aspect on HIV-1 env gene evolution should be directly ad-dressed, this consideration reinforces the evidence of a crucial role for host selective constraints on the HIV-1 env gene evo-lution in vivo.
In this study, the evolution of the V3 loop over time was documented in all TPs, while V3 sequences of SPs were nearly homogeneous during the period under study. For the V4 re-gion, higher heterogeneity in both number and position of N-linked glycosylation sites was characteristic of the sequence sets from SPs. This result deserves attention, since N-linked glycosylation contributes to the structural conformation of gp120, obscures linear epitopes, and eventually influences the cell tropism and the host’s immune response, as recently doc-umented in the simian immunodeficiency virus (SIV) model system (46). The gp120 glycoproteins of HIV-1 and SIV are heavily glycosylated, and approximately 24 potential N-linked glycosylation sites are present on these proteins (29), carbohy-drates constituting about 50% of the mass. Notably, distinct clusters of viral variants observed in the phylogenetic recon-struction of the entire C2-V5 region in two subjects (two SPs, subjects D and E) were characterized by the insertion of gly-FIG. 5—Continued.
on November 9, 2019 by guest
http://jvi.asm.org/
[image:12.612.63.553.74.455.2]cosylation sites, thus suggesting an important biological role for these changes.
ACKNOWLEDGMENTS
This work was partially supported by grants from the Italian Istituto Superiore di Sanita` (Progetto AIDS) and the Consiglio Nazionale delle Ricerche (Progetto Finalizzato Biotecnologie).
REFERENCES
1. Bagnarelli, P., S. Menzo, A. Valenza, A. Manzin, M. Giacca, F. Ancarani, G. Scalise, P. E. Varaldo, and M. Clementi.1992. Molecular profile of human immunodeficiency virus type 1 infection in symptomless patients and in patients with AIDS. J. Virol. 66:7328–7335.
2. Bagnarelli, P., A. Valenza, S. Menzo, R. Sampaolesi, P. E. Varaldo, L. Butini, M. Montroni, C.-F. Perno, S. Aquaro, D. Mathez, J. Leibowitch, C. Balotta, and M. Clementi.1996. Dynamics and modulation of human immunodefi-ciency type 1 transcripts in vitro and in vivo. J. Virol. 70:7603–7613. 3. Bakhanashvili, M., and A. Hizi. 1992. Fidelity of the reverse transcriptase of
human immunodeficiency type 2. FEBS Lett. 306:151–156.
4. Bakhanashvili, M., and A. Hizi. 1993. The fidelity of the reverse transcrip-tases of human immunodeficiency viruses and murine leukemia virus exhib-ited by the mispair extension frequencies is sequence dependent and enzyme related. FEBS Lett. 319:201–205.
5. Bebenek, K., J. Abbotts, S. H. Wilson, and T. A. Kunkel. 1993. Error-prone polymerization by HIV-1 reverse transcriptase. Contribution of template-primer misalignment miscoding and termination probability to mutational hot spots. J. Biol. Chem. 268:10324–10334.
6. Boenhoeffer, S., E. C. Holmes, and M. A. Nowak. 1995. Causes of HIV diversity. Nature 376:125.
7. Burton, D. R. 1997. A vaccine for HIV type 1: the antibody perspective. Proc. Natl. Acad. Sci. USA 94:10018–10023.
8. Delwart, E. L., H. W. Sheppard, B. D. Walker, J. Goudsmit, and J. I. Mullins. 1994. Human immunodeficiency virus type 1 evolution in vivo tracked by DNA heteroduplex mobility assays. J. Virol. 68:6672–6683. 9. Dougherty, J. P., and H. M. Temin. 1988. Determination of the rate of
base-pair substitution and insertion mutations in retrovirus replication. J. Vi-rol. 62:2817–2822.
10. Eckert, K. A., and T. A. Kunkel. 1993. Fidelity of DNA synthesis catalyzed by human DNA polymerase alpha and HIV-1 reverse transcriptase: effect of reaction pH. Nucleic Acids Res. 21:5212–5220.
11. Epstein, L. G., C. Kuiken, B. M. Blumberg, S. Hartman, L. R. Sharer, M. Clement, and J. Goudsmit.1991. HIV-1 V3 domain variation in brain and spleen of children with AIDS: tissue-specific evolution within host-deter-mined quasispecies. Virology 180:583–590.
12. Felsenstein, J. 1993. Phylogeny interference package, version 3.5. Depart-ment of Genetics, University of Washington, Seattle, Wash.
13. Fouchier, R. A. M., M. Groenik, N. A. Koostra, M. Tersmette, H. G. Huis-man, F. Miedema, and H. Schuitemaker.1992. Phenotype associated se-quence variation in the third variable domain of the human immunodefi-ciency virus type 1 gp120 molecule. J. Virol. 66:3183–3187.
14. Ganeshan, S., R. E. Dickover, B. T. Korber, Y. J. Bryson, and S. M. Wolin-sky.1997. Human immunodeficiency virus type 1 genetic evolution in chil-dren with different rates of development of disease. J. Virol. 71:663–677. 15. Goldman, N., and Z. Yang. 1994. A codon-based model of nucleotide
sub-stitution for protein-coding DNA sequences. Mol. Biol. Evol. 11:725–734. 16. Goodenow, M., T. Huet, W. Saurin, S. Kwok, J. Sninsky, and S.
Wain-Hobson.1989. HIV-1 isolates are rapidly evolving quasispecies: evidence for viral mixtures and preferred nucleotide substitution. J. Acquired Immune Defic. Syndr. 2:344–352.
17. Hahn, B. H., G. M. Shaw, M. E. Taylor, R. R. Redfield, P. D. Markham, S. Z. Salahuddin, F. Wong-Staal, R. C. Gallo, E. S. Parks, and W. P. Parks.1996. Genetic variation in HTLV III/LAV over time in patients with AIDS or at risk for AIDS. Science 232:1548–1553.
18. Ho, D. D., A. U. Neuman, A. S. Perelson, W. Chen, J. M. Leonard, and M. Markowitz.1995. Rapid turnover of plasma virions and CD4 lymphocytes in HIV-1 infection. Nature 373:123–126.
19. Halapi, E., T. Leitner, M. Jansson, G. Scarlatti, P. Orlandi, A. Plebani, L. Romiti, J. Albert, H. Wigzell, and P. Rossi.1997. Correlation between HIV sequence evolution, specific immune response and clinical outcome in ver-tically infected infants. AIDS 11:1709–1717.
20. Holmes, E. C., L. Q. Zhang, P. Simmonds, C. A. Ludlam, and A. J. Leigh-Brown.1992. Convergent and divergent sequence evolution in the surface glycoprotein of human immunodeficiency virus type 1 within a single infected patient. Proc. Natl. Acad. Sci. USA 89:4835–4839.
21. Hu, W. S., and H. M. Temin. 1990. Genetic consequences of packaging two RNA genomes in one retroviral particle: pseudodiploidy and a high rate of genetic recombination. Proc. Natl. Acad. Sci. USA 87:1556–1560. 22. Huges, A. L., and M. Nei. 1988. Pattern of nucleotide substitution at major
histocompatibility complex class I loci reveals overdominant selection. Na-ture 335:167–170.
23. Karlsson, A. C., S. Lindba¨ck, H. Gaines, and A. Sonnerborg. 1998. Charac-terization of the viral population during primary HIV-1 infection. AIDS 8: 839–847.
24. Kimura, M. 1980. A simple method for estimating evolutionary rates of base substitutions through comparative studies of nucleotide sequences. J. Mol. Evol. 16:111–120.
25. Kimura, M. 1983. The neutral theory of molecular evolution. Cambridge University Press, Cambridge, United Kingdom.
26. Korber, B., J. Theiler, and S. Wolinsky. 1998. Limitations of a molecular clock applied to considerations of the origin of HIV-1. Science 280:1868– 1871.
27. Kwong, P. D., R. Wyatt, J. Robinson, R. W. Sweet, J. Sodroski, and W. A. Hendrickson.1998. Structure of an HIV gp120 envelope glycoprotein in complex with the CD4 receptor and a neutralizing human antibody. Nature 393:648–659.
28. Ina, Y. 1985. New methods for estimating the numbers of synonymous and nonsynonymous substitutions. J. Mol. Evol. 40:190–226.
29. Leonard, C. K., M. W. Spellman, L. Riddle, R. J. Harris, J. N. Thomas, and T. J. Gregory.1990. Assignment of intrachain disulfide bonds and charac-terization of potential glycosylation sites of the type 1 recombinant human immunodeficiency virus envelope glycoprotein (gp120) expressed in Chinese hamster ovary cells. J. Biol. Chem. 265:10373–10382.
30. Li, W.-H., C.-I. Wu, and C. C. Luo. 1985. A new method for estimating synonymous and nonsynonymous rates of nucleotide substitutions consider-ing the relative likelihood of nucleotide and codon changes. Mol. Biol. Evol. 2:150–174.
31. Lukashov, V. V., C. L. Kuiken, and J. Goudsmit. 1995. Intrahost human immunodeficiency virus type 1 evolution is related to length of the immu-nocompetent period. J. Virol. 69:6911–6916.
32. Mansky, L. M., and H. M. Temin. 1995. Lower in vivo mutation rate of human immunodeficiency virus type 1 than that predicted from the fidelity of purified reverse transcriptase. J. Virol. 69:5087–5094.
33. McNearney, T., Z. Hornickowa, R. Markham, A. Birdwell, M. Arens, A. Saah, and L. Ratner.1992. Relationship of human immunodeficiency virus type 1 sequence heterogeneity to stage of disease. Proc. Natl. Acad. Sci. USA 89:10247–10251.
34. Menzo, S., P. Bagnarelli, M. Giacca, A. Manzin, P. E. Varaldo, and M. Clementi.1992. Absolute quantitation of viremia in human immunodefi-ciency virus infection by competitive reverse transcription and polymerase chain reaction. J. Clin. Microbiol. 30:1752–1757.
35. Menzo, S., R. Sampaolesi, E. Vicenzi, E. Santagostino, G. Liuzzi, A. Chiri-anni, M. Piazza, O. J. Cohen, P. Bagnarelli, and M. Clementi.1998. Rare mutations in a domain crucial for V3-loop structure prevail in replicating HIV from long-term nonprogressors. AIDS 12:985–997.
36. Meyerhans, A., R. Cheynier, J. Albert, M. Seth, S. Kwok, J. Sninsky, L. Morfeldt-Månson, B. Åsjo¨, and S. Wain-Hobson.1989. Temporal fluctua-tions in HIV quasispecies in vivo are not reflected by sequential HIV isola-tions. Cell 58:901–910.
37. Milich, L., B. Margolin, and R. Swanstrom. 1993. V3 loop of the human immunodeficiency virus type 1 Env protein: interpreting sequence variability. J. Virol. 67:5623–5634.
38. Mindell, D. P. 1996. Positive selection and rates of evolution in immunode-ficiency viruses from humans and chimpanzees. Proc. Natl. Acad. Sci. USA 93:3284–3288.
39. Nei, M., and T. Gojobori. 1986. Simple methods for estimating the number of synonymous and nonsynonymous nucleotide substitutions. Mol. Biol. Evol. 3:418–426.
40. Nielsen, R., and Z. Yang. 1998. Likelihood models for detecting positively selected amino acid sites and applications to the HIV-1 envelope gene. Genetics 148:929–936.
41. Nowak, M. A., R. M. Anderson, A. R. McLean, T. F. Wolfs, J. Goudsmit, and R. M. May.1991. Antigenic diversity thresholds and the development of AIDS. Science 254:963–969.
42. Nowak, M. A., and C. R. Bangham. 1996. Population dynamics of immune responses to persistent viruses. Science 272:74–79.
43. Pathak, V. K., and H.-M. Temin. 1990. Broad spectrum of in vivo forward mutations, hypermutations, and mutational hotspots in a retroviral shuttle vector after a single replication cycle: substitutions, frameshifts, and hyper-mutations. Proc. Natl. Acad. Sci. USA 87:6019–6023.
44. Pathak, V. K., and H.-M. Temin. 1990. Broad spectrum of in vivo forward mutations, hypermutations, and mutational hotspots in a retroviral shuttle vector after a single replication cycle: deletions and deletions with insertions. Proc. Natl. Acad. Sci. USA 87:6024–6028.
45. Regoes, R. R., D. Wodarz, and M. A. Nowak. 1998. Virus dynamics: the effect of target cell limitation and immune responses on virus evolution. J. Theor. Biol. 191:451–462.
46. Reitter, J. N., R. E. Means, and R. C. Desrosiers. 1998. A role of carbohy-drates in immune evasion in AIDS. Nat. Med. 4:679–684.
47. Rizzuto, C. D., R. Wyatt, N. Hernandez-Ramos, Y. Sun, P. D. Kwong, W. A. Hendrickson, and J. Sodroski.1998. A conserved gp120 glycoprotein struc-ture involved in chemokine receptor binding site. Science 280:1949–1953. 48. Temin, H.-M. 1993. Retrovirus variation and reverse transcription: abnormal
3776 BAGNARELLI ET AL. J. VIROL.
on November 9, 2019 by guest
http://jvi.asm.org/
strand transfers result in retrovirus genetic variation. Proc. Natl. Acad. Sci. USA 90:6900–6803.
49. Theoretical Biology and Biophysics Group. 1997. The human retroviruses and AIDS compendium (1997 version). Theoretical Biology and Biophysics Group/Los Alamos National Laboratory, Los Alamos, N. Mex.
50. Wei, X., S. K. Ghosh, M. E. Taylor, V. A. Johnson, E. A. Emini, P. Deutsch, J. D. Lifson, S. Bonhoefer, M. A. Nowak, B. H. Hahn, M. S. Saag, and G. M. Shaw.1995. Viral dynamics in human immunodeficiency virus type 1 infec-tion. Nature 373:117–122.
51. Wolinsky, S. M., B. T. M. Korber, A. U. Neumann, M. Daniels, K. J. Kunstman, A. J. Whetsell, M. R. Furtado, Y. Cao, D. D. Ho, J. T. Safrit, and R. A. Koup.1996. Adaptive evolution of human immunodeficiency virus-type 1 during the natural course of infection. Science 272:537–542.
52. Wyatt, R., and J. Sodroski. 1998. The HIV-1 envelope glycoproteins:
fuso-gens, antifuso-gens, and immunogens. Science 280:1884–1888.
53. Yamaguchi, Y., and T. Gojobori. 1997. Evolutionary mechanisms and pop-ulation dynamics of the third variable envelope region of HIV within single hosts. Proc. Natl. Acad. Sci. USA 94:1264–1269.
54. Yu, H., and M. F. Goodman. 1992. Comparison of HIV-1 and avian myelo-blastosis virus reverse transcriptase fidelity on RNA and DNA templates. J. Biol. Chem. 267:10888–10896.
55. Zhang, L., R. S. Diaz, D. D. Ho, J. W. Mosley, M. P. Bush, and A. Mayer. 1997. Host-specific driving force in human immunodeficiency virus type 1 evolution in vivo. J. Virol. 71:2555–2561.
56. Zhu, T., H. Mo, N. Wang, D. S. Nam, Y. Cao, R. A. Koup, and D. D. Ho. 1993. Genotypic and phenotypic characterization of HIV-1 in patients with pri-mary infection. Science 261:1179–1181.