“VALUE OF ROBINSON’S SCORING SYSTEM AND AgNOR
SCORE IN CLASSIFICATION OF PROLIFERATIVE &
MALIGNANT EPITHELIAL BREAST DISEASES ON FNAC”
DISSERTATION SUBMITTED FOR
M.D. DEGREE EXAMINATION
BRANCH III PATHOLOGY
OF
THE TAMILNADU DR.M.G.R. MEDICAL UNIVERSITY
CHENNAI
TIRUNELVELI MEDICAL COLLEGE HOSPITAL
TIRUNELVELI
CERTIFICATE
This is to certify that the Dissertation “VALUE OF ROBINSON’S
SCORING SYSTEM AND AgNOR SCORE IN CLASSIFICATION OF
PROLIFERATIVE & MALIGNANT EPITHELIAL BREAST DISEASES
ON FNAC” presented herein by Dr. FRANCIS ASIR JOSEPH . J is an
original work done in the Department of Pathology, Tirunelveli Medical
College Hospital, Tirunelveli for the award of Degree of M.D. (Branch III)
Pathology under my guidance and supervision during the academic period of
2010 - 2013.
The DEAN
Tirunelveli Medical College,
CERTIFICATE
I hereby certify that this work embodied in the dissertation “VALUE OF
ROBINSON’S SCORING SYSTEM AND AgNOR SCORE IN
CLASSIFICATION OF PROLIFERATIVE & MALIGNANT
EPITHELIAL BREAST DISEASES ON FNAC” is a record of work done by
Dr. FRANCIS ASIR JOSEPH . J in the Department of Pathology, Tirunelveli
Medical College, Tirunelveli, during his postgraduate degree course in the
academic period 2010-2013. This work has not formed the basis for any
previous award of any degree.
Dr.Sithy Athiya Munavarah MD (Guide),
Professor and HOD of Pathology,
Department of Pathology,
Tirunelveli Medical College,
Tirunelveli.
DECLARATION
I solemnly declare that the dissertation titled “VALUE OF
ROBINSON’S SCORING SYSTEM AND AgNOR SCORE IN
CLASSIFICATION OF PROLIFERATIVE & MALIGNANT
EPITHELIAL BREAST DISEASES ON FNAC” is done by me at
Tirunelveli Medical College Hospital, Tirunelveli.
The dissertation is submitted to The Tamilnadu Dr. M.G.R. Medical
University towards the partial fulfilment of requirements for the award of
M.D. Degree (Branch III) in Pathology.
Place: Tirunelveli Dr. FRANCIS ASIR JOSEPH . J
Date: Postgraduate Student,
M.D Pathology,
Department of Pathology,
Tirunelveli Medical College
ACKNOWLEDGEMENT
I take immense pleasure to acknowledge all those who have helped me to
make this dissertation possible.
I am grateful to the Dean, Tirunelveli Medical College and Medical
Superintendent of the Tirunelveli Medical College Hospital for permitting
me to undertake this study.
I express my profound sense of gratitude to Dr. Sithy Athiya
Munavarah M.D., my respected Professor and Head of Department of
Pathology, Tirunelveli Medical College, Tirunelveli and my guide for her
unstinted guidance and motivation.
I immensely thank Dr. K. Shantaraman M.D., Dr.S.Vallimanalan,
M.D; Dr.K.Swaminathan, M.D., Dr. J. Suresh Durai, M.D., Dr. Arasi
Rajesh, M.D., Professors of Pathology for their constant support and
encouragement. I profusely thank all the other faculties and my postgraduate
colleagues for their valuable support.
I sincerely thank the Professors and faculties of the Departments of
General Surgery and Oncology for providing me the patients for my study.
I also sincerely thank the Technicians and other members of the
Department of Pathology and the Central Diagnostic Laboratory for their kind
co-operation.
I thank all my family members for their encouragement and support
during this study.
ABBREVIATIONS
AgNOR : Argyrophilic Nucleolar Organizer Region
DNA : Deoxy ribonucleic acid
DPX : Di-N-Butyle Phthalate in Xylene
FNAC : Fine Needle Aspiration Cytology
H&E : Hematoxylin and Eosin
mAgNOR : Mean Argyrophilic Nucleolar Organizer Region
NCI : National Cancer Institute
NOR : Nucleolar Organizer Region
NORAP : Nucleolar Organizer Region Associated Protein
NOS : Not Otherwise Specified
NST : No Special Type
pAgNOR : Proliferative Argyrophilic Nucleolar Organizer Region
index
PCNA : Proliferating Cell Nuclear Antigen
rDNA : Ribosomal Deoxyribonucleic acid
RNA : Ribonucleic acid
rRNA : Ribosomal Ribonucleic acid
SAPA : Subjective Argyrophilic Nucleolar Organizer Region
Pattern Assessment
SBR : Scarff-Bloom-Richardson
S.D. : Standard Deviation
sig : Significant
SnRNP : Small Nuclear ribonucleoprotein
SPF : S Phase Fraction
CONTENTS
S.No Title Page.No
1 INTRODUCTION 1
2 AIMS & OBJECTIVES 4
3 REVIEW OF LITERATURE 5
4 MATERIALS AND METHODS 42
5 OBSERVATION AND RESULTS 47
6 DISCUSSION 65
7
8
SUMMARY
CONCLUSION
80
82
BIBLIOGRAPHY
APPENDIX
1
INTRODUCTION
Breast carcinoma is one of the most common non-skin
malignancies and is the leading cause of death in women, comprising
about 22.9% of all cancers in woman worldwide1. However,
non-cancerous conditions of the breast are far more common than carcinomas.
The breasts are composed of specialized epithelium and stroma that gives
rise to both benign and malignant neoplasm. The incidence of female
breast cancer is rising rapidly between the age group of 35 to 50 years
worldwide. Invasive ductal carcinoma comprises the largest group of
malignancy constituting about 65% - 80% of all breast carcinomas2.
The advent of the medical science has conquered many of the
infectious diseases that formerly destroyed large populations of the
mankind, but cancer still remains as an unconquerable disease of the
non-epidemic kind. It’s ironic and tragic that lesions arising from the breast,
readily accessible to self-examination and clinical diagnosis, continue to
take a heavy toll on the female gender. Clinical examination,
mammographic imaging studies and fine needle aspiration cytology have
traditionally been used as a triple assessment tool for evaluation and
diagnosis of the breast lesions2.
Two cytological methods that have been used to obtain material
2
Needle Aspiration Cytology of breast lesions. Aspiration cytology of
nipple secretions is only of a limited use, whereas the application of fine
needle aspiration undoubtedly has a major influence on the evaluation
and diagnosis of the breast lesions2.
Fine needle aspiration offers a rapid and safe diagnostic approach
which is usually being employed as an outpatient procedure without any
need for anaesthesia. In the experienced hands this technique is highly
reliable and promptness of diagnosis alleviates patient anxiety and allows
time to plan for definitive management. The average sensitivity of this
procedure is about 87%, the specificity and positive predictive values are
nearly close to 100%, while the negative predictive value still hovers
around 60%2.
Even then the lesions of the breast pose various diagnostic
difficulties in distinguishing benign from malignant lesions. Since most
of the malignant neoplasm show increased proliferative activity, research
had been directed towards finding a reliable proliferative marker. Mitotic
index forms one of the oldest and reliable proliferation markers since the
advent of light microscopy, but its reproducibility has been greatly
debated3. Since then various such markers has been identified. Nucleolar
3
discovered and utilised by Ploton et al. in 1986 to distinguish benign from
malignant neoplasm, the latter showing more abundant NORs4.
The AgNOR staining is quiet simple and easily affordable
compared to other expensive and complex procedures like enumeration of
S phase fraction (SPF), Proliferating Cell Nuclear Antigen (PCNA), Ki -
67 index and MIB – 1 index. “Earlier the diagnosis of the lesion better is
the prognosis”. Having this concept in our mind, our present study has
been conducted to assess the accuracy of AgNOR as a proliferation
marker in differentiating benign and malignant epithelial breast lesions on
4
AIMS AND OBJECTIVES
1) To assess the value of AgNORs in differentiating benign from
malignant neoplasm of breast.
2) To evaluate the ability of AgNOR score in differentiating benign
proliferative lesions from non-proliferative lesions of breast.
3) To correlate the value of AgNOR score with Robinson’s cytological
scoring system with regard to malignant lesions of the breast.
4) To evaluate the usefulness of AgNORs as a proliferation marker and a
5
REVIEW OF LITERATURE
The human female breasts are modified sweat glands forming a
conical projection between the subcutaneous tissues and the pectoral
muscles. The upper outer quadrant contains about 40 to 50% of mammary
tissue5. The mammary tissue is divided into 10-15 ill-defined lobes,
which are pyramidal in shape with its apex at the areola. The glandular
tissue of each lobes drain into the single collecting duct forming
subareolar dilatation known as the lactiferous sinuses before emerging at
the nipple. Along the length of these ducts arise the lobular units
embedded in a loose connective tissue stroma. Both the glandular and the
stromal component give rise to a variety of benign and malignant
neoplasm of breast (Fig 1). Both the ducts and the lobular units are lined
by a single layer of cuboidal to columnar epithelium surrounded by a
basket weave array of myoepithelial cells. Lymphatic drainage of the
breast tissue lateral to the nipple is towards the axillary group of nodes
while those breast tissues medial to that of the nipple is towards the
internal mammary group of nodes5.
There is no discernible variation between the male and female
breast tissues from the time of conception until puberty. While at puberty
females exhibit branching and further lengthening of their ducts
and fat tissues reaching their maximum breast development by the age of
20 years6,7. The menstrual cycle is accompanied by m
the breast tissue, but major physiological changes
seen during pregnancy and lactation.
breast tissue during menopause which merges with aging associated
[image:16.595.120.475.264.543.2]atrophy of the breast.
FIGURE 1 Anatomic
These physiological changes at the various age groups give
radically different histological appearances
differentiated and compared with the
6
and fat tissues reaching their maximum breast development by the age of
The menstrual cycle is accompanied by minor
, but major physiological changes of the breast tissue
seen during pregnancy and lactation. There is major regression of
during menopause which merges with aging associated
Anatomical origin of common breast lesions
These physiological changes at the various age groups give
radically different histological appearances. These changes should be
differentiated and compared with the pathological processes.
and fat tissues reaching their maximum breast development by the age of
inor variations of
of the breast tissue are
major regression of the
during menopause which merges with aging associated
origin of common breast lesions8.
These physiological changes at the various age groups give
7
BENIGN EPITHELIAL LESIONS
A wide variety of benign lesions arising from both the ducts and
lobules have been observed in the breast. These include non-proliferative
changes, proliferative breast lesions and proliferative breast diseases with
atypia.
NON-PROLIFERATIVE CHANGES
This group includes wide variety of lesions including duct ectasia,
simple cysts of breast, apocrine metaplasia, fibrosis and adenosis of the
breast. All these are grouped under the term fibrocystic changes of breast.
These lesions generally show fragments of usual duct epithelial cells with
a background composed of cyst fluid and cyst macrophages along with
scattered bare bipolar nuclei.
CYSTS OF THE BREAST
Single or multiple cysts of various sizes are the most common
cause of palpable breast swelling. Cysts are the manifestation of
fibrocystic disease and arelined by a single layer of cuboidal or flattened
epithelium, occasionally forming papillary projections.The lumens of the
cysts are filled with fluid, usually containing desquamated cells and large
cells with vacuolated cytoplasm, known as foam cells (cyst
8
The fluid from breast cysts are fairly rich in vacuolated
mononuclear or multinuclear “foam cells” of various sizes, and contains
various numbers of benign duct epithelial cells that are often poorly
preserved. In cysts with papillary proliferation, the epithelial cells are
usually more abundant and larger. Approximately one-third of breast
cysts are lined by large cells, referred to as apocrine metaplasia cells
which contain numerous coarse granules which impart an eosinophilic
appearance to the cytoplasm.
FIBROCYSTIC DISEASE
Fibrocystic disease is the commonest disorder of the female breast.
It occurs in the mature woman, particularly in the pre-menopausal years.
It simultaneously involves the ductal, lobular and stromal elements of the
breast. The disorder is also variously referred to as cystic mammary
dysplasia, benign mammary dysplasia, fibroadenosis, and benign cystic
mastopathy. The affected ducts show areas of dilatation (duct ectasia),
which may appear as cyst containing fluid (cyst formation). The lobular
ductules undergo hyperplastic proliferation (adenosis) and are surrounded
by proliferating stroma (fibrosis). In one variant of fibroadenosis, the
hyperplastic ductules are separated and compressed into tubular shapes
by bands of dense fibrous tissue (sclerosing adenosis)10. Hypertrophy and
9
key features to its diagnosis include usually scanty cohesive sheets of
benign duct epithelial cells forming a honeycomb pattern with variable
number of benign apocrine cells and foam cells in the background of
scattered naked bipolar nuclei11. Necrotic material may be present in
cases with marked dilatation of ducts and the foamy macrophages show
inspissated secretions with dark-staining nuclei and a “dirty” appearance
of the cytoplasm12.
The cellular presentation of fibrocystic disease is variable. Dense
fibrous tissue is resistant to aspiration and when fibrosis is the
predominant component, the sample may be virtually acellular. In cases
of marked adenosis, the smear may show only epithelial cells. The
cytological diagnosis is therefore necessarily incomplete and as such
fibrocystic change is not a specific cytological diagnosis. Wellings and
Alpers13 stated that patients in the age group of 13 to 19 years showed no
apocrine metaplasia whereas this change was identified in over half of
those above 30 years.
PROLIFERATIVE BREAST LESIONS
These are again subdivided into two groups proliferative breast
diseases without / with atypia. Under the category of proliferative disease
without atypia comes the moderate to florid epithelial hyperplasia
10
sclerosing adenosis. While under the category of proliferative disease
with atypia comes the atypical ductal / lobular hyperplasia.
EPITHELIAL HYPERPLASIA
Normally the ducts and lobules are lined by double layer of
epithelial and myoepithelial cells. The epithelial hyperplasia is defined as
the presence of more than two layers of cells which can be from either
luminal or myoepithelial cell type and these hyperplastic cells tend to
distend and occlude the lobules and ducts and even cause distortion of
their shape resulting in formation of irregular lumens.
Cytology wise, they are cellular smears with large slightly
disorganised sheets of cohesive duct epithelial cells with a tendency of
these cells to be arranged in a ‘streaming’ pattern with focal crowding
and overlapping of the nuclei, with mild or absent nuclear atypia in a
background of few scattered bare bipolar nuclei and a few foamy cells14.
ATYPICAL DUCTAL HYPERPLASIA:
Atypical ductal hyperplasia has a high cellular proliferation
resembling that of low-grade ductal carcinoma in situ and there is a
considerable overlap between these two entities and there is no single
feature that can be confidently used to differentiate between them15.
Cytology wise, they are highly cellular smears with large sheets of
11
cribriform pattern with occasional naked bipolar and myoepithelial nuclei
in a background showing necrotic debris and calcium granules.
DUCT PAPILLOMA
These are a group of breast neoplasm that may cause significant
diagnostic problems. The main secretory ducts are the most common sites
of these neoplasm and they usually present with bloody nipple discharge.
The epithelium lining a cystically dilated duct hypertrophies and forms
papillary ingrowths into the cyst cavity which are seen as complex
branching epithelial sheets and finger like projections lined by epithelial
cells showing mild nuclear atypia with a dense fibrovascular stromal core
and are seen along with macrophages and variable amount of cystic fluid
in a background showing sparse naked bipolar nuclei16. Benign duct
papillomas may be single or even multiple in number17.
INVASIVE DUCTAL CARCINOMA
Galen in 2nd century A.D described breast cancer as “The breast
carcinoma exactly resembles the animal crab. In this disease, the veins
extending out from the unnatural growth take the shape of a crab’s legs18”
Rosen19 (1979) stated that invasive ductal carcinoma accounted for 75%
of breast cancer deaths. Current opinion is that the Terminal Duct Lobular
Unit (TDLU) is the site of origin of both invasive ductal as well as
12
Azzopardi20 stressed the work of Wellings and colleagues on the
point of view that most ductal carcinoma arises in the TDLU. Most
malignant tumours of the breast arising from ductal or lobular epithelium
are adenocarcinomas. The greater majority by far are invasive ductal
carcinomas (80%). Invasive ductal carcinoma of No Special Type (NST)
constitutes the majority of about 75%21.
Cytology wise they are highly cellular with neoplastic cells being
arranged in irregular dyscohesive aggregates or sheets with large
pleomorphic cells with malignant nuclear features in a background of
nuclear debris and granular calcium22.
The other special categories of primary breast carcinoma include
lobular carcinoma, mucinous carcinoma, tubular carcinoma, medullary
carcinoma, papillary carcinoma, clear cell carcinoma, secretory
carcinoma, adenoid cystic carcinoma and metaplastic carcinoma.
FINE NEEDLE ASPIRATION CYTOLOGY
Era of modern diagnostic Fine Needle Aspiration Cytology
(FNAC), which has now become an integral part of the pre-operative
diagnosis of any accessible lesions, began with the works and
publications of G. Papanicolaou and H. Traut in the early 1940’s on
cytopathological diagnosis of uterine carcinomas23. Diagnostic cytology
13
during the 1950s and 1960s, where it thrived before spreading all over the
world24. However, histopathological basis for interpretation of cytology
samples were established only around 1960 by Koss25. In a study
conducted by Russ about one in eight breast carcinomas diagnosed with
FNAC were initially considered to be benign lesions on clinical
examination26.
In 1986 Grant27 studied from the summary of 18 reported cases the
following statistics regarding FNA biopsy
Specificity - 99.8%
Sensitivity - 92.5%
Accuracy - 96.5%
Positive predictive value - 99.7%
Negative predictive value - 94.2%
In a study done by Kaninsky28 (1984) demonstrated that FNAC
was an excellent, cost effective diagnostic modality and it may reduce the
cost of diagnosis by as much as 90% compared with excisional biopsy
and its requirement for hospitalization.
FNAC was initially conceived as a means to confirm the clinically
suspicious diagnosis without subjecting the patient to unnecessary
surgical interventions29. As a preoperative diagnosis it has several
14
offering time for planning in advance for definitive treatment and also in
preoperative staging of the cancers.
NATIONAL CANCER INSTITUTE (NCI) – GUIDELINES30
The NCI has given guidelines for a uniform approach to breast
FNA biopsy. It recommends the use of 22-25G needle with the needle
being aimed at the centre of the lesion and moved in different directions
within the lesion. For necrotic, partly cystic and fibrotic lesions the
needle should be aimed at the rim of the lesion and sampling should be
done just within the rim tangentially. Small lesions are better stabilized
by bringing it to an immobile position under the skin before sampling. An
average number of 2-4 needle passes is recommended for adequate
sampling. However more passes are required when encountered with
following conditions like when the tumour is difficult to stabilize or
penetrate, a dry tap, larger tumour of more than 4cms.
Adequacy: Adequacy is assessed by two judgments: First is the
opinion of the aspirator that the report of the cytological findings were
consistent with the clinical findings, second is the pathologist opinion that
the cytology smears do not have any significant artefacts or distortion.
There are no specific requirements for minimal number of duct
15
also recommends the usage of Robinson’s grading system for grading of
the breast carcinomas.
CYTOLOGICAL GRADING - ROBINSON’S GRADING SYSTEM:
Robinson et al31 developed a protocol in 1991 for the cytological
grading of invasive ductal carcinoma - Not Otherwise Specified (NOS).
This method has three cytological grades which correlated well with the
histological grading (Bloom and Richardson histological grading system).
This method is simple, quick and easily reproducible method. In the
Robinson’s system of grading for carcinomas of breast, six different
cytological parameters were applied, namely cell dissociation, uniformity
of the cell, cell size, nucleolus, nuclear margin and nuclear chromatin. A
score of 1-3 is given to each one of these parameters and the tumour is
graded by adding up all the individual scores32.
Robinson et al. established three cytological grades namely grade I,
16
TABLE 1 ROBINSON’S GRADING SYSTEM31,32
Criteria Score
1 2 3
Cell
dissociation
Mostly in
clusters
Mixture of
single
cells and cells in
clusters
Mostly single
cell
Cell uniformity Monomorphic Mildly
pleomorphic
Pleomorphic
Cell size 1-2 times RBC
size
3-4 times RBC
size
>5 times RBC
size
Nuclear margin Smooth Folds Buds and clefts
Nucleoli Indistinct Noticeable Abnormal
Chromatin Vesicular Granular Clumped and
cleared
Final score ranges from 6 – 18 and these were graded below as
Grade I : Score 06 – 11
Grade II : Score 12 - 14
Grade III : Score 15 - 18
The accuracy of Robinson’s grading method was 83%, true
positivity was 77.33% and false negativity was 11.33%33.
Mouriquand J et al.34 applied a cytological grading method for
17
given more importance in this method. Three grades of classification of
tumours were followed. The salient features of grading system were
TABLE 2 GRADING SYSTEM OF MOURIQUAND et al
Criteria Grade 1 Grade 2 Grade 3a Grade 3b
Cells In clusters Both clusters
and isolated
cells
Predominantly isolated cells
Shape &
size
Uniform Larger Anisonucleosis
Chromatin Regularly
distributed
Irregularly
distributed
Highly dispersed
Cytoplasm - - Absent Well preserved
Nucleoli - Enlarged blue Bright red Bright red with a
surrounding
clear halo
Mitosis - - - Numerous
This Mouriquand’s grading method has an accuracy of 77%, true
positivity of 69.33% and false negativity of 15.33%33. Mouriquand’s
grading method34 also corresponded well with that of the Bloom and
Richardson grading system and had a good positive prognostic
correlation. However, this method had not gained wide acceptance. In a
study comparing the two methods with that of histological grading35, the
18
methods were similar. However, Mouriquand’s method had a low
specificity.
The Robinson’s method of cytological grading was far more
specific when Bloom and Richardson method of histological grading was
considered as gold standard. The criteria for grading32 tumour by the
Robinson’s grading system were simpler and easier to reproduce as
compared to the Mouriquand’s grading system. The other grading
systems of importance are Hunt’s et al grading system which has an
accuracy of 70.66%, true positivity of 70.66% and false negativity of
29.33% and the Howell (SBR) Grading System which has an accuracy of
53.89%, true positivity of 40% and false negativity of 31.25%.
Compared with other cytological grading systems Robinson’s
grading system had a correlation of about 83% with Bloom and
Richardson histological grading method and the sensitivity and specificity
were highest by Robinson’s cytological grading system. The Robinson’s
method of cytological grading was also far more specific when Bloom
and Richardson histological grading method was considered as gold
standard32.
Dutta et al36 (2001) studied fine needle aspiration cytology of 51
19
the remaining were benign lesions composed of fibrocystic disease,
mastitis and fibroadenoma. Diagnostic accuracy of FNAC was 90.2%.
Chaiwum et al37 (2002) studied Fine Needle Aspiration Cytology
of 2375 cases from 1994 to 1999, benign lesions accounted for 48%, 5%
were suspicious for malignancy, malignant neoplasm accounted for 15%,
32% were unsatisfactory smears. FNAC showed a specificity of 99.5%
and sensitivity of 84.4%.
Young et al38 (2002) reported that aspiration cytology of
carcinomas of the breast were rightly identified as malignant and the
values of each of the subtypes were - ductal carcinoma - 65%, for lobular
carcinoma it was 20%, for mucinous variety it was 27% and for
medullary carcinoma it was 12%. This study showed that Fine Needle
Aspiration Cytology is the most reliable method for breast carcinoma
diagnosis.
HISTOLOGICAL GRADE
Bloom and Richardson histological grading method is the most
widely used method for grading of the breast carcinoma and this method
is easily reproducible, quite simpler and gives good positive prognostic
implications. This system grades breast carcinoma into three histological
types based on measurement of tubular differentiation, nuclear
20
TABLE 3 BLOOM AND RICHARDSON HISTOLOGICAL
GRADING SYSTEM39
Parameter Criteria Score
Tubule Formation
> 75% 1
10-75% 2
< 10% 3
Nuclear Pleomorphism
Small and uniform 1
Moderate variation 2
Marked variation 3
Mitotic count / 10hpf
0 - 5 1
6 - 10 2
>11 3
The breast carcinomas were graded into 3 grades after summing up
[image:30.595.82.511.135.390.2]all the score of the three features and values range from 3 – 9.
TABLE 4 BLOOM AND RICHARDSON HISTOLOGICAL
GRADING SYSTEM39
Grades Score
Grade 1 (well differentiated) 3 – 5
Grade 2 (moderately differentiated) 6 – 7
21
AgNORs: ARGYROPHILIC NUCLEOLAR ORGANIZER REGIONS
The Nucleolar Organizer Regions (NORs) are loops of DNA
projecting into the nucleoli of interphase nuclei40. These are specific
portions of DNA (deoxyribonucleic acid) called rDNA (ribosomal DNA)
that, by using the enzyme RNA (ribonucleic acid) polymerase-1, codes
for the transcription of ribosomal RNA (rRNA) which in turn results in
the synthesis of proteins by the cell. Since NORs encode for ribosomal
RNA a necessary step in protein synthesis (Fig 2), it has been suggested
that they correlate with cellular proliferative activity41. Organization of a
typical Nucleolar Organizer Region (NOR) is shown in figure 2.
Nucleolar Organizer Region (NOR) are DNA loops that are located
at the ends of each of the acrocentric chromosomes 13, 14, 15, 21 and
2240. NORs occur in pairs on the five acrocentric chromosomes (one on
each of the daughter chromatid), and at the metaphase potentially 20
NORs could be seen. However, in diploid cells visualising ten NORs can
be regarded as a full complement, as the metaphase is a very transient
FIGURE 2 Organization of a
PHYSIOLOGY OF AgNOR’S AND CELLULAR KINETICS:
Ultra structure of the human
These are composed of
1. The dense fibrillar component
2. The fibrillar center
3. The granular component.
The dense fibrillar component
dense 3-5nm thick fibrils and is
precursors and stains with antibodies
protein associated with U3 small nuclear ribonucleoprotein (SnRNP)
The fibrillar center is
and it contains topoisomerase I, RNA polymerase I and ribosomal DNA
22
ganization of a typical Nucleolar Organizer R
PHYSIOLOGY OF AgNOR’S AND CELLULAR KINETICS:
of the human nucleoli shows three substructures
of
The dense fibrillar component – packed electron dense fibrils
The fibrillar center – composed of loose network of fibrils.
The granular component.
The dense fibrillar component consists of lightly packed electron
5nm thick fibrils and is the site for processing of ribosomal RNA
and stains with antibodies targeted to ‘fibrillarin’,
protein associated with U3 small nuclear ribonucleoprotein (SnRNP)
The fibrillar center is the site for the production of ribosomal RNA
topoisomerase I, RNA polymerase I and ribosomal DNA typical Nucleolar Organizer Region41
PHYSIOLOGY OF AgNOR’S AND CELLULAR KINETICS:
three substructures42.
packed electron dense fibrils
loose network of fibrils.
of lightly packed electron
processing of ribosomal RNA
to ‘fibrillarin’, which is a
protein associated with U3 small nuclear ribonucleoprotein (SnRNP)41.
of ribosomal RNA
23
It is equivalent to that of interphase NOR visualised by the light
microscopy.
The granular component is composed of particles of ribosome
precursor.
Tumour behaviour mainly depends upon the Cellular kinetics. The
behaviour of the tumour can be assessed by determining the proliferation
rate. The cell cycle can be divided into four phases based on the nuclear
chromatin activity. They are S, G1, G2 and G0 phases. There is a short
resting phase of the cell undergoing replication at the ‘S’ phase. Thus, the
DNA content at the end of ‘S’ phase is an indicator of proliferative
activity and AgNOR detects the DNA content at this stage43.
The size, shape and number of the NORs vary according to
nucleolar transcription and are related intimately to the cell cycle. Since
nucleolar transcription rate and cell turnover is comparatively high in
proliferating cells, assessment of the morphology and quantity of NORs
helps in assessing cell proliferation.
During the prophase there is dispersion of the components of the
fibrillar centre and these structures exist in a constant position at
metaphase which are seen on the short arms of five acrocentric
24
However, the five acrocentric chromosomes have a tendency to
associate through the satellite regions of these chromosomes and thus
have a greater impact on the number of NORs observed and counted.
DEMONSTRATION OF AgNORs:
The NORs can be visualised by various techniques which either
demonstrate NOR associated proteins or the ribosomal DNA itself
TABLE 5 DEMONSTRATION OF NORs41
Reagent Target
Silver colloid (AgNOR) NORAPs
Bismuth ions 100K NORAP
Radiolabelled rRNA rDNA
Antibodies NORAP epitopes
The most popular and the simpler method among all these in
identifying the NORs is the silver staining technique. The structures
demonstrated by this method are called AgNORs (Argyrophilic Nucleolar
Organizer Regions). This silver staining technique identifies neither the
rRNA nor the rDNA, but the acidic NORAPs (Nucleolar Organizer
Region Associated Proteins) seen in association with the site of RNA
transcription.
AgNORs are usually aggregated tightly within one or two nucleoli
25
are often not discernible. The number of AgNORs detected depends upon
several of these factors44. These include-
1. The stage of the cell cycle.
2. The number of NORs bearing acrocentric chromosomes in their
karyotype
3. The level of transcriptional activity of the cell.
There is thus a remarkable difference between AgNOR counts in
chromosome spreads and those observed in histology sections of the
similar cell preparations. Since the AgNORs congregate within a
relatively small nucleolus in histological sections, there is a greater
difficulty in visualising the individual AgNORs.
In malignant lesions, the AgNORs are dispersed throughout the
nucleus to a varying extent, enabling them to be easily visualised by the
cytologists. Therefore quantification of the AgNORs in interphase nuclei
is probably related more to their dispersion throughout the nucleoplasm
than to the actual number present in the nucleus. Therefore ‘AgNOR
count’ in benign and malignant lesions does not denote the absolute
number of AgNORs but it is rather a numerical index of dispersion of
AgNORs within the nucleus. This connotes that dispersion in itself may
26
AgNORs indicates the number of cells in the current phase of
transcription43.
NORs were first visualized in 1975 by means of a simple silver
staining technique that recognizes these argyrophilia-associated proteins
where they appear as black / brown dots within the nucleus of the cell.
The claims that AgNORs were visualised significantly higher
within the nucleus of malignant tumours compared to that of the reactive /
benign lesions has attracted a lot of attention for AgNORs being regarded
as a cell proliferation marker43.
An apparent increase in the mean AgNOR count was noticed in the
cells under the following conditions:
1. When the cell proliferation was very active, the nucleolar
dissociation was present in almost all cells, and that the AgNORs
were seen throughout the nucleus.
2. A defect of the nuclear association could result in AgNOR
dispersion throughout the nucleus.
3. An increase of the AgNOR bearing chromosomes resulting from
increased cellular ploidy.
4. Prominent increase in AgNOR activity is associated with increased
27
In the benign neoplastic cells AgNORs are aggregated within a
relatively condensed small nucleus and hence show only 1-2 AgNOR per
nucleus, which is been attributed to the difficulty in visualising the
individual NORs. While in malignancy, or in conditions of increased
cellular proliferation, AgNORs get dispersed throughout the nucleus,
enabling the cytologist to enumerate them more easily. Hence, the
AgNOR quantification depends mainly on the degree of disaggregation or
dispersion of large number of AgNORs within the nucleus of the
neoplastic cells.
AgNOR – TECHNICAL ASPECTS
The main advantage of the AgNOR staining technique is that, it is
a one-step silver-staining method, which is a relatively simpler staining
method, and also has the advantage of the ease of application of this
staining method even onto the archival tissues. It can also be used to
demonstrate NORs easily on routinely processed cytology smears and
histology sections45. The principle disadvantage is the time consuming
process of counting of the little dots, often associated with inter-observer
variations.
In concise form, the one step silver-staining method consist of a
mixture of 50% silver nitrate solution and 1% formic acid in 2gms% of
28
to be prepared separately and mixed freshly upon use. Cytological smears
are incubated in this solution mixture for a period of 45 min to one hour
and then washed, dehydrated, cleared and mounted for light microscopy
examination. Both the light microscopy and ultra structure studies have
implicated that this method is remarkably specific as a means of detecting
interphase / metaphase NORs. Staining sequentially with radiolabeled
rDNA and rRNA has shown a good correspondence between the binding
sites and silver stained NORs in interphase nucleoli and on chromosome
spread.
The NORs can be seen as discrete black / brown dots in a pale
yellow background at the light microscopy level and can be enumerated
using an oil immersion lens. Counts in 50-100 neoplastic cells are usually
made and the results are expressed as a mean number of AgNORs
visualised per nucleus. Lymphocytes are usually employed as internal
controls.
This technique can be used with success after making minor
modifications, in both semiautomatic and automatic image analysis
hardware46. In this technique the total amount of AgNORs per nucleus is
measured, rather than the number of sites counted.
The intensity of the AgNOR staining is observed to be dependent
29
the other. Alcohol based fixatives, Carnoy’s fixative and 95% ethanol
gives optimal results. Mercury and dichromate fixatives are highly
detrimental to the AgNOR staining47.
AgNOR STAINING REACTION & PROBLEMS:
The silver staining technique is based upon the principle that, the
silver salts as a result of their high electron charge density and by virtue
of their phosphate moieties have a high affinity for the acidic NORAPs.
Generally, the AgNOR silver staining method is been run for about
one hour irrespective of whether cytological smears or histological
sections were stained, but recently minor alterations have been put forth
to reduce the staining time and also to incorporate internal controls to
allow counting of subsidiary AgNOR dots.
First, the persistent problem with the usage of any kind of silver
staining method is the non-specific silver grain deposits in the
background. Usage of clean glassware and very pure deionised water can
overcome this background staining. However, recently certain minor
modifications in the AgNOR staining method have been put forth that can
overcome this problem of background staining. These are:
1. Usage of an inverted incubation technique, where the slides are
inverted into the staining solution. This technique helps in maintaining
30
2. Glycine blocks both free and reversibly bound aldehyde residues left
over by formalin fixation, thereby reducing the background silver
precipitation. Hence, pre-incubation with glycine prior to AgNOR
staining can reduce the background stain.
3. After completion of the staining procedure immersing the slides in a
10% nitric acid solution can minimise the background stain.
4. Replacement of gelatin by polyethylene glycol as a protective
colloidal developer medium49.
Second, the intensity of staining varies considerably even with
slight variations of the staining time; which if over-stained obscures the
individually clustered AgNORs within nucleoli, or if under-stained
renders them too faint to be assessed.
Third, in the histology sections even minor variations in the
thickness of the sections affect the apparent number of AgNORs within
the nuclei, thus requiring uniformity in section thickness of around 3 - 4
µm. Application of this technique to cytology smears thus eliminates this
problem50. Thus AgNOR dot count study on cytological smears has
shown to be far more superior compared to those on histological sections.
Cytological smears also show a better discriminative value of AgNOR
31
One great advantage of this technique is that, previously stained
cytology slides can also be reused for silver staining, thus providing an
excellent guide to the diagnosis especially in doubtful cases and when
extra-unstained slides are not available.
The major disadvantages are:
1. Inter-observer variation is the major cause of inaccuracy and
inconsistency.
2. The counting procedures adopted are usually manual and are prone to
subjective variations.
3. Misjudged counts may result due to overlapping of the NORs within
the nucleus43.
4. The dots of AgNOR in the interphase nuclei may not always
correspond to the number of such types in the karyotype of the
nucleus52.
MODIFICATIONS IN THE AgNOR TECHNIQUE:
After the AgNOR technique was first described by Ploton in 1986
it has undergone several modifications with an aim to improve the overall
staining quality. Some of the modifications that are worthwhile to
mention include
First, combination of Feulgen reaction with modified AgNOR
32
but also the evaluation of the amount of DNA within the same cell
nucleus by the Feulgen reaction.
Secondly, combination of AgNOR staining technique with
cytofluorometric analysis on cell suspensions.
Thirdly, the use of AgNOR technique along with automatic image
analysis software makes these technique far less prone to subjective
errors than the traditional methods46.
AgNOR - ENUMERATION 53
The types of Nucleolar Organizer Regions within the nucleus can
be categorized into three groups.
The first one is the ‘Aggregated AgNOR’ which are seen as
rounded, solitary structures and corresponds to the nucleolus of the cell,
this type is often seen in resting cells and lymphocytes and the individual
NORs cannot be distinguished within the nucleus of these cells.
The second type is the ‘Nucleolar pattern’ which is seen in the
nucleus of the proliferating cells and the NORs are seen to be dispersed
only within the nucleolus of the cell.
Finally, the third type is the ‘True AgNORs’ that are seen to be
dispersed throughout the nucleoplasm and are often seen in highly
malignant neoplastic cells. These features can be demonstrated well in the
33
METHODOLOGY:
There are five methods for enumeration of AgNORs based on their count,
morphology and distribution. They are
1. Mean AgNOR count
2. AgNOR proliferative index
3. AgNOR size variation grading
4. AgNOR distribution in the nuclei
5. Subjective AgNOR Pattern Assessment (SAPA)
Mean AgNOR count (mAgNOR):
Mean count of the number of NORs present in the nucleus of the
100 neoplastic cells. mAgNOR value correlates with the mean DNA
content of the cells indicating the cell ploidy.
AgNOR proliferative index (pAgNOR):
It is the percentage of neoplastic cells exhibiting more than five
NORs within the nucleus of the 100 counted cells. pAgNOR value
represents the number of cells in the S-phase fraction.
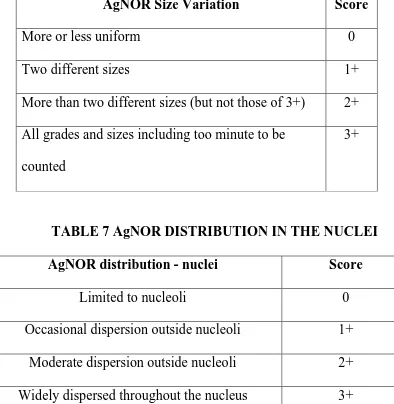
AgNOR size variation and distribution grading:
In 1991 – 1992 Ahsan et al utilised the criteria of size variation and
distribution of AgNORs within the nucleus and demonstrated higher
variation score of these parameters in malignant neoplasm compared to
34
TABLE 6 AgNORs SIZE VARIATION GRADING
AgNOR Size Variation Score
More or less uniform 0
Two different sizes 1+
More than two different sizes (but not those of 3+) 2+
All grades and sizes including too minute to be
counted
3+
TABLE 7 AgNOR DISTRIBUTION IN THE NUCLEI
AgNOR distribution - nuclei Score
Limited to nucleoli 0
Occasional dispersion outside nucleoli 1+
Moderate dispersion outside nucleoli 2+
Widely dispersed throughout the nucleus 3+
Subjective AgNOR Pattern Assessment:
Meehan et al proposed a method for scoring of AgNORs called
‘Subjective AgNOR Pattern Assessment (SAPA), which was based on
morphological patterns, variation in the size and shape of the NORs, and
35
In a study by Dhakhwa R et al55 on 110 breast lumps observed the
mean AgNOR count in benign breast lesions was 2.63 ± 1.36 while the
SAPA score was 6.26 ± 1.19. The SAPA score in malignant breast
lesions was10.05 ± 2.22 and the mean AgNOR count was 8.42 ± 2.53
When the cut off score for AgNOR count / nucleus is taken as 6 for
malignant neoplasm of breast, then the diagnostic accuracy is 95.5%,
specificity is 88.9%, sensitivity is 89.5%; positive predictive value is
82.2% and the negative predictive value is 98.5%.
When the cut off value for SAPA score is taken as 8 for malignant
neoplasm of breast, then the diagnostic accuracy is 85.5%, specificity is
83.3 %, sensitivity is 89.5%; positive predictive value is 73.9 % and the
negative predictive value is 93.8% (Table 7a).
In cases that presented with diagnostic difficulties on FNAC
subjective pattern assessment and AgNOR counting showed comparable
accuracy in differentiating malignant from benign lesions. In some cases
this may give contradictory results and hence more helpful when they are
TABLE 7a: AgNOR COUNT AND SAPA SCORE IN BREAST
Diagnosis
Fibrocystic changes
Fibroadenoma with
fibrocystic changes
Intraductal papilloma
Infiltrating ductal
carcinoma - NOS
TABLE 8 SUBJECTIVE AgNOR PATTERN ASSESSMENT
36
AgNOR COUNT AND SAPA SCORE IN BREAST
LESIONS55
Number of cases
AgNOR Count SAPA score
7 2.71+/-1.38
7 2.86+/-1.21
1 5
32 8.31+/-2.6
SUBJECTIVE AgNOR PATTERN ASSESSMENT
AgNOR COUNT AND SAPA SCORE IN BREAST
SAPA score
6+/-1.55
5.86+/-3.8
7
9.94+/-2.2
37
SAPA score is a more rapid, reproducible and and less time
consuming than counting of AgNOR dots55. Both SAPA score and AgNOR
counts gave similar results on cytology56.
Khanna AK et al56 in his study found SAPA score was most useful
in differentiating benign neoplasm from malignant neoplasm of breast in
both the cytology smears and histology specimens.
AgNOR – ITS APPLICATIONS:
AgNOR as a one step silver colloid staining method was used first
in the prostatic specimens. As the years followed AgNOR staining
method was performed on a variety of specimens mainly to differentiate
malignant from benign lesions. In the malignant neoplasm the increasing
AgNOR count correlated well with the tumour aggressiveness.
AgNORS IN BREAST:
Since the time cytogenetic workup studies were performed
malignant breast lesions showed unusual and ectopic (Nucleolar
Organizer Regions) NOR patterns, this has lead the pathologist to explore
the potential of AgNORs in differentiating borderline breast lesions from
those of the malignant ones57. According to various studies, AgNOR
values correlated very well with the prognostic indices like axillary
lymph node status, tumor size, Ki-67 index, MIB-1 index and mitotic
38
CYTOLOGY APPLICATIONS:
In the recent past, AgNOR has emerged as a wonderful tool in
assessing the proliferative activity of a given lesion in the cytology
smears enabling the cytologist to assess the aggressiveness of the
neoplasm pre-operatively. Main advantage of AgNORs in cytology
smears is that one need not worry about the section thickness as in
histology as thicker sections make it difficult to enumerate individual
AgNOR dots. While in cytology smears even distribution of cells makes
enumeration of AgNOR dots quite simpler40.
In the study conducted by Roller E et al58 in 1993 on 56 cases of
malignant and 20 cases of benign breast neoplasm, he found a clear
difference between benign and malignant neoplasm of breast, the latter
showing significantly higher AgNOR counts.
Reddy GS, Sesikeran B, Bhaskaran CS59 also in the same year
conducted a study on ten malignant and benign epithelial neoplasm of
breast, and they concluded that quantitative analysis of AgNORs enables
one to differentiate benign from malignant lesions.
A prospective study was conducted by Karmakar T, Radhika S,
Gupta SK60 in the year 1995 on the cyotological smears of both benign
and malignant breast lesions encompassing proliferative lesions,
39
that the mean AgNOR count of 16.63 in malignant neoplasm was much
higher and statistically significant compared to the mean AgNOR count
of 6.39 in benign neoplasm. They concluded that a cut-off AgNOR value
of 11 can reliably be utilised in differentiating benign from malignant
neoplasm. Whereas a study conducted on assessing the number of
AgNOR dots in 64 malignant and 31 benign neoplasm of breast on
cytological smears by Mehrotra A, Chandra T61 concluded by putting
forth a cut off point of 4 to be reliable indicator to differentiate benign
from malignant neoplasm of the breast.
In a study conducted by Simha et al62 in the year 1996 on the
prognostic value of AgNORs in breast neoplasm showed that the AgNOR
counts correlated very well with desmoplasia, mitosis and tumour size.
Higher NOR counts were seen in ER/PR negative neoplasm.
In a study conducted by Kumar et al63 in the year 1997 assessed the
AgNOR count of breast carcinomas in the cytology smears of 56 cases
and found that the AgNOR counts correlated well with stage of the
cancer, tumour size, lymph node status and recurrence rate of tumour.
A prospective study was conducted by Hasnan J, Jayaram G40 on
the cytology smears of 31 cases of benign and 25 cases of malignant
breast neoplasm with histological correlation in about 26 cases, found
40
and the range in malignant neoplasm was 5.8 to 17.2. The difference in
the mean AgNOR count between the benign and malignant lesions was
statistically significant. None of the cases showed overlap of mean
AgNOR values in the cytological smears.
Khanna AK, Kumar M, Ansari MA, Khanna A64 studied both
cytology and histology of 73 breast lesions which included 27 benign and
46 malignant neoplasm and assessed the correlation between cytology
and histology using Subjective AgNOR Pattern Assessment (SAPA)
score and mean AgNOR dot counts. They concluded that both SAPA
score and mAgNOR counts were useful in differentiating malignant from
benign neoplasm in both histology specimens and the cytology smears
and both gave similar results. Mean AgNOR count of malignant
neoplasm was 6.94 while in benign neoplasm it was 2.75 in Fine Needle
Aspiration Cytology. SAPA score of malignant neoplasm was 9.02 and
5.87 in benign neoplasm. They concluded that Subjective AgNOR Pattern
Assessment score is more rapid, reproducible and convenient method of
AgNOR assessment64.
Meehan SM, Carney DN, Magee H, Dervan PA54 evaluated the
cytological preparations obtained from surgical specimens for AgNOR
count, shape, size and clustering. The malignant lesion had a mean
41
4.44, and they concluded that the diagnostic accuracy of combined
pattern assessment and counting of NORs was 90% in distinguishing
benign and malignant neoplasm. The median score for benign lesions
were 7 and for malignant lesions it was 13.
AgNORs being indicators of cellular proliferative activity
correlated well with Ki-67 index in a study conducted by Dervan PA,
Gilmartin LG, Loftus BM, Carney DN65 on 70 cases of malignant breast
lesions and 27 cases of benign breast lesions. The correlation between
Ki-67 scores and AgNOR counts was highly significant. The view of these
authors was also shared by Canepa M et al66 who conducted a study on 53
cases of intra ductal breast carcinoma.
Kesari AL et al67 evaluated 120 cases of intra ductal breast
carcinoma and found a good positive correlation between histological
grading, AgNOR score and PCNA expression. Poorly differentiated
tumours had a highly elevated AgNOR counts.
Our present study was aimed to find out whether there is any
significant difference in the AgNOR values of benign and malignant
neoplasm of the breast and also to find out if there is any significant
change in the AgNOR values between the non-proliferative and
proliferative benign lesions of the breast. The correlation between the
Robinson’s scoring system and the AgNOR scoring system was also
42
MATERIALS AND METHODS
This prospective study was conducted in the Cytology Laboratory
of the Department of Pathology, Tirunelveli Medical College spanning a
period of about 18 months from May 2011 to October 2012. From 423
cases of Fine Needle Aspiration Cytology of breast lesions 100 cases of
breast lesions were randomly selected and examined, which included 40
cases of carcinomas and 60 cases of proliferative and non-proliferative
breast lesions. This study was conducted after obtaining clearance from
the Institutional Ethical Committee.
FINE NEEDLE ASPIRATION CYTOLOGY
FNAC was performed on patients who presented with palpable
breast lesions.
INCLUSION CRITERIA:
• All patients presenting with palpable breast lesions.
EXCLUSION CRITERIA:
• Patient who refused FNAC procedure.
• Patients in whom no definable breast mass can be detected
• Cytological smears with air-drying artefact or improper staining
METHOD OF COLLECTION:
After making the patient comfortable the FNAC procedure was
43
procedure without any anaesthesia in the cytology laboratory of our
department. FNAC was done after disinfecting the skin with alcohol
scrub and using a 23 gauge needle with 10ml disposable syringe attached
to the syringe holder. The palpable breast lesion was fixed between the
thumb and index finger of one hand and with the other hand the needle
was inserted to the desired depth within the mass. The material was
aspirated under negative pressure with 3 - 4 short passes in different
directions. The needle was withdrawn after the negative pressure was
released, and the material aspirated was expressed on to glass slides,
smeared and fixed immediately in 95% ethanol. The slides were stained
subsequently with Hematoxylin and Eosin and AgNOR stain and
unstained slides were kept for future examination.
AgNOR staining was performed using a one step silver – colloid
technique using a mixture composed of 50 % silver nitrate solution and
2gms% gelatin in 1% Formic acid solution in a ratio of 2:1. These
solution mixtures are layered over the slides and are kept in a dark room
for a period of 50 – 60 minutes. These slides are then washed,
dehydrated, cleared and mounted for examination under the microscope.
The detailed AgNOR staining procedure is given in Appendix – I. The
staining protocol for Hematoxylin and Eosin stain is given in
44
Cytological grading of breast carcinomas was done according to
the Robinson et al. grading system which is a three-tier grading system,
dividing carcinomas into grade 1, grade 2 and grade 3. The AgNOR
enumeration and analysis of all the smears were done and the
observations were noted down by making a master-chart with all the
features of the above grading system. Correlations between these grading
systems were assessed. For this study, an Olympus microscope with 10X,
40X and 100X magnification objectives and 10X magnification eyepiece
was used. The digital images of the selected stained smear preparations
were photographed.
ENUMERATING AgNORS:
AgNORs are visualised as blackish or brown dots in a pale yellow
background, both in the nucleolus and within the nucleoplasm. The
following AgNOR parameters were calculated.
Mean AgNOR count:
The number of AgNORs within the nuclei of 100 neoplastic cells is
calculated using a 100X objective. The mean numbers of NORs per
nucleus were then calculated and results were expressed as a mean count
45
Proliferative AgNOR index (pAgNOR):
pAgNOR is the percentage of neoplastic cells showing more than
five AgNOR dots within the nucleus of the 100 counted neoplastic cells.
Distribution and size variation of AgNORs:
The size variation and the distribution of the AgNORs within the
nucleus are evaluated and given a score of 0, 1+, 2+, 3+ according to the
criteria given in Table 6, Table 7.
Subjective AgNOR Pattern Assessment (SAPA):
The SAPA scoring of the AgNORs are done based upon the
criteria given in Table 8, which takes into consideration the
morphological characteristics and whether the NORs are clustered or
scattered within the nucleus.
ROBINSON’S GRADING SYSTEM:
Robinsons grading system is used in the grading of malignant
neoplasm of breast stained with H & E stain. The criterion for this scoring
system is given in Table 1, which includes cellular dissociation,
uniformity, size, nuclear margin, nucleoli morphology and chromatin
46
Correlation study between the Robinson’s score and the AgNOR
scoring system for grading malignant neoplasm of breast was conducted.
The ability of AgNORs in distinguishing benign (proliferative and
non-proliferative) neoplasm from malignant neoplasm of the breast was
47
OBSERVATION AND RESULTS
This prospective study was conducted in the Cytology Laboratory
of the Department of Pathology, Tirunelveli Medical College for a period
of 18 months and the following observations were made.
TABLE 9 BREAST FNAC vs OTHER SITES
Duration Total number
of FNAC cases
Number of
breast FNAC
cases
Percentage
May 2011-
December 2011
1622 172 10.6%
January
2012-October 2012
2132 251 11.8%
Total 3754 423 11.3%
In the study period of 18 months duration from May 2011 to
October 2012 Fine Needle Aspiration Cytology was performed on a total
of 3754 cases. Out of these cases the breast lesions constituted about 423
cases giving a percentage of 11.3%.
172 cases of breast aspiration cytology out of 1622 total aspiration
cytology cases were studied during the first 6 months period in 2011
constituting 10.6%. The following 10 month study in 2012 showed 251
breast aspiration cytology cases out of 2132 aspiration cytology cases
48
TABLE 10 DISTRIBUTION OF NON-NEOPLASTIC AND
NEOPLASTIC LESIONS ON BREAST CYTOLOGY
Breast lesions Number of cases Percentage
Non - neoplastic 32 7.6%
Neoplastic
Benign 287 67.9%
Malignant 104 24.5%
Total 423 100%
Out of the total 423 breast lesions 32 were non-neoplastic
comprising 7.6% of the total breast lesions. Out of the remaining 391
neoplastic cases benign lesions were 287 cases constituting 67.9%, while
the malignant lesions constituted 24.5% with 104 cases as shown in Table
10 and Chart 2.
TABLE 11 DISTRIBUTION OF BENIGN AND
MALIGNANT LESIONS OF BREAST
Breast Lesions
(100 Cases)
Benign Lesions Malignant
lesions
Non-Proliferative
Proliferative
No. of cases 29 31 40
Percentage 29% 31% 40%
Out of the total 423 breast cytology cases 100 cases were randomly
chosen taking into account 40 malignant and 60 benign cases
encompassing both proliferative (31 cases) and non-proliferative lesions
CHART 1
CHART 2
DISTRIBUTION OF NONNEOPLASTIC LESIONS ON BREAST CYTOLOGY
0 500 1000 1500 2000 2500 3000 3500 4000
Total no of FNAC 1622 2132 0 50 100 150 200 250 300 350 400 450
Non - neoplastic 32
49
CHART 1
BREAST FNAC vs OTHER SITESDISTRIBUTION OF NON-NEOPLASTIC AND NEOPLASTIC LESIONS ON BREAST CYTOLOGY
May 2011- Dec 2011 Jan 2012-Oct 2012
Total
No of breast FNAC 172 2132 251 3754 423 May 2011 Jan 2012 Total
Benign Neoplastic Malignant
Neoplastic
Total 287
104
BREAST FNAC vs OTHER SITES
NEOPLASTIC AND NEOPLASTIC LESIONS ON BREAST CYTOLOGY
Dec 2011 Oct 2012 May 2011- Dec 2011
Jan 2012-Oct 2012
50
stained with AgNOR stain and examined meticulously for number
of AgNOR dots and their morphology within the nucleus of the aspirated
cells.
TABLE 12 DISTRIBUTION OF BENIGN LESIONS OF THE
BREAST
Benign
breast
lesions
(60 Cases)
Non-Proliferative
lesions
(Fibrocystic disease
/ Fibroadenosis)
Proliferative lesions
Epithelial
Hyperplasia
Atypical
Ductal
Hyperplasia
Intra
Ductal
Papilloma
No. of cases 29 18 11 2
Percentage 48.33% 30% 18.33% 3.34%
Out of the 60 cases of benign lesions 29 cases constituting 48.33%
fall in the group of non-proliferative lesions encompassing fibroadenosis /
fibrocystic disease. The remaining 31 cases fall into the group of
proliferative breast lesions with 18 cases of epithelial hyperplasia
constituting 30%, 11 cases of atypical ductal hyperplasia constituting
18.33% and 2 cases of intra ductal papilloma constituting 3.34%. These