subtropical catchments?
Cassandra S. James1,2, Stephen J. Mackay1,3, Angela H. Arthington1, Samantha J. Capon1, Anna Barnes1& Ben Pearson4
1Australian Rivers Institute, Griffith University, Nathan, Qld 4111, Australia
2Centre for Tropical Water & Aquatic Ecosystem Research (TropWATER), James Cook University, Townsville, Qld 4811, Australia
3Department of Natural Resources and Mines, Water Services, PO Box 5318, Townsville, Qld 4810, Australia
4Hydrobiology Pty Ltd, Toowong, Qld 4066, Australia
Keywords
ELOHA, environmental flows, flood disturbance, hydrological modification, plant ecology, riparian forests, river management.
Correspondence
Cassandra S. James, TropWATER (Centre for Tropical Water & Aquatic Ecosystem Research), James Cook University, Townsville, Qld 4811, Australia.
Tel: +61 (0)7 47813172; Fax: +61 (0)7 47815589
E-mail: [email protected]
Funding Information
National Water Commission.
Received: 26 January 2016; Revised: 14 May 2016; Accepted: 16 May 2016
doi: 10.1002/ece3.2249
Abstract
The primary objective of this study was to test the relevance of hydrological classification and class differences to the characteristics of woody riparian vege-tation in a subtropical landscape in Queensland, Australia. We followed classifi-cation procedures of the environmental flow framework ELOHA – Ecological Limits of Hydrologic Alteration. Riparian surveys at 44 sites distributed across five flow classes recorded 191 woody riparian species and 15, 500 individuals. There were differences among flow classes for riparian species richness, total abundance, and abundance of regenerating native trees and shrubs. There were also significant class differences in the occurrence of three common tree species, and 21 indicator species (mostly native taxa) further distinguished the vegeta-tion characteristics of each flow class. We investigated the influence of key dri-vers of riparian vegetation structure (climate, depth to water table, stream-specific power, substrate type, degree of hydrologic alteration, and land use) on riparian vegetation. Patterns were explained largely by climate, particularly annual rainfall and temperature. Strong covarying drivers (hydrology and cli-mate) prevented us from isolating the independent influences of these drivers on riparian assemblage structure. The prevalence of species considered typically rheophytic in some flow classes implies a more substantial role for flow in these classes but needs further testing. No relationships were found between land use and riparian vegetation composition and structure. This study demonstrates the relevance of flow classification to the structure of riparian vegetation in a sub-tropical landscape, and the influence of covarying drivers on riparian patterns. Management of environmental flows to influence riparian vegetation assem-blages would likely have most potential in sites dominated by rheophytic spe-cies where hydrological influences override other controls. In contrast, where vegetation assemblages are dominated by a diverse array of typical rainforest species, and other factors including broad-scale climatic gradients and topo-graphic variables have greater influence than hydrology, riparian vegetation is likely to be less responsive to environmental flow management.
Introduction
The overriding influence of flow regime on riverine and riparian ecosystems has become a central axiom in fresh-water ecology and the management of riverine systems (Poff et al. 1997; Bunn and Arthington 2002). Restoration efforts that aim to conserve and enhance riparian
ecologists have proposed a new framework, the Ecological Limits of Hydrologic Alteration (ELOHA), designed to develop flow–ecology relationships for streams and rivers of contrasting hydrological character as determined by flow regime classification (Poff et al. 2010). The ELOHA frame-work is based on the premise that flow is a key determi-nant of the ecological characteristics of rivers and their riparian zones and that ecological character should there-fore vary spatially in relation to the hydrological character-istics of distinctive flow regime classes (e.g., Mackay et al. 2014; Rolls and Arthington 2014). Ecological characteris-tics of river segments within each flow class are expected to be relatively similar and to differ from the ecological char-acteristics of river segments in other hydrological classes (Arthington et al. 2006). Accordingly, hydrological classes should be important in explaining variation in ecological patterns (McManamay et al. 2015). Patterns of similarity and difference in the ecological characteristics of hydrolog-ical classes have been the subject of recent studies (Chin-nayakanahalli et al. 2011; Rolls and Arthington 2014; McManamay et al. 2015). However, the relevance of hydrological classification and class differences to a broader range of aquatic and riparian biota and landscape settings has not been tested.
Hydrology is widely recognised as the principal driver of riparian vegetation composition and structure through-out the world (Nilsson and Svedmark 2002; Naiman et al. 2005). Riparian species’ pools commonly reflect a combi-nation of plant tolerances to the stresses imposed by sur-face water flow regimes, their capacity to capitalize on the subsidies provided by flow and their ability to regenerate after hydrologic disturbance (Naiman and Decamps 1997). Riparian vegetation assemblages vary mainly in relation to flow as well as geomorphology, which together largely determine patterns of water availability and fluvial disturbance (Merritt et al. 2010; Bendix and Stella 2013). Consequently, flow modification, such as that resulting from dams, is often associated with changes in riparian vegetation which, given its functional importance in the landscape, can have significant environmental and socioe-conomic ramifications across multiple scales (Capon et al. 2013). Understanding the relevance of hydrological classi-fication and class differences to the structure of riparian communities is potentially just as important to imple-mentation of the ELOHA framework as studies focused entirely on in-stream biota (e.g., fish, McManamay et al. 2012; Rolls and Arthington 2014; McManamay et al. 2015).
Although hydrological classification and the influence of class differences on flow–ecology relationships form the main platform of the ELOHA framework, the “hydro-logical foundation” can be extended to include a geomor-phic subclassification as a further means to understand
the main environmental influences on riverine and ripar-ian communities (Poff et al. 2010). Furthermore, other environmental factors (e.g., climatic variables such as temperature and rainfall, topography, physical channel characteristics, hydraulic conditions, and substrate type) and the catchment context may also influence variation in riparian vegetation. The information gained by incor-porating potentially confounding variables into flow– ecol-ogy relationships is not part of the ELOHA framework, but is beginning to be explored in recent studies (e.g., McManamay et al. 2013; Arthington et al. 2014).
The catchment context may be particularly important because environmental flow management frequently occurs in highly modified agricultural and urban regions, where riparian vegetation frequently represents the sole native vegetation remaining in the landscape (Maison-neuve and Rioux 2001). Often persisting as thin and frag-mented strips, riparian vegetation within such landscapes is likely to be vulnerable to a wide range of anthropogenic pressures associated with the direct effects of human activities in the riparian zone (e.g., clearing, grazing, cropping, and burning) as well as indirect effects of land uses in surrounding catchments (e.g., pollution from agrochemicals, invasion by pastoral species, and changes to runoff and sediment transport patterns; Richardson et al. 2007; Bowers and Boutin 2008). Such pressures can result in greater cover of exotic species, reduced native species diversity, altered plant density, or disrupted suc-cessional patterns (e.g., Johnson 1999; Corbacho et al. 2003; Aguiar and Ferreira 2005; Lopez et al. 2006; Bruno et al. 2014). The role of flow in structuring riparian vege-tation in highly modified landscapes may therefore be masked, diminished, or amplified by many anthropogenic pressures and their effects. Nevertheless, environmental flow management has the potential to promote improve-ments in riparian condition and river health even where land use has an overwhelming influence on riparian ecol-ogy (Johnson 1999). If the ELOHA framework is to have broad-scale applicability, its utility and the assumptions that underpin it need to be tested within modified land-scapes to guide decision-making. Studies of flow–ecology relationships rarely address the influence of catchment modification and land use change (Stewart-Koster et al. 2010; Arthington et al. 2014). Indeed, in many cases, study designs actively avoid potentially confounding effects of land use on flow regimes and riparian/aquatic ecosystems.
address the primary study objective, we used two approaches. Firstly, we examined how riparian vegetation metrics and assemblages varied across a flow classification for the southeast Queensland region (Mackay et al. 2014). We selected riparian metrics describing species diversity, successional stage, exotic status, and regeneration as these metrics describe key characteristics of riparian vegetation and have tangible links to flow and flow regime change (Nilsson and Svedmark 2002). Secondly, we investigated to what extent any observed riparian patterns among the hydrological classes could be attributed to other drivers of riparian assemblage structure that may covary with flow class. We selected additional variables describing the physical environment (climate, rainfall, topography, hydraulic conditions, and substrate type) and two pres-sures (land use and degree of hydrological alteration) because of their potential to influence riparian vegetation. Riparian zones of subtropical catchments are highly dynamic and prone to fluvial disturbance because of their strongly seasonal stream flows and the occurrence of intense rainfall events during the year. We therefore included a descriptor of fluvial disturbance (specific stream power) reasoning that this is likely to be a key mechanism via which flow influences riparian vegetation in the region. Degree of hydrological alteration was included as a potential covariant to take account of the fact that one hydrological class was composed mainly of streams with flow patterns modified by upstream dams, and most streams we studied had experienced minor changes in some flow characteristics compared to mod-eled predevelopment flows.
Methods
Study area
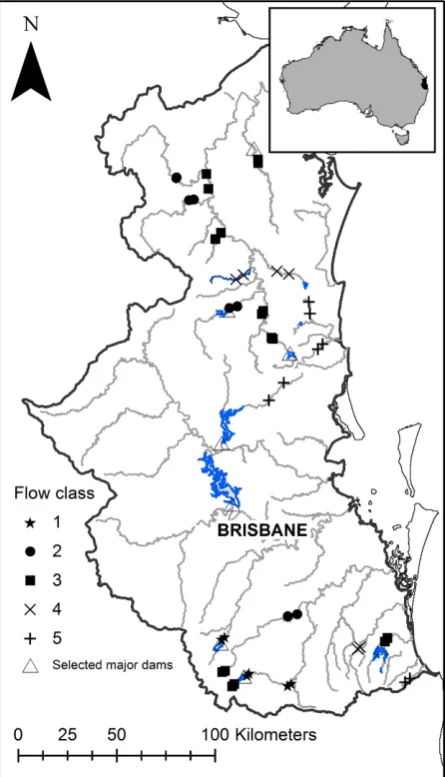
The study was conducted in southeast Queensland, Aus-tralia (Fig. 1). Climatically, the region is subhumid and subtropical. Rainfall occurs throughout the year but decli-nes strongly along an east–west gradient with mean annual rainfall ranging from 1400 mm on the coast to 800 mm inland (Bridges et al. 1990). The region com-prises seven major river catchments. Higher mean annual runoff per unit area occurs in the eastern coastal catch-ments. Due to the irregularity of rainfall across the region, flow regimes in all of the region’s rivers and streams are highly variable but generally have late sum-mer–early autumn high discharge regimes, with periods of low discharge and intermittent zero flows occurring from August to November (Pusey et al. 2004).
The region exhibits considerable topographic and geo-morphologic variation and is associated with complex geology and soils. Distinct topographic areas in the region
include coastal plains, river floodplains, and large estuar-ies in the east and foothills and mountains with plateaux over 300 m a.s.l. to the west, north, and south. Land use in the region is predominantly agricultural (~60% of land area), mainly comprising grazing on relatively natural pastures. Much of the region has also been extensively cleared of native vegetation, mostly by the 1940s, but with clearing continuing in recent decades (Bradshaw 2012).
[image:3.595.305.528.71.460.2]flow regimes from predevelopment conditions include a loss of natural flow diversity and an increase in the dura-tion of low flow spells (Mackay et al. 2014).
Site selection
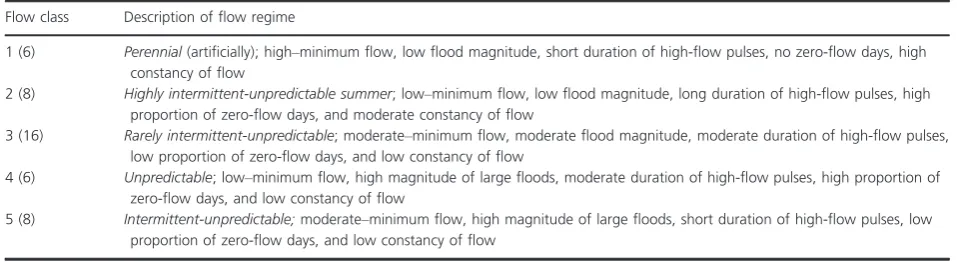
Sites were selected as part of a regional trial of the ELOHA framework that also considered flow–ecology relationships for fish and aquatic vegetation (Arthington et al. 2012, 2014; Mackay et al. 2014). To provide the “hydrological foundation” of this trial, a classification of historic flow regimes was conducted using stream gauge data with an average of 25 years of flow record and a minimum of 15 years of record within the period 1975– 2000. This analysis and the terminology used to describe the different flow classes (Table 1) are based on a national hydrologic classification (Kennard et al. 2010). The analysis of Mackay et al. (2014) identified five flow classes across the region (Table 1). Classification was undertaken using model-based hierarchical agglomerative clustering based on Gaussian finite mixture models, as implemented in the Mclust package for R (R Core Development Team 2010). Flow classes were distin-guished from each other mainly by hydrologic metrics associated with flow magnitude, duration of high-flow pulses, number of zero-flow days, and the constancy of mean daily flow (calculated using Colwell’s index of constancy Colwell 1974) (details of the flow classification procedure are provided in Mackay et al. 2014). In broad terms, these classes can be described as perennial (class 1), rarely intermittent (class 3), intermittent (class 4, 5), and highly intermittent (class 2). Flow classes 2–5 reflect similar “reference” flow classes developed from modeled predevelopment hydrologic data, while flow class 1 is an artificial flow class reflecting river regulation by dams and other flow modifications (Table 1; Mackay et al. 2014).
We selected 44 sites, spread across the five flow classes, based on proximity to stream gauges, accessibility, and
limited direct modification of riparian vegetation from activities such as clearing, burning, and/or grazing (Fig. 1). All sites were positioned in mid- and lowland stream reaches of <300 m elevation, and regulated and nonregulated reaches were included. While we excluded sites that had been directly impacted by clearing in the last 20–30 years, all of our sites had more than 24% (and up to 92%) of their catchment area subject to agricultural activity. To minimize within-site variation in stream mor-phology, geology, and adjacent land use, but still include multiple in-stream habitats, field sites comprised 100 m long stream reaches.
Data collection
Vegetation survey
We surveyed woody riparian vegetation in three randomly positioned 5-m-wide belt transects at each site. All tran-sects were located on the same bank so that land use impacts were similar within a site. Up to three additional transects were surveyed at three sites due to very low plant densities (i.e., <100 individuals) in initial transects. Transects extended up to 70 m from the water’s edge to the edge of the riparian vegetation. In the few cases where land use change did not occur within 50 m of the water’s edge, landform change (e.g., a distinct change in bank slope) was used to delineate the upland extent of each transect. Transects ranged from 12.5 to 69 m with a med-ian length of 32.4 m. We recorded the presence and diameter at breast height (dbh) of all trees and shrubs >50 cm tall within each belt transect. Field work was undertaken between 2008 and 2010.
Environmental variables
[image:4.595.63.542.569.700.2]To characterize the substrate at each site, we collected soil samples along each transect at the stream edge, midway along the transect, and bankfull (i.e., the point at which
Table 1. Descriptions of flow regimes characterizing flow classes for rivers of subtropical southeast Queensland (adapted from Rolls and Arthington 2014). Values in brackets indicate the number of sites in each class.
Flow class Description of flow regime
1 (6) Perennial(artificially); high–minimum flow, low flood magnitude, short duration of high-flow pulses, no zero-flow days, high constancy of flow
2 (8) Highly intermittent-unpredictable summer; low–minimum flow, low flood magnitude, long duration of high-flow pulses, high proportion of zero-flow days, and moderate constancy of flow
3 (16) Rarely intermittent-unpredictable; moderate–minimum flow, moderate flood magnitude, moderate duration of high-flow pulses, low proportion of zero-flow days, and low constancy of flow
4 (6) Unpredictable; low–minimum flow, high magnitude of large floods, moderate duration of high-flow pulses, high proportion of zero-flow days, and low constancy of flow
water begins to overflow onto a floodplain or surround-ing landscape; Rosgen 1996). Additional soil samples were taken where cross-sections intersected other distinct land-forms (e.g., benches and bars), although these were not common at the selected sites. A hydrometer was used to determine the proportion of silt, clay, and sand in each sample, and mean values were calculated for the site. Mean annual temperature and mean annual rainfall for each site were determined from national datasets (Bureau of Meteorology 2009; Stein et al. 2009).
We used bank height above the waterline, measured via two or three cross-sectional surveys with an optical level at each site, as a proxy for depth to the water table because groundwater can have a significant influence on riparian vegetation assemblages. To characterize the degree of fluvial disturbance and therefore the potential for mechanical damage to plants (Bendix 1999), we also calculated stream-specific power (SSP, W/m2) for each site using the formula SSP=yQS/w, where y is the unit weight of water (9800 N/m3), Q is discharge (m3/sec), S is energy slope (m/m) approximated by bed slope, and w is channel bankfull width (m) (Bizzi and Lerner 2015). We used the 2-year annual return interval (ARI) floods as the reference discharge as this is approximately equal to bankfull discharge (Wharton 1995). The 2-year ARI floods may not reach all the riparian vegetation at every site; however, this ARI is highly correlated with larger flood magnitudes (i.e., correlation between 2-year and 10-year ARI>0.99) and it is therefore unlikely to affect the overall results. Stream slope and channel bankfull width were obtained from field surveys using an optical level and stave except for three sites for which channel slope was estimated from 25,000 scale mapping due to con-straints accessing sites.
We determined the proportion of each site’s catchment under agriculture using land use data from the Queens-land Land Use Mapping Program, generated from 1999 baseline surveys (Witte et al. 2006). Draft updates avail-able from 2006 land use surveys for the Maroochy and Logan–Albert were also incorporated (DERM 2010). Because land use closer to streams may have a dispropor-tionate influence on stream condition relative to distal land uses, we calculated an inverse-distance weighting (d +1) 1metric following Peterson et al. (2011).
We also determined the degree of hydrologic alteration for each site, represented by a Gower dissimilarity metric which was based on the difference between modeled pre-development (i.e., natural) flows and historic (gauged) flows as described by Mackay et al. (2014). Modeled, nat-ural flow data were unavailable for four sites but as none of these were regulated, flow modification at these sties was assumed to be similar to nearby nonregulated streams.
Data analysis
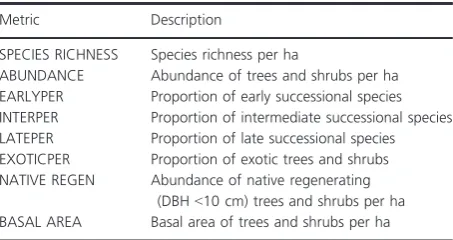
We calculated vegetation metrics based on the cumulative survey data for each site (Table 2). We determined spe-cies richness and abundance per hectare (ha) (Table 2). Each species was assigned a successional stage character-ized as early (E), intermediate (M), or late (L) and com-binations of these stages, that is, where the species occurred in more than one successional stage, as EM, ML, or EML, following Kanowski et al. (2010). Propor-tions of individuals classified as early, intermediate, and late successional stages were determined as a percentage of the total abundance. Because many species are classi-fied as combinations of these stages, the total percentage of early, intermediate, and late can sum to more than 100%. Proportions of exotic trees and shrubs were deter-mined for each site. Trees with a dbh≤10 cm were all categorized as regenerating (Kariuki and Kooyman 2005). Vegetation metrics and assemblage data were calculated for both the whole transect length, hereafter “bankfull”, and for the “near-stream” zone which included the tran-sect area <5 m from the water’s edge because regional floristic surveys suggest that is where most rheophytic species are confined.
We used Kruskal–Wallis tests followed by multiple post hoc comparison tests using the kruskalmc function of the pgirmess package in R which implements the method of Siegel and Castellan (1988) to examine differences in vege-tation metrics and common species’ abundances (i.e., spe-cies occurring at more than 20 sites) across flow classes.
[image:5.595.303.530.577.697.2]To assess the effects of hydrological class on vegetation assemblages, we conducted permutational multivariate analysis of variance using Bray–Curtis distance matrices with the Adonis function in R’s “vegan” package (Oksa-nen et al. 2010). Prior to this analysis, species abundance data were log10(x+1)-transformed and rare species (i.e., those occurring in less than three sites) removed. Permu-tational multivariate analysis of variance is sensitive to heterogeneity in dispersion particularly for unbalanced
Table 2. Metrics describing characteristics of woody riparian vegetation in streams of subtropical southeast Queensland.
Metric Description
SPECIES RICHNESS Species richness per ha
ABUNDANCE Abundance of trees and shrubs per ha EARLYPER Proportion of early successional species INTERPER Proportion of intermediate successional species LATEPER Proportion of late successional species EXOTICPER Proportion of exotic trees and shrubs NATIVE REGEN Abundance of native regenerating
designs (Anderson and Walsh 2013) so we explored dif-ferences in dispersion between flow classes using the PERMDISP test for homogeneity of dispersions (Ander-son 2006). We also calculated the indicator values of spe-cies for each flow class as the product of the relative frequency and relative average abundance in flow classes. Indicator value is maximized (i.e., 1) when all individuals of a species are found in a single flow class (high fidelity) and when the species occurs in all sites in that class (high constancy). This analysis was conducted using Dufrene– Legendre indicator species analysis with the indval function in the “Labdsv” package of R. Differences in assemblages across flow classes were visualized using non-metric multidimensional scaling (nMDS) based on Bray– Curtis distance matrices in the “Vegan” package of R.
We explored relationships between vegetation metrics and the nonflow environmental variables using the glmulti package in R (Calcagno and de Mazancourt 2010). This approach uses linear modeling to fit all possible models which are then compared using Akaike’s information crite-rion (AICc) adjusted for small sample size. We restricted our model selection to main effects only, due to the rela-tively small number of sites, and compared models using the AICc criterion. We discarded all models with parameter coefficients that were not found to be different from zero (P<0.05). We assumed a Gaussian distribution for all response variables apart from proportional data (succes-sional stages and exotics as a proportion of total individu-als) for which we used the binomial family with a logit link function. All data sets were checked to make sure they fitted the assumptions of linear models and transformed where necessary. Environmental predictors were standardized. Square root transformation was applied to species richness, the total abundance of trees and shrubs, the abundance of regenerating native, and the basal area of trees and shrubs. Variance inflation factors (VIF) were employed to check for model fit and collinearity among the predictors. As none of the VIF’s inspected exceeded 2, the standardized regression coefficients were assumed to be reliable estimates.
To explore relationships between environmental vari-ables and assemblage structure, we first used the BIO-ENV procedure in the “Vegan” package in R to identify the best subset of environmental variables, including flow class that minimized the Gower distances of scaled envi-ronmental variables to have the maximum rank correla-tion with the community dissimilarity matrix (Clarke and Ainsworth 1993). Gower distances were used because the environmental variables included both quantitative and categorical predictors (i.e., flow class). We then used redundancy analysis (RDA) implemented with the “var-part” function in R to partition variance in assemblage composition explained by flow and nonflow environmen-tal metrics. This is a constrained ordination method
which does not attempt to explain all the variation but only the part that can be explained by the used con-straints (parameters). We grouped climate variables (an-nual rainfall and mean an(an-nual temperature), hydrological variables (flow class, specific stream power, degree of hydrological alteration, and bank height as a surrogate for depth to the water table), and land use (distance-weighted proportion of modified land use) for this analysis. We applied a Hellinger transformation following Legendre and Gallagher (2001) that allows data that have nonlinear response to be analyzed using RDA and also allows the use of adjusted R values to account for the different num-bers of variables in the environmental predictor groups (Peres-Neto et al. 2006). All analysis was performed in R version 3.1.1 (R Development Core Team 2010).
Results
Over 15,500 trees and shrubs were identified and recorded across the 44 survey sites representing 191 tree and shrub species (Table S1). The most diverse sites on Currumbin Creek (the southern limit of the study area and adjacent to the New South Wales border), Amamoor Creek and Yabba Creek (the Mary River catchment), and the Stanley River (western headwaters of the Brisbane catchment) had 49, 45, 45, and 44 tree and shrub species, respectively. The most abundant native species were Ficus coronata(Sandpaper Fig),Castanospermum australe(Black Bean),Cryptocarya triplinervis(Three Veined Laurel), and Syzygium floribundum (Weeping Lilly Pilly). Exotic taxa comprised 26.5% of all individuals recorded. The most abundant exotic species were Celtis sinensis (Chinese Elm), Lantana camara (Lantana), Leucaena leucocephala (Leucaena), Cinnamomum camphora (Camphor Laurel), and Ligustrum lucidum(Broad-leaved Privet). Densities of trees and shrubs per ha ranged from just under 1000 trees and shrubs per ha (Burnett Creek site 27) to over 21,500 (Teviot Brook). The extremely high tree and shrub den-sity recorded at Teviot Brook was due to a very large number of Celtis sinensisrecruits, hence this site also had the highest density of exotic tree regeneration (>20,000 per ha). Proportions of trees belonging to the different successional stages (E, M, L) varied considerably across the sites. Overall, early successional stage species com-prised around 24% of all individuals recorded, while intermediate and late successional stage species comprised 42% and 33%, respectively.
Relationships between flow class and vegetation
regenerating native trees and shrubs (Figure S1). No sig-nificant pairwise differences were detected at the P<0.005 significance level (a conservative adjusted P value to take into account of the multiple comparisons); however, there were pairwise differences at the P <0.05 level in species richness and abundance. Sites in flow class 5 had higher species richness and abundance than sites in flow class 1, and higher species richness than sites in flow class 2. Significant differences between flow classes were also detected in the distribution of three common tree species; Melaleuca viminalis, Casuarina cunninghamiana, and Streblus brunonianus (Figure S2).C. cunninghamiana was relatively common in flow class 1 (artificial perennial class containing regulated streams, Table 1) but virtually absent from flow class 5 (intermittent, unpredictable flows, Table 1), while S. brunonianus was common in flow class 3 (rarely intermittent, unpredictable flows, Table 1) but relatively uncommon in both flow class 1 and 5. Significant pairwise differences were only found, however, for M. viminalis between flow classes 2 and 5 with this species significantly less common in the latter class (P< 0.005). No significant differences were found across flow classes for proportion of different successional stages, proportion of woody exotic species, or basal area.
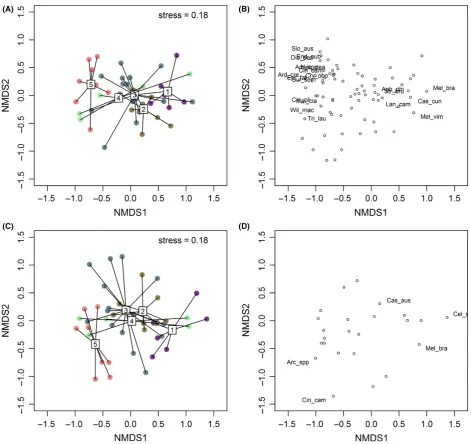
Based on the permutational multivariate analysis of variance, an effect of flow class was detected for both bankfull (F4,39=3.66, P=0.001) and near-stream
(F4,39 =2.63,P=0.001) vegetation assemblages. This was
also evident in the nMDS ordination (Fig. 2) where sites belonging to flow classes 1 and 5 were generally well sepa-rated in ordination space. Sites in flow classes 2, 3, and 4, however, were less well separated and showed a high degree of overlap. Site dispersion within each flow class did not differ significantly between classes, suggesting that the vegetation differences detected between them were due to means rather than within-class variation. Twenty-one indicator species, mostly native taxa, distinguished between vegetation assemblages of each flow class (Fig. 2; Table S2). Most of these indicator species were associated with flow class 5, four species including one exotic spe-cies,Celtis sinensis,were associated with flow class 1 (arti-ficial flow class), two native species and one exotic species, Lantana camara, were associated with flow class 2, and one species was associated with flow class 3 (Stre-blus brunonianus).
Do other environmental variables vary across flow classes?
Other environmental variables were found to vary signifi-cantly across flow classes (i.e., annual rainfall, mean annual temperature, sand, clay, stream-specific power (SSP), and land use modification; Figure S3). At the
P<0.005 significance level (a conservative adjusted P value to take into account of the multiple comparisons), there were pairwise differences across flow classes for annual rainfall, mean annual temperature, proportion of clay in substrate, and SSP. Annual rainfall was signifi-cantly higher for sites in flow class 5 compared with sites in flow classes 1 or 2. Proportion of clay was significantly higher in flow class 5 compared with flow class 2 and SSP significantly higher in flow class 3 compared with flow class 2. No significant differences across flow classes were found for bank height (a proxy for depth to the water table) or the Gower metric (as a measure of overall flow modification), although the latter tended to be higher for sites in flow class 1 (the class containing mostly regulated sites) compared to the other flow classes.
Relationships between nonflow
environmental variables and vegetation
Linear models with significant parameter coefficients were identified for four of the riparian metrics and their near-stream counterparts using an exhaustive search of all main effects; species richness, abundance, regeneration of native species, and basal area. All but one of the best models returned included annual rainfall with a signifi-cant coefficient (Table 3). Annual temperature was also significant for species richness and abundance of native regeneration, while bank height and proportion of clay were only significant for species richness and basal area of near-stream trees and shrubs, respectively (Table 3). None of the remaining environmental variables (i.e., proportion of sand, stream-specific power, land use, or flow modifi-cation) were significant parameters in the returned models.
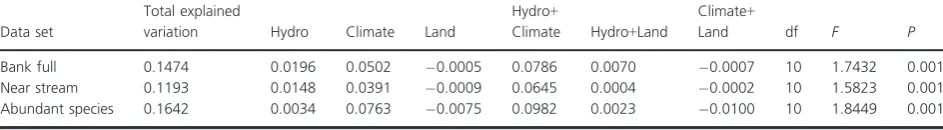
selected for modeling explained less (12%) (Table 4). This proportion rose slightly to 16% when only common spe-cies were analyzed. For all partitioning, the climate vari-ables independently explained more variation than the hydrology variables independently (Table 4). Land use variables did not explain any of the variation in assem-blage structure. The variation shared between hydrology and climate was greater than that of any of the variable groups independently.
Discussion
[image:8.595.67.539.66.510.2]Arthington 2014; McManamay et al. 2015); yet to our knowledge, the relevance of hydrological classification and class differences to riparian vegetation communities has not been tested.
Riparian vegetation of subtropical southeast Queens-land associated with drier, inQueens-land streams was character-ized by a relatively small suite of species, whereas rainforest sites, which were particularly prevalent along coastal creeks and in the northern Mary River catchment (Fig. 1), were typified by a diverse assemblage of rain-forest species, including many not usually considered to be obligate riparian plants. Many of the most common species recorded in the riparian zones (e.g., Cryptocarya triplinervis) are not usually considered rheophytic and occur across a range of terrestrial habitats, suggesting fac-tors other than flow are likely to be significant in deter-mining their distributions and abundance.
In southeast Queensland, differences in riparian charac-teristics among classes were evident for riparian species richness, abundance, and abundance of regenerating native trees and shrubs. There were also significant differ-ences in the occurrence of three common tree species; Melaleuca viminalis,Casuarina cunninghamiana,and Stre-blus brunonianus between flow classes. An effect of flow
[image:9.595.58.531.94.220.2]class was detected for both bankfull and near-stream veg-etation assemblages, and 21 indicator species (mostly native taxa) distinguished between vegetation assemblages of each flow class. These findings suggest that variations in stream flow across the major coastal-inland, wet-dry gradient of our study area influenced the distribution, richness, and composition of riparian vegetation. How-ever, the variation between flow classes in structural vege-tation metrics and overall vegevege-tation assemblages could also be explained by nonflow metrics that varied across flow classes. Climate, particularly annual rainfall which covaried strongly with flow class, was found to be a sig-nificant parameter in best models for species richness, vegetation abundance, native woody vegetation regenera-tion, and basal area as well as independently explaining a higher proportion of variation in assemblage structure relative to hydrology or land use. Mean annual tempera-ture also emerged as a significant driver of overall ripar-ian vegetation assemblages, species richness, and native regeneration, further emphasizing the critical influence of regional climatic variation on riparian vegetation. Because of the strong covariation between rainfall and hydrologi-cal class, it is not possible to draw any strong conclusions regarding the relative importance of flow versus climate. Table 3. Results of linear models showing significant parameters in the best models for riparian metrics for full bank and near-stream (with suffix NS) vegetation of subtropical southeast Queensland.
Riparian metric
Mean annual rainfall
Mean annual
temperature Bank height Proportion of clay
Estimate SE Estimate SE Estimate SE Estimate SE
SPECIES RICHNESS 0.0347*** 0.009 0.0238** 0.0085 0.0178 0.009
ABUNDANCE 12.933** 3.824
NATIVE REGEN 13.904*** 3.314 6.708** 3.824
BASAL AREA 0.631* 0.299
SPECIES RICHNESS NS 0.047*** 0.012
NATIVE REGEN NS 10.207* 4.020
BASAL AREA NS 0.199** 0.068
***P<0.001,**P<0.01,*P<0.05.
Table 4. Partitioning of variation in redundancy analysis for different riparian vegetation data sets. Given are the adjusted R squared for the testa-ble fraction, the df (degrees of freedom) and theF- andP-values for all full bank data set, the near-bank dataset, and abundant species (those species occurring in 20 or more sites) in the full bank data set. Fraction [Hydro]=variation dependent upon hydrological variables alone; fraction [Climate] variation dependent upon the climate variables alone; fraction [Land] variation dependent upon land use modification alone; fraction [Hydro+Climate] variation shared between hydrology and climate; fraction [Hydro+Land] variation shared between hydrology and land use; frac-tion [Climate+Land] variation shared between climate and land use.
Data set
Total explained
variation Hydro Climate Land
Hydro+
Climate Hydro+Land
Climate+
Land df F P
Bank full 0.1474 0.0196 0.0502 0.0005 0.0786 0.0070 0.0007 10 1.7432 0.001
Near stream 0.1193 0.0148 0.0391 0.0009 0.0645 0.0004 0.0002 10 1.5823 0.001
[image:9.595.57.529.327.392.2]However, the prevalence of rheophytic species in some flow classes (e.g., 1 and 2) and their virtual absence from other flow classes (flow class 5) implies a comparatively greater role for hydrology in the former which needs fur-ther testing.
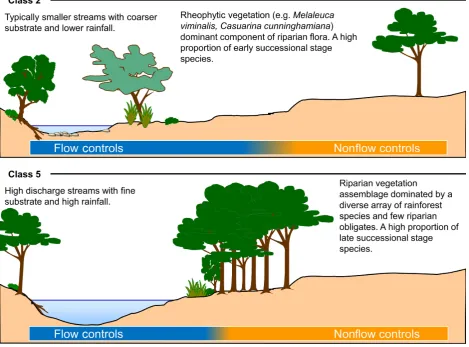
In Figure 3, we provide a conceptualization of the rela-tive influences of flow versus other broad-scale drivers (e.g., climate) using sites from two contrasting flow classes; class 2 and class 5 (Table 1). Sites in flow class 2 are typically smaller streams with coarser substrates and lower rainfall than those in flow class 5 which are high discharge streams with typically clay-dominated substrates and high rainfall. The vegetation in these groups also con-trasts strongly with rheophytic species tending to be a more dominant component of the vegetation of sites in flow class 2 (Fig. 3). Under this framework, management of flows to influence riparian vegetation assemblages would have most potential in those sites for which
hydrological influences override other controls, such as those in flow class 2. In contrast, for sites in flow class 5, with vegetation assemblages dominated by a diverse array of typical rainforest species, other factors including broad-scale climatic gradients and topographic variables are likely to have greater influence.
[image:10.595.69.539.316.663.2]Published analyses of riparian vegetation distribution patterns highlight the importance of broad-scale predic-tors such as climate, geology, and soils in providing the overriding controls on the distribution of riparian vegeta-tion at a broader landscape scale (e.g., Tabacchi et al. 1996; Dixon et al. 2002; Sarr and Hibbs 2007). Climate has a major influence on stream flow and on hydrological class membership (Chinnayakanahalli et al. 2011) and riparian vegetation (e.g., Alcaraz et al. 1997; Sarr and Hibbs 2007). The observed distribution patterns of ripar-ian vegetation in southeast Queensland are consistent with these broad-scale influences of climate and
hydrology; however, we also considered the influence of local environmental factors on riparian ecology.
At the local scale, riparian vegetation distribution pat-terns are typically zoned laterally along transverse gradi-ents with distance and height from the stream edge. These lateral vegetation distribution patterns reflect the relative tolerances of species to physical disturbances such as shear stresses associated with stream hydraulic condi-tions and chemical stresses (anoxia and chemical toxici-ties) associated with water-logged soils adjacent to streams and, the ability of species to acquire or intercept resources such as moisture (Lite et al. 2005), light (Hall 1998; Battaglia and Sharitz 2006), and nutrients (Kotowski et al. 2006) at different positions along the lat-eral gradient. Prior to this study, we hypothesized that fluvial disturbance is likely to be the main mechanism via which flow influences riparian vegetation in subtropical catchments because riparian zones in these landscapes are highly dynamic and prone to fluvial disturbance due to their strongly seasonal stream flows and the occurrence of intense rainfall events at various times during the year. Conversely, effects of flow on moisture provision to ripar-ian vegetation may be less important in subtropical catch-ments, where water is more plentiful throughout the year than it is in some other climatic regions. Our measure of fluvial disturbance (specific stream power), however, was not related to either bankfull nor near-stream vegetation assemblages. Furthermore, no relationship with specific stream power was found for any of the selected riparian metrics.
Studies in other climatic regions have also failed to show effects of fluvial disturbance on woody vegetation metrics (e.g., Lite et al. 2005), despite the strong concep-tual basis for assuming such relationships. Descriptions of stream power determination in the ecological literature, however, often belie the practical issues around estimating this parameter. Stream power estimates are highly sensi-tive to the energy slope and the distance over which this is calculated (Barker et al. 2009). It is possible that our field estimates of stream power based on local field slopes (determined over<600 m stream lengths) may be captur-ing too much local variation rather than the scale likely to influence riparian habitats (Jain et al. 2006).
Stronger relationships between flow and riparian vege-tation assemblages in southeast Queensland may be masked by flow modification and lagged responses of the vegetation to this disturbance. Many of the species recorded in our survey are relatively long-lived (i.e., >100 years). Consequently, their current distribution and abundance may reflect flow conditions prior to river reg-ulation and the period for which historical gauge records were available to develop flow classes (i.e., post 1975; Mackay et al. 2014). Although we included a measure of
flow modification in our analyses, this Gower metric rep-resents the full suite of changes in flow attributes that have occurred while, individually, these changes varied in relation to the type of dam, its location, and its opera-tional patterns (Mackay et al. 2014). In other words, the same Gower estimate can result from alterations in differ-ent flow attributes which may in turn trigger contrasting vegetation responses.
Somewhat surprisingly, given that our study area has experienced significant land use change over the period of human settlement and agricultural development (Brad-shaw 2012), we did not detect any effect on woody ripar-ian vegetation composition or structure of agricultural land use intensity (measured as proportional area) in the surrounding catchment. As all of the sites had a relatively large proportion of their catchment under agriculture (i.e., mostly >45% with only four sites having <45% of land use modified), it is possible that riparian vegetation assemblages may have been affected in similar ways by land use across the region. Our results imply that even sites within the least disturbed catchments may be affected by distal land uses and overall catchment modifi-cation in the region, potentially via macro-ecological pro-cesses, for example, teleconnections (McCluney et al. 2014). Land use intensity and associated changes in land cover especially are also very likely to have contributed, in addition to dams and weirs, to overall modification of flow regimes in the region and, in turn, its effects on riparian vegetation (Mackay et al. 2014).
Research on forest ecology in tropical and subtropical regions is hampered by their sheer complexity and diversity (Pyke et al. 2001). In riparian habitats, the challenges of conducting vegetation surveys are further compounded by the difficulty of acquiring complemen-tary hydrologic and hydraulic data as well as data for other significant environmental variables (e.g., soil type, land use, and clearance history) with which to interpret floristic patterns. As a result, relatively few studies have attempted to relate such a broad suite of potential dri-vers to riparian vegetation in subtropical catchments. Our results highlight some of the difficulties in deter-mining hydro-ecological relationships in these land-scapes, especially with regard to disentangling the effects of multiple, covarying drivers – in this case, climate and hydrology.
worthy of further investigation within ELOHA studies involving riparian vegetation. The information gained by incorporating potentially confounding variables into flow–ecology relationships is not part of the ELOHA framework, but has been explored in the fish component of the southeast Queensland study using a multivariate approach (e.g., Arthington et al. 2014). Controlled experi-ments, including those conducted as part of an adaptive management strategy, may be required, in addition to vegetation surveys, to better inform environmental flow planning in such complex riparian and riverine systems (Poff et al. 2003). A functional, trait-based approach to understanding vegetation patterns in relation to hydrol-ogy, flow classes, stream hydraulics, and other environ-mental drivers may also prove informative (Burton et al. 2009; Merritt et al. 2010).
This study has demonstrated the relevance of an ELOHA type flow classification to variation in the struc-ture of riparian vegetation across a subtropical landscape, and the importance of studying the influence of covarying drivers on riparian patterns. Our approach guided the development of a conceptual model that distinguishes the relative influence of flow versus other broad-scale drivers using sites from two contrasting flow classes. We suggest that management of environmental flows to influence riparian vegetation assemblages would have most poten-tial at sites dominated by rheophytic species for which hydrological influences likely override other controls. In contrast, where vegetation assemblages are dominated by a diverse array of typical rainforest species, other factors including broad-scale climatic gradients and topographic and soil variables have greater influence than hydrology, and the vegetation is likely to be less responsive to envi-ronmental flow management.
Acknowledgments
This work was funded by the National Water Commis-sion under the Raising National Water Standards (RNWS) program, hosted, and managed by the Interna-tional Water Centre (IWC). We particularly thank all the landowners for allowing access to field sites and Cia Mus-grove and the Queensland Department of Natural Resources and Mines for provision of flow data.
Conflict of Interest
None declared.
References
Aguiar, F. C., and M. T. Ferreira. 2005. Human-disturbed landscapes: effects on composition and integrity of riparian
woody vegetation in the Tagus River basin, Portugal.
Environ. Conserv. 32:30–41.
Alcaraz, F., S. Rios, C. Inocencio, and A. Robledo. 1997. Variation in the riparian landscape of the Segura River
Basin, SE Spain. J. Veg. Sci. 8:597–600.
Anderson, M. J. 2006. Distance-based tests for homogeneity of
multivariate dispersions. Biometrics 62:245–253.
Anderson, M. J., and D. C. I. Walsh. 2013. PERMANOVA, ANOSIM, and the Mantel test in the face of heterogeneous dispersions: what null hypothesis are you testing? Ecol.
Monogr. 83:557–574.
Arthington, A. H., S. E. Bunn, N. L. Poff, and R. J. Naiman. 2006. The challenge of providing environmental flow rules
to sustain river ecosystems. Ecol. Appl. 16:1311–1318.
Arthington, A. H., S. J. Mackay, C. S. James, R. J. Rolls, D. Sternberg, A. Barnes, et al. 2012. Ecological limits of hydrologic alteration: a test of the ELOHA framework in south-east Queensland. National Water Commission, Canberra, ACT, Australia.
Arthington, A. H., R. J. Rolls, D. Sternberg, S. J. Mackay, and C. S. James. 2014. Fish assemblages in subtropical rivers: low-flow hydrology dominates hydro-ecological
relationships. Hydrol. Sci. J. 59:594–604.
Barker, D. M., D. M. Lawler, D. W. Knight, D. G. Morris, H. N. Davies, and E. J. Stewart. 2009. Longitudinal
distributions of river flood power: the combined automated flood, elevation and stream power (CAFES) methodology.
Earth Surf. Proc. Land. 34:280–290.
Battaglia, L., and R. Sharitz. 2006. Responses of floodplain forest species to spatially condensed gradients: a test of the flood-shade tolerance tradeoff hypothesis. Oecologia
147:108–118.
Bendix, J. 1999. Stream power influence on southern
Californian riparian vegetation. J. Veg. Sci. 10:243–252.
Bendix, J., and J. C. Stella. 2013. Riparian vegetation and the
fluvial environment: a biogeographic perspective. Pp. 53–74
inJ. F. Shroder, D. R. Butler and C. R. Hupp, eds. Treatise
on geomorphology. Academic Press, San Diego, CA. Bizzi, S., and D. N. Lerner. 2015. The use of stream power as
an indicator of channel sensitivity to erosion and deposition
processes. River Res. Appl. 31:16–27.
Bowers, K., and C. Boutin. 2008. Evaluating the relationship between floristic quality and measures of plant biodiversity
along stream bank habitats. Ecol. Ind. 8:466–475.
Bradshaw, C. J. A. 2012. Little left to lose: deforestation and forest degradation in Australia since European colonization.
J. Plant Ecol. 5:109–120.
Bridges, E. M., D. J. Ross, and C. H. Thompson. 1990.Soils of
the Mary River alluvia near Gympie, Queensland. CSIRO Division of Soils, Divisional Report No. 109.
Bruno, D., O. Belmar, D. Sanchez-Fernandez, S. Guareschi, A. Millan, and J. Velasco. 2014. Responses of Mediterranean aquatic and riparian communities to human pressures at
Bunn, S. E., and A. H. Arthington. 2002. Basic principles and ecological consequences of altered flow regimes for aquatic
biodiversity. Environ. Manage. 30:492–507.
Bureau of Meteorology. 2009. Climate summary data, accessed from http://www.bom.gov.au/climate.
Burton, M. L., L. J. Samuelson, and M. D. Mackenzie. 2009. Riparian woody plant traits across an urban-rural land use gradient and implications for watershed function with
urbanization. Landsc. Urban Plan. 90:42–55.
Calcagno, V., and C. de Mazancourt. 2010. glmulti: An R package for easy automated model selection with
(generalized) linear models. J. Stat. Softw. 34:1–29.
Capon, S. J., L. E. Chambers, R. MacNally, R. Naiman, P. Davies, N. J. P. Marshall, et al. 2013. Riparian zones in the 21st Century: hotspots for climate change adaptation?
Ecosystems, 16:359–381.
Chinnayakanahalli, K. J., C. P. Hawkins, D. G. Tarboton, and R. A. Hill. 2011. Natural flow regime, temperature and the composition and richness of invertebrate assemblages in
streams of the western United States. Freshw. Biol. 56:1248–
1265.
Clarke, K. R., and M. Ainsworth. 1993. A method of linking multivariate community structure to environmental
variables. Mar. Ecol. Prog. Ser. 92:205–219.
Colwell, R. K. 1974. Predictability, constancy, and contingency
of periodic phenomena. Ecology 55:1148–1153.
Corbacho, C., J. M. Sanchez, and E. Costillo. 2003. Patterns of structural complexity and human disturbance of riparian vegetation in agricultural landscapes of a Mediterranean
area. Agric. Ecosyst. Environ. 95:495–507.
DERM. 2010. QLUMP-Queensland landuse mapping program with 2004 updates and 2006 draft updates. Department of Environment and Resource Management, Brisbane. Dixon, M. D., M. G. Turner, and C. F. Jin. 2002. Riparian tree
seedling distribution on Wisconsin River sandbars: controls
at different spatial scales. Ecol. Monogr. 72:465–485.
Hall, R. H. P. 1998. Flooding alters apparent position of
floodplain saplings on a light gradient. Ecology, 79:847–855.
Jain, V., N. Preston, K. Fryirs, and G. Brierley. 2006. Comparative assessment of three approaches for deriving stream power plots along long profiles in the upper Hunter River catchment, New South Wales, Australia.
Geomorphology 74:297–317.
Johnson, W. C. 1999. Response of riparian vegetation to streamflow regulation and land use in the Great Plains.
Great Plains Res. 9:357–369.
Kanowski, J., C. P. Catterall, K. Freebody, and D. Harrison. 2010. Monitoring revegetation projects in rainforest landscapes, toolkit version 3. Reef and Rainforest Research Centre Limited, Cairns.
Kariuki, M., and R. M. Kooyman. 2005. Floristic changes and regeneration patterns for a 12-year period during the 3rd and 4th decades following selection logging in a subtropical
rainforest. Austral Ecol. 30:844–855.
Kennard, M. J., B. J. Pusey, J. D. Olden, S. J. MacKay, J. L. Stein, and N. Marsh. 2010. Classification of natural flow regimes in Australia to support environmental flow
management. Freshw. Biol. 55:171–193.
Kotowski, W., W. Thorig, R. van Diggelen, and M. Wassen. 2006. Competition as a factor structuring species zonation in riparian fens - a transplantation experiment. Appl. Veg.
Sci. 9:231–240.
Legendre, P., and E. D. Gallagher. 2001. Ecologically meaningful transformations for ordination of species data.
Oecologia 129:271–280.
Lite, S. J., K. J. Bagstad, and J. C. Stromberg. 2005. Riparian plant species richness along lateral and longitudinal gradients of water stress and flood disturbance, San Pedro
River, Arizona, USA. J. Arid Environ. 63:785–813.
Lopez, L. E. M., K. A. Harper, and P. Drapeau. 2006. Edge influence on forest structure in large forest remnants, cutblock separators, and riparian buffers in managed black
spruce forests. Ecoscience 13:226–233.
Mackay, S. J., A. H. Arthington, and C. S. James. 2014. Classification and comparison of natural and altered flow regimes to support an Australian trial of the Ecological Limits of Hydrologic Alteration framework. Ecohydrology
7:1485–1507.
Maisonneuve, C., and S. Rioux. 2001. Importance of riparian habitats for small mammal and herpetofaunal communities
in agricultural landscapes of southern Quebec. Agric.
Ecosyst. Environ. 83:165–175.
McCluney, K. E., N. L. Poff, M. A. Palmer, J. H. Thorp, G. C. Poole, B. S. Williams, et al. 2014. Riverine
macrosystems ecology: sensitivity, resistance, and resilience of whole river basins with human alterations. Front. Ecol.
Environ. 12:48–58.
McManamay, R. A., D. J. Orth, C. A. Dolloff, and E. A. Frimpong. 2012. A regional classification of unregulated stream flows: spatial resolution and hierarchical frameworks.
River Res. Appl. 28:1019–1033.
McManamay, R. A., D. J. Orth, C. A. Dolloff, and
D. C. Mathews. 2013. Application of the ELOHA framework to regulated rivers in the Upper Tennessee River Basin: a
case study. Environ. Manage. 51:1210–1235.
McManamay, R. A., M. S. Bevelhimer, and E. A. Frimpong. 2015. Associations among hydrologic classifications and fish traits to support environmental flow standards.
Ecohydrology 8:460–479.
Merritt, D. M., M. L. Scott, N. L. Poff, G. T. Auble, and D. A. Lytle. 2010. Theory, methods and tools for determining environmental flows for riparian vegetation: riparian
vegetation-flow response guilds. Freshw. Biol. 55:206–225.
Naiman, R. J., and H. Decamps. 1997. The ecology of
interfaces: riparian zones. Annu. Rev. Ecol. Syst. 28:621–658.
Nilsson, C., and M. Svedmark. 2002. Basic principles and ecological consequences of changing water regimes: riparian
plant communities. Environ. Manage. 30:468–480.
Oksanen, J., F. G. Blanchet, R. Kindt, P. Legendre, R. B. O’Hara, G. L. Simpson, et al. 2010. Community Ecology Package “vegan”, version 1.17-2.
Peres-Neto, P. R., P. Legendre, S. Dray, and D. Borcard. 2006. Variation partitioning of species data matrices: estimation
and comparison of fractions. Ecology 87:2614–2625.
Peterson, E. E., F. Sheldon, R. Darnell, S. E. Bunn, and B. D. Harch. 2011. A comparison of spatially explicit landscape representation methods and their relationship to stream
condition. Freshw. Biol. 56:590–610.
Poff, N. L., J. D. Allan, M. B. Bain, J. R. Karr, K. L. Prestegaard, B. D. Richter, et al. 1997. The natural flow
regime. Bioscience 47:769–784.
Poff, N. L., J. D. Allan, M. A. Palmer, D. D. Hart, B. D. Richter, A. H. Arthington, et al. 2003. River flows and water wars: emerging science for environmental decision making.
Front. Ecol. Environ. 1:298–306.
Poff, N. L., B. D. Richter, A. H. Arthington, S. E. Bunn, R. J. Naiman, E. Kendy, et al. 2010. The ecological limits of hydrologic alteration (ELOHA): a new framework for developing regional environmental flow standards. Freshw.
Biol. 55:147–170.
Pusey, B. J., M. H. Kennard, and A. H. Arthington. 2004. Freshwater fishes of North-Eastern Australia. CSIRO Publishing, Collingwood, Australia.
Pyke, C. R., R. Condit, S. Aguilar, and S. Lao. 2001. Floristic composition across a climatic gradient in a neotropical
lowland forest. J. Veg. Sci. 12:553–566.
R Development Core Team. 2010. R: a language and environment for statistical computing. R Foundation for Statistical Computing, Vienna, Austria.
Richardson, D. M., P. M. Holmes, K. J. Esler, S. M. Galatowitsch, J. C. Stromberg, S. P. Kirkman, et al. 2007. Riparian vegetation: degradation, alien plant invasions, and
restoration prospects. Divers. Distrib. 13:126–139.
Rolls, R. J., and A. H. Arthington. 2014. How do low magnitudes of hydrologic alteration impact riverine fish populations and assemblage characteristics? Ecol. Ind.
39:179–188.
Rosgen, D. 1996. Applied river morphology. Wildland Hydrology, Pagosa Springs CO.
Sarr, D. A., and D. E. Hibbs. 2007. Woody riparian plant distributions in western Oregon, USA: comparing landscape
and local scale factors. Plant Ecol. 190:291–311.
Siegel, S., and N. J. C. J. Castellan. 1988. Non parametric statistics for the behavioural sciences. MacGraw Hill Int, New York, NY.
Stein, J. L., M. F. Hutchinson, B. J. Pusey, and M. J. Kennard 2009. Ecohydrological classification based on landscape and
climate data. Appendix 8. Pp. 1–56inB. Pusey, M.
Kennard, M. Hutchinson, F. Sheldon, J. Stein, J. Olden,&
S. Mackay, eds. Ecohydrological regionalisation of Australia: A Tool for Management and Science. Innovations Project GRU36, Final Report to Land and Water Australia, Canberra.
Stewart-Koster, B., S. E. Bunn, S. J. Mackay, N. L. Poff, R. J. Naiman, and P. S. Lake. 2010. The use of Bayesian networks to guide investments in flow and catchment restoration for impaired river ecosystems. Freshw. Biol.
55:243–260.
Tabacchi, E., A. M. Planty-Tabacchi, M. J. Salinas, and H. Decamps. 1996. Landscape structure and diversity in riparian plant communities: a longitudinal comparative
study. Regul. Rivers-Res. Manag. 12:367–390.
Wharton, G. 1995. The channel-geometry method - guidelines
and applications. Earth Surf. Proc. Land. 20:649–660.
Witte, C., vanden Berg D., T. Rowland, T. O’Donnell, R. Denham, G. Pitt, et al. 2006. Mapping land use in Queensland, technical report on the 1999 land use map for Queensland. Department of Natural Resources, Mines and Water, Brisbane.
Supporting Information
Additional Supporting Information may be found online in the supporting information tab for this article:
Figure S1. Box and whisker plots of riparian vegetation metrics across flow classes for rivers of subtropical south east Queensland.
Figure S2. Box and whisker plots of abundance of com-mon riparian species (per ha) across flow classes for rivers of subtropical south east Queensland.
Figure S3. Box and whisker plots of environmental vari-ables across flow classes for rivers of subtropical south east Queensland.
[image:14.595.65.301.60.622.2]Table S1. List of species recorded, their families and suc-cessional stage (assigned according to Kanowski et al. (2010).