Mihyun Hwang,aCornelia C. Bergmanna
aDepartment of Neurosciences, Lerner Research Institute, Cleveland Clinic Foundation, Cleveland, Ohio, USA
ABSTRACT The contribution of distinct central nervous system (CNS) resident cells to protective alpha/beta interferon (IFN-␣/) function following viral infections is poorly understood. Based on numerous immune regulatory functions of astrocytes, we evaluated the contribution of astrocyte IFN-␣/ signaling toward protection against the nonlethal glia- and neuronotropic mouse hepatitis virus (MHV) strain A59. Analysis of gene expression associated with IFN-␣/ function, e.g., pattern rec-ognition receptors (PRRs) and interferon-stimulated genes (ISGs), revealed lower basal mRNA levels in brain-derived astrocytes than in microglia. Although astrocytes poorly induced Ifn mRNA following infection, they upregulated various mRNAs in the IFN-␣/pathway to a higher extent than microglia, supporting effective IFN-␣/ re-sponsiveness. Ablation of the IFN-␣/ receptor (IFNAR) in astrocytes using mGFAPcre IFNARfl/fl mice resulted in severe encephalomyelitis and mortality, coincident with un-controlled virus replication. Further, virus spread was not restricted to astrocytes but also affected microglia and neurons, despite increased and sustainedIfn␣/and ISG mRNA levels within the CNS. IFN-␥, a crucial mediator for MHV control, was not im-paired in infected mGFAPcre IFNARfl/flmice despite reduced T cell CNS infiltration. Unexpectedly however, poor induction of IFN-␥-dependent major histocompatibility complex (MHC) class II expression on microglia supported that defective IFN-␥ sig-naling contributes to uncontrolled virus replication. A link between sustained ele-vated IFN-␣/ and impaired responsiveness to IFN-␥ supports the novel concept that temporally limited early IFN-␣/ responses are critical for effective antiviral IFN-␥function. Overall, our results imply that IFN-␣/ signaling in astrocytes is not only critical in limiting early CNS viral spread but also promotes protective antiviral IFN-␥function.
IMPORTANCE An antiviral state established by IFN-␣/ contains initial viral spread as adaptive immunity develops. While it is apparent that the CNS lacks professional IFN-␣/ producers and that resident cells have distinct abilities to elicit innate
IFN-␣/ responses, protective interactions between inducer and responder cells require further investigation. Infection with a glia- and neuronotropic coronavirus demon-strates that astrocytes mount a delayed but more robust response to infection than microglia, despite their lower basal mRNA levels of IFN-␣/-inducing components. Lethal, uncontrolled viral dissemination following ablation of astrocyte IFN-␣/ sig-naling revealed the importance of IFN-␣/responses in a single cell type for protec-tion. Sustained global IFN-␣/expression associated with uncontrolled virus did not suffice to protect neurons and further impaired responsiveness to protective IFN-␥. The results support astrocytes as critical contributors to innate immunity and the concept that limited IFN-␣/responses are critical for effective subsequent antiviral IFN-␥function.
KEYWORDS astrocytes, CNS, IFN-␣, IFN-, IFNAR, MHV
Received1 November 2017Accepted22 February 2018
Accepted manuscript posted online28 February 2018
CitationHwang M, Bergmann CC. 2018. Alpha/beta interferon (IFN-α/β) signaling in astrocytes mediates protection against viral encephalomyelitis and regulates IFN-γ-dependent responses. J Virol 92:e01901-17.
https://doi.org/10.1128/JVI.01901-17.
EditorTom Gallagher, Loyola University Medical Center
Copyright© 2018 Hwang and Bergmann. This is an open-access article distributed under the terms of theCreative Commons Attribution 4.0 International license.
Address correspondence to Cornelia C. Bergmann, bergmac@ccf.org.
on November 6, 2019 by guest
http://jvi.asm.org/
V
iral infections of the central nervous system (CNS) are rare but can lead to rapid mortality or long-term neurological disabilities even if acute encephalitis is re-solved (1). Early essential host defense mechanisms involve induction of alpha/beta interferon (IFN-␣/) and signaling through the IFN-␣/receptor (IFNAR) to upregulate IFN-stimulated genes (ISGs). ISG expression is associated with numerous biological activities, including antiviral and immunomodulatory pathways, e.g., interference with translation, apoptosis, and enhanced major histocompatibility complex (MHC) class I antigen (Ag) presentation (2–4). While the IFN-␣/response is critical in stemming CNS viral replication and spread, it is rapidly downregulated and insufficient to eliminate virus in the absence of subsequent adaptive immune responses (5–7). Moreover, the efficiency of the innate response in limiting viral spread sets the stage for the effec-tiveness of subsequent adaptive immunity (2–4, 8).Detection of viruses and induction of IFN-␣/are initiated by pattern recognition receptors (PRRs), which differ in subcellular localization and are specialized to recognize distinct molecular entities in virus structural components, genome, and/or replication intermediates (2, 8, 9). PRRs which recognize RNA viruses include endosome-associated membrane-bound Toll-like receptors (TLRs), mainly TLR3, and the cytoplasmic retinoic acid inducible gene 1 (RIG-I)-like receptors (RLRs) and melanoma differentiation-associated antigen 5 (MDA5). Specialized PRR adapter proteins transmit signals to activate IFN response factor 3 (IRF3), IRF5, and IRF7, which translocate to the nucleus to induce IFN- and a subset of IFN-␣ genes (9). Secretion of IFN-␣/ and signaling through IFNAR subsequently activate ISGs and the “antiviral state.” PRR activation also activates nuclear factorB (NF-B)-regulated genes, thereby inducing proinflammatory cytokines and chemokines to facilitate recruitment of innate and adaptive effector cells (2, 9). Virtually all nucleated cells are able to induce and respond to IFN-␣/, including CNS resident cells (5, 6). The CNS does not harbor plasmacytoid dendritic cells, which are potent peripheral IFN-␣/inducers (3, 10), and therefore has to rely on intrinsic induction of IFN-␣/. CNS resident cells have been shown to differ widely in the repertoire as well as magnitude of basal and inducible transcripts encoding PRRs and factors associated with the IFN-␣/pathway (5–7, 11). As IFN-␣/signaling can rapidly induce genes involved in virus sensing and their signaling components, cell types which are not effective initial IFN-␣/ inducers may nevertheless contribute to the overall innate antiviral activity by efficient IFN-␣/ signaling and amplification of the IFN-␣/ response (5, 11, 12). The interdependence of CNS cells in achieving an IFN-␣/-dependent antiviral state thus requires further investigation.
Microglia and astrocytes are the CNS resident cells most prominently involved in early innate responses to injury, autoimmune attack, or infection (6, 7, 11, 12). In infections these early responses are essential to attract peripheral immune cells and limit viral dissemination (2, 3, 8). Importantly, not only productively infected but also abortively infected astrocytes mount innate responses that contribute to protection (3, 13, 14). CNS infections by several neuronotropic RNA viruses, including La Crosse virus, rabies virus, vesicular stomatitis virus (VSV), and Theiler’s murine encephalomyelitis virus (TMEV), suggested that astrocytes, not neurons, are the main source of IFN- expression and contributors to virus control through both TLR and RLR activation pathways (14–16). Both microglia and astrocytes express various PRRs, and their sentinel function is supported by their rapid response to microbial infection (5, 7, 10, 14, 17, 18). In addition to participating in direct antiviral functions, astrocytes regulate CNS homeostasis, support neuronal function, and participate in formation and maintenance of the blood-brain barrier (BBB) (19, 20). Both astrocytes and IFN-␣/actively participate in BBB function to restrict CNS entry of molecules, cells, or pathogens (19, 21). IFN-␣/ signaling specifically to astrocytes promotes BBB integrity in the cerebellum and protects from West Nile virus infection (22). Thus, both astrocyte IFN-␣/induction and signaling regulate the outcome of infection within the CNS at different functional levels. The essential role of IFNAR signaling in limiting viral dissemination within the CNS is supported by neurotropic virus infections of IFNAR-deficient (IFNAR⫺/⫺) mice (3, 5, 6, 23). However, caveats for IFNAR⫺/⫺mice are the reduced basal levels of factors
Hwang and Bergmann Journal of Virology
on November 6, 2019 by guest
http://jvi.asm.org/
IFN-␣/ (28–30), they do induce IFN- in microglia/macrophages (18). Importantly, even the low levels of IFN-␣/are essential to prevent viral dissemination and mortality (31, 32). The studies here reveal distinct patterns of basal and inducible levels of mRNAs encoding components of the IFN-␣/ pathway in astrocytes and microglia isolated from naive and infected adult mouse brains. Despite expressing lower baseline mRNA levels, astrocytes upregulated IFN-␣/ pathway gene expression to a greater extent than microglia, supporting effective IFN-␣/responses. Ablation of IFN〈R in astrocytes using mGFAPcre IFNARfl/flmice resulted in severe encephalomyelitis and mortality by 7 days postinfection (p.i.). This contrasted with mild clinical symptoms and no fatalities in infected control IFNARfl/fl mice. Uncontrolled viral spread throughout the CNS parenchyma of mGFAPcre IFNARfl/fl mice not only was associated with increased astrocyte infection but also affected neurons and microglia, despite overall elevated and sustained levels of mRNAs for IFN- and IFN-␣genes and ISGs. IFN-␥, a crucial mediator of MHV control in the CNS, was not impaired, despite reduced T cell CNS infiltration. Unexpectedly however, defective IFN-␥signaling was implicated by im-paired induction of IFN-␥-dependent MHC class II expression on microglia. Overall our results imply that IFN-␣/signaling in astrocytes not only is critical in limiting CNS viral spread but also promotes lymphocyte-derived protective antiviral IFN-␥function.
RESULTS
MHV strain A59 induces type I IFN in the CNS coincident with viral replication. To evaluate the kinetics of MHV A59 replication relative toIfn␣/andIfn␥mRNA levels in the CNS, brains from uninfected and infected wild-type (wt) C57BL/6 mice were harvested out to day 21 p.i. Virus replication was monitored by expression of viral RNA encoding the N protein (A59 N), which is present on genomic and all subgenomic RNAs (33). Viral N mRNA was most abundant between days 3 and 5 p.i. and declined by day 7 p.i. (Fig. 1), but it remained detectable out to day 21 p.i.Ifn,Ifn␣4, andIfn␣5 mRNAs, the most abundant Ifn␣ mRNAs expressed following MHV A59 infection (34), also reached maximal levels between 3 and 5 days p.i. and dropped significantly by day 7 p.i. (Fig. 1). WhileIfnmRNA was still elevated at day 10 p.i.,Ifn␣4 andIfn␣5mRNAs had declined to basal levels by day 7 p.i.Ifn␥mRNA was already detectable at day 3 p.i. but did not peak until 5 to 7 days p.i. Expression levels declined by day 10 p.i. but remained elevated above background out to day 21 p.i. (Fig. 1).Ifn␣/mRNA levels thus peaked together with viral mRNA, whereas theIfn␥mRNA peak was delayed and coincided with T cell infiltration (31).
Astrocytes exhibit distinct induction of and responsiveness to IFN-␣/ com-pared to microglia. Although MHV A59 replicates in glia and neurons, it induces IFN-␣/only in microglia, not astrocytes, using primary cell cultures (29). To assess the relative induction of and responsiveness to IFN-␣/in astrocytes and microgliain vivo, we used infected GFAP-GFP mice to isolate CD45-negative, green fluorescent protein (GFP)-positive (CD45⫺GFP⫹) astrocytes and CD45intCD11b⫹microglia by fluorescence-activated cell sorting (FACS) (Fig. 2A). Measurement of viral N relative to glyceraldehyde-3-phosphate dehydrogenase (GAPDH) mRNAs in either glia population revealed viral replication in both microglia and astrocytes at days 3 and 5 p.i. and a decline by day 7 p.i. (Fig. 2B). While increased viral N mRNA in microglia relative to astrocytes at days 3 and 5 p.i. did not reach statistical significance, overall viral N mRNA levels mirrored those in total
on November 6, 2019 by guest
http://jvi.asm.org/
brain. The same populations of purified cells were used to measure transcript levels of the Ifn␣/genes, genes regulating IFN-␣/, signaling and selected antiviral ISGs (Fig. 2C). In naive mice, constitutive expression of these genes was lower or undetectable in astrocytes compared to microglia. Following infection,IfnmRNA was upregulated by day 3 p.i. in microglia but was not upregulated until day 5 p.i. and was less robust in astrocytes. In contrast,Ifn␣4andIfn␣5mRNAs were not significantly upregulated in microglia but were increased prominently in astrocytes by day 5 p.i. Consistent with the decline in viral RNA, Ifn␣/mRNAs dropped to baseline levels by day 7 p.i. (Fig. 2C). Transcripts for components required for IFN-␣/signaling showed no significant differences between astrocytes and microglia throughout days 3 to 7 p.i. (Fig. 2C). While infection mediated a decline inIfnar1 mRNA relative to basal levels in microglia by day 5 p.i., it did not alter expression levels in astrocytes.Stat1mRNA levels varied between cell preparations and showed no significant changes throughout infection in either cell type.Irf9transcripts were not affected by virus infection in microglia but increased modestly in astrocytes. In contrast, individual ISGs were regulated distinctly not only between the glia populations but also within each glia type over time (Fig. 2C). MHV CNS infection has been shown to strongly induce IFN-induced protein with tetratricopeptide repeats (Ifit1andIfit2) and 2=,5=-oligoadenylate synthetase 2 (Oas2) transcripts (11, 31). AlthoughIfit1mRNA was increased in both populations by day 3 p.i., the relative induction was significantly higher in astrocytes than in microglia at all time points. In contrast,Ifit2mRNA was induced more prominently in microglia at day 3 p.i., reached similar levels in both cell types at day 5 p.i., and dropped thereafter in both populations. Lastly,Oas2mRNA showed peak upregulation in microglia by day 3 p.i. and modest induction in astrocytes (Fig. 2C). Under the assumption that viral mRNA levels reflect similar replication in both glial populations, these data support microglia as superior initiators of IFN-production relative to astrocytes following MHV A59 infectionin vivo; these findings are consistent with results from primary neonatal cell cultures (18, 29). Moreover, delayedIfnupregulation in astrocytes suggested that their sensitivity to viral replication is enhanced once viral sensors are elevated via IFN-␣/signaling. This notion was supported by delayed, yet more extensive, upregulation of theIfn␣as well as theIfit1 andIfit2genes compared to that in microglia. ISG upregulation further appeared to be independent of direct changes inIfnar,Stat1, orIrf9transcript levels.
Many PRR-encoding genes are themselves ISGs and are upregulated during CNS infections (3, 11, 35, 36). MDA5, RIG-I, and TLR3 have all been established as PRRs FIG 1Kinetics of viral replication and induction of type I and type II IFN transcripts in the brain following MHV A59 infection. Brains from naive and infected C57BL/6 mice were harvested at indicated times p.i. and analyzed for viral nucleocapsid protein (A59-N),Ifn1,Ifn␣4,Ifn␣5, andIfn␥mRNAs by reverse transcription-PCR (RT-PCR). Data are the means⫾standard errors of the means (SEM) forn⫽9 to 12 mice per time point from three independent experiments, each comprising 3 or 4 mice per time point, and were analyzed by the unpaired two-tailed Student
ttest and two-way ANOVA. #, significance compared to naive mice: #,P⬍0.05; ##,P⬍0.01; ###,P⬍0.001; ####,
P⬍0.0001. B.D, below detection.
Hwang and Bergmann Journal of Virology
on November 6, 2019 by guest
http://jvi.asm.org/
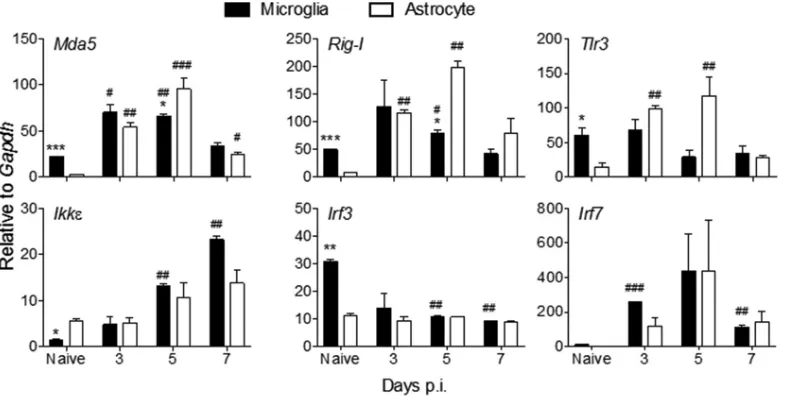
[image:4.585.42.402.69.260.2]contributing to IFN-␣/induction in MHV-infected microglia/macrophages and oligo-dendrocytes (18, 27, 37, 38). Basal Mda5, Rig-I, and Tlr3 transcript levels were all significantly lower in FACS-purified astrocytes than in microglia (Fig. 3). Nevertheless, astrocytes rapidly upregulated Mda5, Rig-I, and Tlr3 mRNAs to levels observed in microglia as early as day 3 p.i. (Fig. 3), when totalIfn␣/mRNA peaked in the brain (Fig. 1). Relative to basal levels, the fold increase in astrocytes exceeded that in microglia. All three PRR transcripts declined by day 7 p.i., reflecting the decline in IFN-␣/. With the exception of mRNA encoding IKK, a kinase involved in both induction and IFNAR signaling, constitutive levels of transcripts for PRR signal transduction factors repre-sented by IRF3 and IRF7 were also lower in astrocytes (Fig. 3). Expression of the cellular kinaseIkkmRNA was gradually increased in both glial populations over time up to day 7 p.i., with increases more pronounced in microglia (Fig. 3).Irf3mRNA expression was decreased in microglia following infection and remained unchanged in astrocytes,
FIG 2Astrocyte-mediated induction of and responsiveness to IFN-␣/ compared to those for microglia. Microglia and astrocytes were isolated by FACS from brains of naive or infected GFAP-GFP mice (n⫽5 or 6) at the indicated times p.i. based on CD45intCD11b⫹and CD45⫺GFAP⫹, respectively. (A) Representative contour plots show the gating strategy at day 7 p.i.
for microglia and astrocytes. Both plots are from total live cells. (B and C) Microglia and astrocytes were analyzed for transcripts of A59-N,Ifn␣4,Ifn␣5,Ifn1,Ifnar1, signaling components (Stat1andIrf9), and select ISGs (Ifit1,Ifit2, andOas2) by RT-PCR. Data represent the means⫾SEM from two experiments, each comprising 5 or 6 pooled brains per time point, and were analyzed by the unpaired two-tailed Studentttest and two-way ANOVA.*, significance between microglia and astrocytes; #, significance compared to each respective naive population:*and #,P⬍0.05;**and ##,P⬍0.01;***and ###,P⬍0.001; ####,P⬍0.0001. BD, below detection. In panel B, asterisks indicate significance between days 5 and 7 p.i. in the same cell type.
on November 6, 2019 by guest
http://jvi.asm.org/
[image:5.585.48.443.72.471.2]contrasting with upregulation ofIrf7mRNA in both cell types between days 3 to 5 p.i. and downregulation thereafter (Fig. 3). These data are consistent with constitutive IRF3 expression but inducible expression of both IKK and IRF7 following infection or IFN-␣/treatment of non-CNS cells (39). Overall, the data suggest that initial produc-tion of IFN-in microglia results in upregulation of select ISGs in astrocytes, thereby amplifying IFN-␣/. However, it remains unclear whether astrocytes induce IFN- directly via virus-derived PRR activators or via mediators released from necrotic or apoptotic cells in the inflamed CNS environment. Regardless, the results demonstrate that astrocytes are sensitive responders to IFN-␣/ and active participants in the IFN-␣/-induced amplification loop.
IFNAR signaling in astrocytes is essential to control MHV A59 infection.Given the prominent response of astrocytes to IFN-␣/following MHV A59 infectionin vivo, we determined the protective role of astrocyte-mediated IFNAR signaling against infection using mGFAPcre IFNARfl/fl mice. Disease onset was similar in mGFAPcre IFNARfl/fland IFNARfl/flmice starting at day 4 p.i. However, in contrast to mild clinical symptoms in IFNARfl/flmice, mGFAPcre IFNARfl/flmice developed severe encephalitis and succumbed to infection by day 7 p.i. (Fig. 4A). The 4- to 5-day-delayed mortality compared to that of IFNAR⫺/⫺mice infected with a similar virus dose (31) supported astrocytes as critical, but not the only, contributors to early IFNAR-dependent protec-tion.
To evaluate whether disease severity and mortality in mGFAPcre IFNARfl/flmice were correlated with impaired viral control, infectious virus was measured in brain superna-tants. The virus loads were comparable in both groups at day 3 p.i. but reached ⬃5-log10-higher levels in mGFAPcre IFNARfl/flmice than in IFNARfl/flmice by day 5 p.i. (Fig. 4B). The anatomical localization and distribution of viral N protein were also evaluated by histology. Compared to small isolated residual foci of viral Ag-positive cells in brains of IFNARfl/fl mice at day 6 p.i., mGFAPcre IFNARfl/fl mice exhibited extensive dissemination with increased intensity of viral Ag staining throughout the brain (Fig. 4C). High-magnification images indicated that virus was not limited to cells consistent with glial morphology but also was in cells with typical neuronal morphol-ogy in mGFAPcre IFNARfl/flmice (Fig. 4C, insets). As MHV A59 is hepatotropic following peripheral infection and can spread to the liver following i.c. infection of
immunocom-FIG 3Astrocytes rapidly induce viral RNA-sensing PRRs following MHV A59 infection. Microglia and astrocytes were isolated by FACS from brains of naive or MHV A59-infected GFAP-GFP mice as indicated in Fig. 2 and analyzed for transcripts encoding RNA-sensing PRRs (Mda5,Rig-I, andTlr3), kinases associated with IFN-␣/induction (Ikk), and transcription factors (Irf3,Irf7) by RT-PCR. Data represent the means⫾SEM from two experiments, each comprising 5 or 6 pooled brains per time point, and were analyzed by the unpaired two-tailed Studentttest and two-way ANOVA.*, significance between microglia and astrocytes; #, significance compared to each respective naive population:*and #,P⬍0.05;**and ##,P⬍0.01;***and ###,P⬍0.001.
Hwang and Bergmann Journal of Virology
on November 6, 2019 by guest
http://jvi.asm.org/
[image:6.585.42.446.71.271.2]promised mice (26), we also surveyed liver for viral N mRNA. The levels of viral N relative to GAPDH transcripts were elevated in livers of mGFAPcre IFNARfl/fl compared to IFNARfl/flmice at day 6 p.i. (values of 82⫾48 versus 5⫾3) (data not shown). However, overall viral N mRNA levels were significantly higher in the CNS (9,013⫾998 versus 230⫾ 55, respectively) (see Fig. 8). There was also no evidence of necrotic foci by gross visual examination (data not shown). Mortality was thus attributed to overwhelming virus spread within the CNS.
MHV A59 infects multiple CNS cell types, including microglia, astrocytes, and neurons (28, 31). To evaluate to what extent the absence of IFN-␣/ signaling in astrocytes predisposes astrocytes over other cell types to enhanced infection, brains from infected mGFAPcre IFNARfl/fland IFNARfl/flmice were analyzed for viral N protein in combination with antibodies (Abs) specific for neurons (NeuN), astrocytes (glial fibrillary acidic protein [GFAP]), and microglia/macrophages (IBA1). Characteristic stain-ing and colocalization patterns at day 4 p.i. in wt mice are depicted in Fig. 5A. Microglia and neurons showed prominent perinuclear cytoplasmic N protein localization, with some extension into processes in microglia. In contrast, viral Ag was only occasionally detected in the cytoplasm of astrocytes and was localized mainly proximal to, but not overlapping with, astrocytic processes. In this context it is critical to note that the anti-GFAP Ab used to identify astrocytes stains main stem branches but not the cytoplasm or fine processes of astrocytes and poorly stains gray matter astrocytes (20, 40), suggesting that viral protein may localize to astrocytic processes poorly detected by anti-GFAP Ab. Total N protein staining revealed an⬃3-fold-higher positive area in mGFAPcre IFNARfl/flthan in IFNARfi/fimice as determined by pixels per observed field at day 4 p.i.; the difference increased to⬃40-fold by day 6 p.i., when virus already declined in IFNARfi/fimice (Fig. 5B). Keeping the limitations of GFAP staining in mind,
FIG 4IFNAR signaling in astrocytes mediates protection against viral encephalomyelitis. (A) IFNARfl/fl (n ⫽12) and
mGFAPcre IFNARfl/fl(n⫽14) mice infected with MHV A59 were monitored for disease progression as described in Materials
and Methods and for survival rate. (B) Virus titers in brain supernatants were quantified by plaque assay (n⫽4/group/time point). Titers are from one experiment representative of two independent experiments. Data for panels A and B were analyzed by the unpaired two-tailed Student ttest. Asterisks indicate significance between IFNARfl/fl and mGFAPcre
IFNARfl/flmice:**,P⬍0.01;***,P⬍0.001;****,P⬍0.0001. (C) Representative images of viral N protein distribution in brains
from both mouse groups at day 6 p.i. detected by immunoperoxidase staining using MAb J3.3 (red chromogen; hematoxylin counterstain). Scale bars, 1 mm. Insets show the infected area or cells at higher magnifications. The arrow indicates typical neuronal morphology, and the arrowhead indicates glial morphology. Scale bars, 50m.
on November 6, 2019 by guest
http://jvi.asm.org/
[image:7.585.43.425.71.327.2]colocalization of viral Ag with GFAP was overall increased at day 6 p.i. Furthermore, when the relative proportion of the dual-positive area within the total viral Ag-positive pixel area was assessed, percentages were similar in both mouse strains at day 4 p.i. but were 2-fold higher in mGFAPcre IFNARfl/flmice than in controls at day 6 p.i. (Fig. 5C). Viral Ag-positive microglia were also overall increased in mGFAPcre IFNARfl/flmice at day 6 p.i. However, the relative proportion of the dually viral Ag- and IBA1-positive area per total viral Ag-positive area was comparable between groups at both days 4 and 6 p.i. (Fig. 5D). To evaluate the relative infection of astrocytes versus microglia, we also measured the proportions of viral Ag-positive area relative to GFAP- or IBA1-positive areas. While infection of microglia increased from⬃20% to⬃30%, it increased from⬍5% to 15% in astrocytes in mGFAPcre IFNARfl/flmice between days 4 and 6 p.i. (Fig. 6). Although infected neurons were increased in mGFAPcre IFNARfl/flcompared to IFNARfl/fl mice throughout the brain by day 4 p.i., they declined significantly in both groups by day 6 p.i. Remaining elevated neuronal infection in mGFAPcre IFNARfl/flmice at day 6 p.i. was still particularly evident in lower and distal parts of the brain (pons and medulla) (Fig. 5E). Analysis of apoptosis to explain the decline in virus-infected neurons indicated
FIG 5IFNAR abrogation in astrocytes results in uncontrolled virus dissemination in astrocytes and to a lesser extent in neurons and microglia. (A) Representative staining of viral N protein in various CNS cell types was determined using anti-J3.3 MAb in combination with anti-GFAP, -IBA1, or -NeuN MAb as markers for astrocytes, microglia, and neurons, respectively, and DAPI to identify nuclei. (B) Quantification of J3.3-positive area (N⫹) per field of view (m2) in brains of
IFNARfl/fland mGFAPcre IFNARfl/flmice at days 4 and 6 p.i. (C and D) Representative staining of viral N protein in astrocytes
and microglia in brain cortex of both mouse groups at day 6 p.i. Bar graphs show the proportion of N⫹GFAP⫹or N⫹IBA1⫹
per total N⫹area, respectively. Insets show infected astrocytes at higher magnification and arrows indicate infected
microglia. (E) Representative staining of viral N protein in neurons in brain cortex and brain stem at days 4 and 6 p.i. The bar graph shows average numbers of virus-infected neurons per brain section from 2 or 3 whole brain sections per mouse (n⫽3 mice). Arrows indicate virus-infected neurons. Scale bar, 50m. (C to E) Left and right panels indicate IFNARfl/fland
mGFAPcre IFNARfl/flmice, respectively. The data in panels B and C represent the means⫾SEM from 6 or 7 fields in 2 or
3 slides from 3 mice per group and were analyzed by the unpaired two-tailed Studentttest and two-way ANOVA.*, significance between IFNARfl/fland mGFAPcre IFNARfl/flmice; #, significance between days 4 and 6 p.i. in the same group:
*,P⬍0.05;**and ##,P⬍0.01;***,P⬍0.001.
Hwang and Bergmann Journal of Virology
on November 6, 2019 by guest
http://jvi.asm.org/
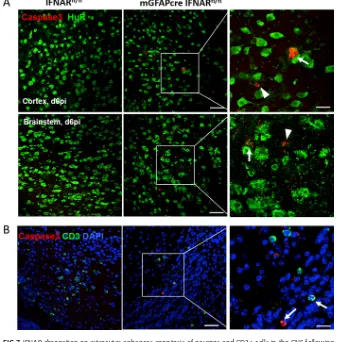
[image:8.585.43.427.69.393.2]overall sparse but more abundant neuronal apoptosis in mGFAPcre IFNARfl/flmice (Fig. 7A). Occasional apoptotic CD3⫹ lymphocytes were also observed with elevated fre-quency in mGFAPcre IFNARfl/flmice (Fig. 7B). While these results likely underestimate the extent of viral infection in astrocytes, they support that the absence of astrocyte FIG 6IFNAR abrogation on astrocytes predisposes astrocytes to infection over microglia. Bar graphs show the proportion of N⫹GFAP⫹/GFAP⫹or N⫹IBA1⫹/IBA1⫹per field in IFNARfl/fl(left) and mGFAPcre IFNARfl/fl(right)
mice. Data represent the means⫾SEM from 3 fields in 2 or 3 slides from 3 mice per group and were analyzed by the unpaired two-tailed Studentttest. Asterisks indicate significance between IFNARfl/fland mGFAPcre
IFNARfl/flmice, comparing the same cell populations:*,P⬍0.05;**,P⬍0.01.
FIG 7IFNAR abrogation on astrocytes enhances apoptosis of neurons and CD3⫹cells in the CNS following
infection. (A) Representative staining of apoptosis (anti-caspase 3) of neurons (anti-HuR) in brain cortex and brain stem at day 6 p.i. Arrows indicate caspase 3⫹neurons, and arrowheads indicate nonneuronal caspase
3⫹cells. (B) Apoptosis of T cells (anti-CD3) in mGFAPcre IFNARfl/flmice. Arrows indicate caspase 3⫹CD3⫹
cells. Scale bars, 50m and 20m at low and high magnifications, respectively.
on November 6, 2019 by guest
http://jvi.asm.org/
[image:9.585.134.279.71.195.2] [image:9.585.38.381.347.689.2]IFNAR signaling leads to increased viral dissemination most prominently within astro-cytes but also to microglia and neurons.
Abrogated IFNAR signaling in astrocytes does not impair overall expression of IFN-␣/, ISGs, chemokines, and cytokines. To assess whether uncontrolled virus spread was attributable to overall impaired innate immune responses, we determined transcripts for IFN-␣/and ISGs in relation to viral N mRNA levels in brains of both mouse groups (Fig. 8). Viral N mRNA levels were similar at day 3 p.i. but increased significantly in mGFAPcre IFNARfl/flmice compared to IFNARfl/flcontrols by day 6 p.i. (Fig. 8), consistent with increased infectious virus by day 5 p.i. (Fig. 4B). Elevated viral N mRNA correlated with increasedIfn,Ifn␣4, andIfn␣5transcripts at day 6 p.i. (Fig. 8). To assess how elevated IFN-␣/ affected downstream IFNAR signaling, we further compared mRNA levels of the ISGs (Ifit1,Ifit2,Isg15,Mx1,Pkr, andOas2). While these transcripts were all similar in both mouse groups at day 3 p.i.,Ifit1,Ifit2, andMx1mRNAs were increased 2- to 3-fold in mGFAPcre IFNARfl/flmice by day 6 p.i.Isg15,Pkr, andOas2 mRNAs were not affected or reduced relative to those in IFNARfl/flcontrols (Fig. 8). IFNAR abrogation on astrocytes thus did not impair globalIfn␣/or select ISG expres-sion in the infected CNS. However, innate immunity by IFNAR-competent cells was clearly insufficient to stem viral dissemination throughout the CNS in mGFAPcre IFNARfl/flmice.
Astrocytes are also potent inducers of chemokines and cytokines (13, 41), and a subset of chemokines, e.g., the neutrophil chemoattractant CXCL1, can be negatively regulated by IFN-␣/ (42). We therefore evaluated how the absence of IFNAR on FIG 8IFNAR abrogation in astrocytes results in uncontrolled viral replication and altered CNS expressions of IFN-␣/and ISGs. Brains from MHV A59-infected IFNARfl/fland mGFAPcre IFNARfl/flmice were analyzed for A59-N,
Ifn␣4,Ifn␣5,Ifn1, and ISG (Ifit1,Ifit2,Mx1,Isg15,Oas2, andPkr) mRNA levels by quantitative RT-PCR. Data represent the means⫾ SEM forn⫽ 4 mice per time point from one experiment representative of two independent experiments and were analyzed by the unpaired two-tailed Studentttest. Asterisks indicate significance between IFNARfl/fland mGFAPcre IFNARfl/flmice:*,P⬍0.05;**,P⬍0.01;***,P⬍0.001;****,P⬍0.0001.
Hwang and Bergmann Journal of Virology
on November 6, 2019 by guest
http://jvi.asm.org/
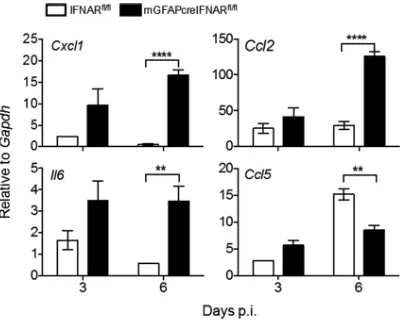
[image:10.585.48.403.68.387.2]astrocytes modulates expression of select NF-B-dependent chemokines and the pro-inflammatory cytokine interleukin 6 (IL-6) (43, 44). Transcripts forCxcl1andCcl2, potent chemoattractants for neutrophils and monocytes, respectively, were similar at day 3 p.i. but were significantly upregulated at day 6 p.i. (Fig. 9), consistent with increased viral replication and IFN-␣/-mediated downregulation of CXCL1 by astrocytes (42, 45). Increased Il6 mRNA expression at day 6 p.i. (Fig. 9) further indicated that IFNAR abrogation on astrocytes does not impact proinflammatory cytokine induction. In contrast,Ccl5mRNA, which is prominently expressed by T cells during MHV infection (46), was significantly reduced compared to that in IFNARfl/fl mice at day 6 p.i. Dysregulation of these proinflammatory factors suggested that myeloid cells may be recruited in favor of lymphocytes in mGFAPcre IFNARfl/flmice, thereby contributing to morbidity and uncontrolled viral spread.
Infected mGFAPcre IFNARfl/flmice exhibit increased CNS neutrophil
accumu-lation and reduced T cell infiltration.Flow cytometry revealed that altered chemo-kine expression patterns indeed affected the composition of inflammatory cells within the CNS. Consistent with elevated Cxcl1 mRNA, neutrophils in mGFAPcre IFNARfl/fl brains were increased by ⬃8-fold at day 6 p.i. relative to those in IFNARfl/fl mice, although numbers in both groups were already reduced compared to those at day 3 p.i. (Fig. 10A). Differences in macrophages were not statistically significant (Fig. 10B). As both CD4 and CD8 T cells are essential to reduce infectious MHV, with IFN-␥playing a prominent antiviral role (33, 47), we further assessed if impaired T cell recruitment and IFN-␥production within the CNS is associated with lack of virus control. Indeed, both CD4 and CD8 T cells were reduced in the CNS of mGFAPcre IFNARfl/flmice at day 6 p.i. (Fig. 10C). However, similar IFN-␥ levels (Fig. 10D), despite reduced T cell numbers, suggested that increased viral replication leads to increased Ag presentation, thereby triggering more or prolonged IFN-␥production by T cells in mGFAPcre IFNARfl/flmice (48, 49). Impaired access of T cells to the CNS parenchyma was ruled out as an explanation of loss of viral control, as we found no differences in anatomical distribu-tion of CD3⫹T cells within perivascular and parenchymal sites between the two groups (data not shown). Uncontrolled viral replication in mGFAPcre IFNARfl/flmice despite similar IFN-␥ production thus implied that viral replication overwhelms the T cell response or that IFN-␥signaling is impaired.
Determination of IFN-␥-specific responses in vivo is complicated by the fact that many factors upregulated by IFN-␥are also induced by IFN-␣/(50). Nevertheless, a prominent indicator of IFN-␥signaling in microglia/macrophages is induction of the FIG 9Abrogated IFNAR signaling in astrocytes leads to increased expression of proinflammatory factors. Brains from MHV A59-infected IFNARfl/fland mGFAPcre IFNARfl/flwere analyzed forCxcl1,Ccl2,Ccl5, and
Il6mRNA levels by quantitative RT-PCR. Data represent the means⫾SEM forn⫽4 mice per time point from one experiment representative of two independent experiments and were analyzed by the unpaired two-tailed Studentttest. Asterisks indicate significance between IFNARfl/fl and mGFAPcre
IFNARfl/flmice:**,P⬍0.01;****,P⬍0.0001.
on November 6, 2019 by guest
http://jvi.asm.org/
[image:11.585.103.308.70.232.2]transcription factor class II transactivator (CIITA), a master regulator of MHC class II expression (51, 52). Interestingly, Ciita transcripts were barely induced in brains of mGFAPcre IFNARfl/flmice, in contrast to robust upregulation in control mice, at day 6 p.i. (Fig. 10E). Analysis of MHC class II expression on microglia by flow cytometry confirmed that the very modestCiitamRNA induction impaired IFN-␥-dependent MHC class II upregulation. Only ⬃16% of microglia expressed MHC class II in mGFAPcre IFNARfl/fl mice, compared to ⬃76% in IFNARfl/fl mice, and the mean fluorescence intensity, reflecting expression levels, per cell was also lower (Fig. 10F).
FIG 10Abrogated IFNAR signaling in astrocytes is associated with altered leukocyte accumulation and impaired IFN-␥signaling in microglia. (A to C) Numbers of infiltrated neutrophils (A), macrophages (B), and CD4 and CD8 T cells (C) within brains of infected IFNARfl/fland mGFAPcre IFNARfl/flmice determined by flow
cytometry at the indicated time points. (D) IFN-␥protein in brain supernatants measured by ELISA. (E)Ciita
mRNA levels in brains determined by quantitative RT-PCR at days 3 and 6 p.i. (F) MHC class II expression (percentages and mean fluorescence intensity [MFI]) on microglia in brains of both mouse groups determined by flow cytometry at day 6 p.i. (G) Cxcl9andCxcl10mRNA levels in brains measured by quantitative RT-PCR. Data represent the means⫾SEM from three experiments (n⫽9 to 12 per group and time point) and were analyzed by the unpaired two-tailed Student t test and two-way ANOVA. *, significance between IFNARfl/fland mGFAPcre IFNARfl/flmice; #, significance between days 3 and 6 p.i. in the
same group: #,P⬍0.05;**and ##,P⬍0.01;***and ###,P⬍0.001;****and ####,P⬍0.0001.
Hwang and Bergmann Journal of Virology
on November 6, 2019 by guest
http://jvi.asm.org/
[image:12.585.41.380.66.508.2]tion is likely driven by IFN-␥and/or TNF. Overall, these results implied that microglia, but not astrocytes, are significantly compromised in IFN-␥responsiveness in mGFAPcre IFNARfl/flmice.
Preexposure to IFN-␣/modifies IFN-␥ responsiveness in myeloid cells.One explanation for the differential responsiveness to IFN-␥in microglia versus astrocytes in mGFAPcre IFNARfl/flmice is that prolonged IFNAR signaling via elevated and sustained IFN-␣/expression may skew subsequent IFN-␥responsiveness. This is supported by an antagonistic effect of IFN-␣/ on IFN-␥ responses in macrophages following IFN treatment orListeriainfection (58–60). We therefore used the viral RNA mimic poly(I·C), a synthetic double-stranded RNA (dsRNA) analog recognized by TLR3 as well as RIG-I/MDA5, to induce Ifn␣/ mRNA in bone marrow-derived macrophages (BMDM) and monitor IFN-␥responsiveness. Previousin vivodata revealed that poly(I·C) admin-istration into the CNS of mice inducedIfn␣/mRNA by 4 h, which was sustained out to 12 h (11). BMDM were thus pretreated with poly(I·C) for 4 or 12 h and subsequently treated with IFN-␥for 18 h. IFN-␥-only treatment was included as a positive control. Poly(I·C) alone did not induceCiitamRNA at 4 h and induced it only sparsely by 12 h. However, while IFN-␥ treatment alone effectively induced Ciita mRNA, it failed to induce Ciita mRNA in cells pretreated with poly(I·C) for either 4 or 12 h (Fig. 11). Similarly, poly(I·C) alone only sparsely induced Cxcl9 mRNA at 4 h compared to induction by IFN-␥treatment alone, and short poly(I·C) pretreatment suppressedCxcl9 mRNA induction by IFN-␥. Assessment of an inhibitory effect of prolonged poly(I·C) exposure was preempted by induction ofCxcl9mRNA levels similar to those with IFN-␥. Finally, treatment with poly(I·C) alone was superior to IFN-␥ alone in upregulating Cxcl10mRNA, with saturation already achieved at 4 h. These results are consistent with poly(I·C)-mediated upregulation of CXCL10 via IFN-␣/and TNF and preempted use of Cxcl10 as a target gene to assess suppressive functions on IFN-␥signaling in this experimental setting. Overall, these data indicate that preexposure of macrophages/ microglia to a virus-induced inflammatory milieu including IFN-␣/has the potential to negatively regulate subsequent IFN-␥signaling. However, the magnitude of IFN-␣/ -mediated suppression of IFN-␥-dependent gene induction depends on other regulatory elements in the respective target gene promoter. These results reveal that the duration and/or level of cell exposure to IFN-␣/can substantially diminish responsiveness to temporally lagging IFN-␥, thereby reducing IFN-␥protective functions.
DISCUSSION
The ability to induce and respond to IFN-␣/varies between cell types as well as between types of virus, but the contribution of different CNS cell types to mount IFN-␣/-mediated protectionin vivoare less well explored (6). Our studies comparing the capacity of adult astrocytes relative to microglia to respond to MHV A59 infection revealed that astrocytes expressed lower basal levels of PRRs and signaling components to induce IFN-␣/and ISGs than microglia, consistent with published gene array data (61). Nevertheless, despite a delay in response to infection, astrocytes exhibited strong upregulation of PRRs,Ifn␣s, and select ISGs, supporting that astrocytes are well posi-tioned to respond to paracrine IFN-␣/to amplify their innate antiviral response. The critical role of IFNAR signaling in astrocytes to block viral spread was confirmed by rapid virus dissemination throughout the CNS upon abrogation of IFNAR signaling in
on November 6, 2019 by guest
http://jvi.asm.org/
cytes. Thus, although basal expression levels of IFN-␣/ signaling components have been shown to determine the responsiveness of cells to insults (11, 62), our data reveal that cells expressing low basal levels of IFN-␣/pathway components can nevertheless trigger a protective innate immune response through paracrine IFN-␣/signaling.
Delayed mortality of infected mGFAPcre IFNARfl/flmice compared to IFNAR⫺/⫺mice implied that other cell types, including microglia, can produce and respond to IFN-␣/. This is clearly demonstrated by elevated and sustained Ifn␣/ as well as select ISG expression despite IFNAR deletion on astrocytes. However, vast dissemination of virus throughout the CNS clearly indicated that IFNAR signaling specifically in astrocytes plays a dominant role in host protection, which could not be compensated by IFNAR-competent glia and neurons. While microglia appeared to exhibit some autocrine action as suggested by less overall infection relative to that in astrocytes, neurons in the brain stem appeared to be most susceptible and vulnerable to infection in the absence of astrocyte IFNAR signaling. Although we cannot exclude that inherently reduced activation of innate viral components in neurons may contribute to their susceptibility, our data indicate that overwhelming infection of IFNAR-deficient astrocytes increases adjacent neuronal infection. West Nile virus infection of neuronal cultures demonstrates that neurons have the capacity to mount innate viral responses via TLR and IRF activations (63, 64). Moreover, neurons have also been demonstrated to induce IFN-following TMEV and La Crosse virus infectionin vivo(65). Nevertheless, these responses were very sparse and focal. In contrast, subsequent studies of La Crosse virus infection in IFN-reporter mice showed that apparently noninfected astrocytes and microglia in close proximity to infected neurons were prominent IFN--producing cells, while IFN-expression by infected neurons was rare (16). More recent data demonstrate that IFN--producing astrocytes appeared to be transiently or abortively infected during various infections associated with neuronal tropism (14). The spatial extent of innate protection induced in an infected environment FIG 11Poly(I·C) pretreatment impairs IFN-␥ signaling in macrophages. Cultured BMDM were either treated with IFN-␥only (50 ng/ml) for 18 h or pretreated with poly(I·C) (5g/ml) for 4 or 12 h prior to treatment with IFN-␥for 18 h.Ciita,Cxcl9, andCxcl10mRNA levels were determined by quantitative real-time PCR in control and treated cultures as indicated. Data represent the means⫾SEM from three independent experiments.*,P⬍0.05 compared to IFN-␥-only treatment.
Hwang and Bergmann Journal of Virology
on November 6, 2019 by guest
http://jvi.asm.org/
[image:14.585.133.277.71.355.2]CNS infiltration correlated with increased mRNA expression of the neutrophil chemoat-tractant CXCL1 (41) and its downregulation by IFN-␣/ and IFN-␥ (42, 45, 67, 68). Neutrophils are early innate responders, which contribute to BBB breakdown and tissue damage via secretion of matrix metalloproteinases (MMPs) and a wide range of other degrading enzymes released upon degranulation (69, 70). During autoimmune-mediated CNS inflammation, neutrophils have also been shown to release cytokines which mature antigen-presenting cells and subsequently reactivate T cells (71–73). Elevated Cxcl1 mRNA as well as increased levels of mRNAs encoding IL-6 and CCL2, two other proinflammatory factors prominently induced in astrocytes (74), further suggested that the NF-B pathway initiated by PPR activation was intact in infected mGFAPcre IFNARfl/flmice.
Finally, our results show that extensive virus spread in the absence of protective astrocyte IFNAR signaling cannot be controlled by T cells. Although previous studies of CXCL9 and CXCL10 monoclonal antibody (MAb) blockade to reduce CXCR3-dependent T cell recruitment showed a reduction in T cell migration and loss of viral control in a related MHV infection (75, 76), subsequent studies in CXCL9- and CXCL10-deficient mice indicated that CXCL10 is more critical for effective adaptive immunity (57). Impaired T cell accumulation despite unimpairedCxcl10mRNA in mGFAPcre IFNARfl/fl mice was thus unanticipated. While an overwhelming virus load may lead to Ag-induced T cell exhaustion and death (77), dysregulation of T cells requires future investigation. Regardless of reduced T cell numbers, their initial activity as monitored by IFN-␥secretion was not impaired. IFN-␥signaling is essential for MHV control within the CNS by both exerting direct antiviral effects and enhancing MHC class I and II upregu-lation (78). However, reduced induction of IFN-␥-dependent Ciita andCxcl9 mRNAs showed that microglia were significantly impaired in IFN-␥responsiveness. In contrast, increasedCxcl10mRNA expression in the absence of IFNAR on astrocytes implied that IFN-␥signaling in astrocytes remained intact. The notion that elevated and sustained IFN-␣/ signaling acts as a negative regulator of IFN-␥ signaling was supported by earlier reports showing antagonistic effects of IFN-␣/on IFN-␥-induced activation of macrophages (58–60). One possible mechanism may involve downregulation of the IFN-␥ receptor (IFNGR), as shown during Listeria infection (58). Ourin vitro studies further supported selected downregulation of IFN-␥ responsiveness by IFN-␣/ via pretreatment of BMDM with the dsRNA mimic poly(I·C). IFN-␣/-dependent sensitiza-tion of microglia/macrophages to subsequent IFN-␥responses may provide a mecha-nism to limit excessive immune responses leading to tissue damage. In this context it is of interest to note that both IFN-␣/and IFN-␥responses are tightly controlled by negative regulators, including phosphatases (79). Cross talk between IFN-␣/and IFN-␥ responses may thus provide additional levels to protect the host from exacerbated proinflammatory responses.
Overall, our data demonstrate a vital protective role of astrocyte-mediated IFN-␣/ signaling in host protection from neurotropic coronavirus-induced encephalomyelitis. Further, the link between sustained elevated IFN-␣/and impaired responsiveness to IFN-␥supports the novel concept that temporally limited early IFN-␣/responses are critical for effective antiviral IFN-␥function.
on November 6, 2019 by guest
http://jvi.asm.org/
MATERIALS AND METHODS
Mice, virus, and infection.FVB/N-Tg (GFAP-GFP) 14 Mes/J (GFAP-GFP) mice were originally pur-chased from the Jackson Laboratory (Bar Harbor, ME) and backcrossed to C57BL/6 mice for at least 10 generations. B6.Cg-Tg (Gfap-cre) 77.6Mvs/J (stock number 012887; mGFAPcre) mice were also purchased from the Jackson Laboratory (Bar Harbor, ME). IFNARfl/flmice engineered to containloxPsites flanking
exon 10 of the IFNAR gene were originally produced on the 129/Ola background in U. Kalinke’s laboratory (Paul-Ehrlich-Institut, Langen, Germany) as described previously (80) and were backcrossed onto the C57BL/6 background in R. Schreiber’s laboratory (Washington University School of Medicine, St. Louis, MO) as described previously (81). IFNARfl/flmice were crossed with mGFAPcre⫹/⫺mice to generate
mGFAPcre⫹/⫺IFNARfl/fl(mGFAPcre IFNARfl/fl) mice, which were crossed with IFNARfl/flmice for
experi-mentation. Offspring were genotyped for both the presence of the Cre recombinase gene and exon 10 deletion from the IFNAR gene by PCR using the following primers: Cre, 5=-GTCCAATTTACTGACCGTAC ACC-3=(forward) and 5=-GTTATTCGGATCATCAGCTACACC-3=(reverse); IFNAR flox, 5=-TGCTTTGAGGAGC GTCTGGA-3=(forward) and 5=-CATGCACTACCACACCAGGCTTC-3=(reverse). Cre-negative IFNARfl/fl
litter-mates were used as wt controls (IFNARfl/fl). All mice were housed under specific-pathogen-free conditions
at an accredited facility at the Cleveland Clinic Lerner Research Institute. Mice of both sexes were infected intracranially (i.c.) at 6 to 7 weeks of age with 2,000 PFU of the hepato- and neurotropic MHV A59 strain expressing enhanced green fluorescent protein (EGFP), kindly provided by Volker Thiel (Kantonal Hospital, St. Gallen, Switzerland) (82). MHV A59 was propagated on delayed brain tumor (DBT) astrocy-toma monolayers, and virus titers were determined as described previously (83). Virus in the CNSs of individual mice was measured by plaque assay on DBT cells using clarified supernatants from brain homogenates prepared as described previously (84). Clinical disease severity was graded daily using the following scale: 0, no disease symptoms; 1, ruffled fur; 2, hunched back or inability to turn upright; 3, severe hunching/wasting or hind limb paralysis; 4, moribund condition or death (31). All animal procedures were approved by the Institutional Animal Care and Use Committee of the Cleveland Clinic (PHS assurance number A3047-01) and were conducted in compliance with the Guide for the Care and Use of Laboratory Animals from the National Research Council.
Isolation of CNS cells and flow cytometric analysis. Brains from mice perfused with cold phosphate-buffered saline (PBS) were homogenized in Dulbecco’s PBS (DPBS) (pH 7.4) using Tenbroeck tissue homogenizers as described previously (84). Homogenates were centrifuged at 450⫻gfor 10 min at 4°C. Cells were resuspended in RPMI containing 25 mM HEPES (pH 7.2), adjusted to 30% Percoll (Pharmacia, Uppsala, Sweden), underlaid with 1 ml 70% Percoll, and centrifuged at 850⫻gfor 30 min at 4°C. Cells were collected from the 30%/70% interface, washed with RPMI, counted, and suspended in fluorescence-activated cell sorting (FACS) buffer (0.1% bovine serum albumin in DPBS). Fc␥receptors were blocked with 1% mouse serum and rat anti-mouse CD16/32 MAb (clone 2.4G2: BD Biosciences, San Diego, CA) for 20 min on ice prior to staining with fluorescein isothiocyanate (FITC)-, phycoerythrin (PE)-, peridinin chlorophyll protein (PerCP)-, or allophycocyanin (APC)-conjugated MAbs specific for CD45 (clone 30-F11), CD8 (clone 53-6.7), CD4 (clone GK1.5), Ly6G (clone 1A8), CD11b (clone M1/70), and MHC class II (clone M5/114.15.2) (all from BD Bioscience, Mountain View, CA) and F4/80 (Serotec, Raleigh, NC) in FACS buffer. Samples were analyzed on a BD Accuri C6 Plus instrument (BD Biosciences). Forward- and side-scatter signals obtained in linear mode were used to establish a gate containing live cells while excluding dead cells and tissue debris. Data were analyzed using FlowJo 9 software (Tress Star Inc., Ashland, OR).
Microglia and astrocyte isolation for gene expression analysis.Brains from 5 or 6 naive or MHV A59-infected GFAP-GFP mice at days 3, 5, and 7 p.i. were homogenized using a neural tissue dissociation kit (Papain, Miltenyi Auburn, CA) following the manufacturer’s protocol. Brain homogenates were prepared for 30/70% Percoll gradients to isolate cells as described above. CNS cells were blocked with mouse serum and anti-CD16/32 MAb as described above prior to staining with CD45 and CD11b in FACS buffer. Microglia and astrocytes were sorted based on their CD45int CD11b⫹ and CD45neg GFP⫹
phenotypes, respectively, using a FACS Aria III (BD Biosciences) and FACS Diva software (BD Biosciences). Sorted cells were resuspended in TRIzol (Invitrogen, Carlsbad, CA) and stored at⫺80°C.
Gene expression analysis.RNA from brains or sorted cells was extracted using TRIzol reagent (Invitrogen, Carlsbad, CA) according to the manufacturer’s instructions. Following treatment with DNase I using a DNA-free kit (Ambion, Austin, TX), cDNA was synthesized using Moloney murine leukemia virus reverse transcriptase (Invitrogen) in buffer containing 10 mM deoxynucleoside triphosphate mix, 250 ng random hexamer primers, and oligo(dT) (1:1 ratio) (Invitrogen). RNA expression was assessed using either SYBR green master mix (Applied Biosystems, Foster City, CA) or TaqMan fast master mix (Applied Biosystems, Foster City, CA) as described previously (31). The following primers were used with SYBR green master mix: for the GAPDH gene, 5=-CATGGCCT TCCGTGTTCCTA-3= (forward) and 5=-ATGCCTGCTTCACCACCTTCT-3=(reverse); for Cxcl9, 5=-TGCAC GATGCTCCTGCA-3=(forward) and 5=-AGGTCTTTGAGGGATTTGTAGTGG-3=(reverse); forCxcl10, 5=-GA CGGTCCGCTGCAACTG-3=(forward) and 5=-GCTTCCCTATGGCCCTCATT-3=(reverse); for the viral nu-cleocapsid (N) gene, 5=-GCCAAATAATCGCGCTAGAA-3=(forward) and 5=-CCGAGCTTAGCCAAAACAA G-3=(reverse); forIl6,5=-ACACATGTTCTCTGGGAAATCGT-3=(forward) and 5=-AAGTGCATCATCGTTGT TCATACA-3=(reverse); forOas2, 5=-AAAAATGTCTGCTTCTTGAATTCTGA-3=(forward) and 5=-TGTGCCT TTGGCAGTGGAT-3=(reverse); forIfnar1, 5=-CCCAAGGCAAGAGCTATGTC-3=(forward) and 5=-TCTGAA CGGCTTCCAGAACT-3=(reverse); forIkk, 5=-CCAGAAGATTCAGTGTTGTTTGG-3=(forward) and 5=-TCA TTGTAGCTGAGCCCTG-3=(reverse); forMda5, 5=-GACACCAGAATTCAAGGGAC-3=(forward) and 5=-GC CACACTTGCAGATAATCTC-3=(reverse); and forRig-I, 5=-GTCAGCACAAACCACAACC-3=(forward) and 5=-GTCTCAACCACTCGAATGTC-3=(reverse). TaqMan fast master mix and TaqMan primers/probes
Hwang and Bergmann Journal of Virology
on November 6, 2019 by guest
http://jvi.asm.org/
For immunofluorescence analysis, half brains were embedded in TissueTeck OCT compound (Scigen Scientific, Gardena, CA), flash frozen in liquid nitrogen, and stored at⫺70°C. Blocks were cut into 12- to 14-m sections using a cryostat at⫺17°C. Frozen sections were fixed with 4% paraformaldehyde for 15 min at room temperature and permeabilized in 0.3% Triton-X in PBS for 15 min. Nonspecific Ab binding was blocked using 1% bovine serum albumin, 10% goat or donkey serum, and goat anti-mouse IgG(H⫹L) (1:300 dilution; Jackson ImmunoResearch, West Grove, PA). Virus-infected cells were identified using MAb J3.3 (31) in combination with cell type-specific markers for microglia/macrophages using rabbit anti-IBA1 (019-19741; Wako, Richmond, VA), astrocytes using rabbit anti-glial fibrillary acidic protein (anti-GFAP) (Dako, Carpinteria, CA), or neurons using rabbit anti-NeuN (ABN78; Millipore, Temecula, CA) Ab. To assess CNS T cell infiltration, sections were stained with rabbit anti-mouse laminin Ab (Cedarlane Laboratories, Ontario, Canada) and rat anti-mouse CD3 MAb (eBioscience). Apoptosis was determined by staining tissue sections for caspase 3 in combination with CD3 (Abcam, Cambridge, MA) or HuR (Santa Cruz Biotechnology, Santa Cruz, CA) to identify T cells and neurons, respectively. Secondary Abs were goat anti-mouse or goat anti-rat Alexa-Fluor 488-, goat anti-rabbit Alexa-Fluor 594-, donkey anti-rabbit Alexa-Fluor 594-, and donkey anti-mouse Alexa-Fluor 488-conjugated IgG (Invitrogen). Sections were mounted with Vectashield antifade mounting medium with 4=,6-diamidino-2-phenylindole (DAPI) (Vec-tor Labora(Vec-tories, Burlingame, CA). Images were acquired using a Leica TCS-SP5II upright confocal/ multiphoton microscope (Leica Microsystems, Wetzlar, Germany). All images were analyzed using Fiji version 1.0. Quantification of viral N protein staining areas and the relative proportion of colocalization with GFAP or IBA1 reactivity were calculated per field of interest using Image-Pro Plus version 7.0. Infected neurons were enumerated by counting entire brain sections. For immunohistological analysis, representative data are presented from 6 or 7 separate fields per mouse with 3 or 4 mice per group per time point.
IFN-␥ELISA.IFN-␥in brain supernatants was measured by enzyme-linked immunosorbent assay (ELISA) as described previously (31). Briefly, 96-well plates were coated with 100l of 1-g/ml purified rat anti-mouse IFN-␥MAb (R4-6A2; BD Bioscience) in 0.1 M disodium hydrogen phosphate (pH 9.5) at 4°C overnight. Following blocking with 10% fetal calf serum (FCS) in PBS for 1 h, samples or a recombinant IFN-␥standard (BD Biosciences) was added, and plates were incubated at 4°C overnight. Bound IFN-␥was detected using biotinylated rat anti-mouse IFN-␥MAb (XMG1.2; BD Biosciences) and avidin peroxidase followed by 3,3=,5,5=-tetramethylbenzidine (TMB) (TMB reagent set; BD Biosciences) 30 min later. Optical densities were read at 450 nm with a Bio-Rad model 680 microplate reader and analyzed using Microplate Manager 5.2 software (Bio-Rad Laboratories, Hercules, CA).
BMDM and stimulation.Bone marrow-derived macrophages (BMDM) were prepared as described previously (31). Bone marrow was collected from femurs and tibiae of 8- to 10-week-old mice, passed through a cell strainer, and centrifuged at 400⫻gfor 5 min at 4°C. Cells were suspended in BMDM medium (Dulbecco modified Eagle medium [DMEM], 10% FCS, 20% L929 conditioned medium as a source of colony-stimulating factor 1, 0.1% gentamicin, 1% sodium pyruvate) and seeded at a density of 5⫻106cells in 10 ml BMDM growth medium into 10-mm2tissue culture dishes. An additional 5 ml
BMDM medium was added 3 days later. At 7 days postseeding, the fully differentiated and adherent macrophages were washed with DMEM, removed by scraping, and plated into 6-well plates (1⫻106
cells/well). BMDM were confirmed to be⬎90% F480⫹and CD11b⫹cells by FACS analysis. Cells were
treated with a mixture of poly(I)·poly(C) [poly(I·C)] (5g) (high molecular weight; InvivoGen, San Diego, CA) and FuGENE 6 transfection reagent (Promega, Madison, WI) in DMEM following the manufacturer’s protocol. After 4 or 12 h of poly(I·C) treatment, poly(I·C) was removed and 50 ng/ml recombinant IFN-␥ (BD Pharmingen) was added to cultures and left for 18 h. After stimulation, cells were lysed directly in 800l TRIzol (Invitrogen) and stored at⫺70°C for RNA isolation as described above.
Statistical analysis.Statistics were determined using the unpaired two-tailed Studentttest and two-way analysis of variance (ANOVA) with Bonferroni posttest; the analysis is indicated in the figure legends. Graphs were plotted using GraphPad Prism 5.0 software (GraphPad Software, Inc., LA Jolla, CA).
ACKNOWLEDGMENTS
This work was supported by U.S. National Institutes of Health grant P01NS064932. This work utilized the Leica SP5 confocal/multiphoton microscope that was purchased with partial funding from National Institutes of Health SIG grant 1S10RR026820-01.
The funding source had no involvement in the study design, writing of the manu-script, decision to submit, or collection, analysis, and interpretation of data.
on November 6, 2019 by guest
http://jvi.asm.org/
We thank Michael Diamond (Washington University School of Medicine, St. Louis, MO) for kindly providing IFNAR1fl/flmice on the C57BL/6 background. We also sincerely thank Jennifer Powers for exceptional FACS purification and the Cleveland Clinic Lerner Research Institute Imaging Core and John Peterson for assistance with confocal mi-croscopy.
REFERENCES
1. Swanson PA, II, McGavern DB. 2015. Viral diseases of the central nervous system. Curr Opin Virol 11:44 –54.https://doi.org/10.1016/j.coviro.2014 .12.009.
2. Ivashkiv LB, Donlin LT. 2014. Regulation of type I interferon responses. Nat Rev Immunol 14:36 – 49.https://doi.org/10.1038/nri3581.
3. Sorgeloos F, Kreit M, Hermant P, Lardinois C, Michiels T. 2013. Antiviral type I and type III interferon responses in the central nervous system. Viruses 5:834 – 857.https://doi.org/10.3390/v5030834.
4. Crouse J, Kalinke U, Oxenius A. 2015. Regulation of antiviral T cell responses by type I interferons. Nat Rev Immunol 15:231–242.https:// doi.org/10.1038/nri3806.
5. Paul S, Ricour C, Sommereyns C, Sorgeloos F, Michiels T. 2007. Type I interferon response in the central nervous system. Biochimie 89: 770 –778.https://doi.org/10.1016/j.biochi.2007.02.009.
6. Zegenhagen L, Kurhade C, Koniszewski N, Overby AK, Kroger A. 2016. Brain heterogeneity leads to differential innate immune responses and modulates pathogenesis of viral infections. Cytokine Growth Factor Rev 30:95–101.https://doi.org/10.1016/j.cytogfr.2016.03.006.
7. Russo MV, McGavern DB. 2015. Immune surveillance of the CNS follow-ing infection and injury. Trends Immunol 36:637– 650.https://doi.org/10 .1016/j.it.2015.08.002.
8. Mogensen TH. 2009. Pathogen recognition and inflammatory signaling in innate immune defenses. Clin Microbiol Rev 22:240 –273, Table of Contents.https://doi.org/10.1128/CMR.00046-08.
9. Akira S, Uematsu S, Takeuchi O. 2006. Pathogen recognition and innate immunity. Cell 124:783– 801.https://doi.org/10.1016/j.cell.2006.02.015. 10. Carty M, Reinert L, Paludan SR, Bowie AG. 2014. Innate antiviral
signal-ling in the central nervous system. Trends Immunol 35:79 – 87.https:// doi.org/10.1016/j.it.2013.10.012.
11. Kapil P, Butchi NB, Stohlman SA, Bergmann CC. 2012. Oligodendroglia are limited in type I interferon induction and responsiveness in vivo. Glia 60:1555–1566.https://doi.org/10.1002/glia.22375.
12. Zurney J, Howard KE, Sherry B. 2007. Basal expression levels of IFNAR and Jak-STAT components are determinants of cell-type-specific differ-ences in cardiac antiviral responses. J Virol 81:13668 –13680.https://doi .org/10.1128/JVI.01172-07.
13. Farina C, Aloisi F, Meinl E. 2007. Astrocytes are active players in cerebral innate immunity. Trends Immunol 28:138 –145.https://doi.org/10.1016/ j.it.2007.01.005.
14. Pfefferkorn C, Kallfass C, Lienenklaus S, Spanier J, Kalinke U, Rieder M, Conzelmann KK, Michiels T, Staeheli P. 2015. Abortively infected astrocytes appear to represent the main source of interferon beta in the virus-infected brain. J Virol 90:2031–2038.https://doi.org/10.1128/JVI.02979-15. 15. Detje CN, Lienenklaus S, Chhatbar C, Spanier J, Prajeeth CK, Soldner C,
Tovey MG, Schluter D, Weiss S, Stangel M, Kalinke U. 2015. Upon intranasal vesicular stomatitis virus infection, astrocytes in the olfactory bulb are important interferon beta producers that protect from lethal encephalitis. J Virol 89:2731–2738.https://doi.org/10.1128/JVI.02044-14. 16. Kallfass C, Ackerman A, Lienenklaus S, Weiss S, Heimrich B, Staeheli P. 2012. Visualizing production of beta interferon by astrocytes and micro-glia in brain of La Crosse virus-infected mice. J Virol 86:11223–11230.
https://doi.org/10.1128/JVI.01093-12.
17. Claycomb KI, Johnson KM, Winokur PN, Sacino AV, Crocker SJ. 2013. Astrocyte regulation of CNS inflammation and remyelination. Brain Sci 3:1109 –1127.https://doi.org/10.3390/brainsci3031109.
18. Roth-Cross JK, Bender SJ, Weiss SR. 2008. Murine coronavirus mouse hepatitis virus is recognized by MDA5 and induces type I interferon in brain macrophages/microglia. J Virol 82:9829 –9838.https://doi.org/10 .1128/JVI.01199-08.
19. Abbott NJ, Ronnback L, Hansson E. 2006. Astrocyte-endothelial interac-tions at the blood-brain barrier. Nat Rev Neurosci 7:41–53.https://doi .org/10.1038/nrn1824.
20. Sofroniew MV, Vinters HV. 2010. Astrocytes: biology and pathology. Acta Neuropathol 119:7–35.https://doi.org/10.1007/s00401-009-0619-8. 21. Kraus J, Ling AK, Hamm S, Voigt K, Oschmann P, Engelhardt B. 2004.
Interferon-beta stabilizes barrier characteristics of brain endothelial cells in vitro. Ann Neurol 56:192–205.https://doi.org/10.1002/ana.20161. 22. Daniels BP, Jujjavarapu H, Durrant DM, Williams JL, Green RR, White JP,
Lazear HM, Gale M, Jr, Diamond MS, Klein RS. 2017. Regional astrocyte IFN signaling restricts pathogenesis during neurotropic viral infection. J Clin Invest 127:843– 856.https://doi.org/10.1172/JCI88720.
23. McNab F, Mayer-Barber K, Sher A, Wack A, O’Garra A. 2015. Type I interferons in infectious disease. Nat Rev Immunol 15:87–103.https:// doi.org/10.1038/nri3787.
24. Nayak D, Johnson KR, Heydari S, Roth TL, Zinselmeyer BH, McGavern DB. 2013. Type I interferon programs innate myeloid dynamics and gene expression in the virally infected nervous system. PLoS Pathog 9:e1003395.https://doi.org/10.1371/journal.ppat.1003395.
25. Pinto AK, Daffis S, Brien JD, Gainey MD, Yokoyama WM, Sheehan KC, Murphy KM, Schreiber RD, Diamond MS. 2011. A temporal role of type I interferon signaling in CD8⫹T cell maturation during acute West Nile virus infection. PLoS Pathog 7:e1002407.https://doi.org/10.1371/journal .ppat.1002407.
26. Lavi E, Gilden DH, Highkin MK, Weiss SR. 1986. The organ tropism of mouse hepatitis virus A59 in mice is dependent on dose and route of inoculation. Lab Anim Sci 36:130 –135.
27. Zhao L, Rose KM, Elliott R, Van Rooijen N, Weiss SR. 2011. Cell-type-specific type I interferon antagonism influences organ tropism of murine coronavi-rus. J Virol 85:10058 –10068.https://doi.org/10.1128/JVI.05075-11. 28. Bender SJ, Weiss SR. 2010. Pathogenesis of murine coronavirus in the
central nervous system. J Neuroimmune Pharmacol 5:336 –354.https:// doi.org/10.1007/s11481-010-9202-2.
29. Rose KM, Weiss SR. 2009. Murine coronavirus cell type dependent interaction with the type I interferon response. Viruses 1:689 –712.
https://doi.org/10.3390/v1030689.
30. Daffis S, Szretter KJ, Schriewer J, Li J, Youn S, Errett J, Lin TY, Schneller S, Zust R, Dong H, Thiel V, Sen GC, Fensterl V, Klimstra WB, Pierson TC, Buller RM, Gale M, Jr, Shi PY, Diamond MS. 2010. 2=-O methylation of the viral mRNA cap evades host restriction by IFIT family members. Nature 468:452– 456.https://doi.org/10.1038/nature09489.
31. Butchi NB, Hinton DR, Stohlman SA, Kapil P, Fensterl V, Sen GC, Berg-mann CC. 2014. Ifit2 deficiency results in uncontrolled neurotropic coronavirus replication and enhanced encephalitis via impaired alpha/ beta interferon induction in macrophages. J Virol 88:1051–1064.https:// doi.org/10.1128/JVI.02272-13.
32. Ireland DD, Stohlman SA, Hinton DR, Atkinson R, Bergmann CC. 2008. Type I interferons are essential in controlling neurotropic coronavirus infection irrespective of functional CD8 T cells. J Virol 82:300 –310.
https://doi.org/10.1128/JVI.01794-07.
33. Bergmann CC, Lane TE, Stohlman SA. 2006. Coronavirus infection of the central nervous system: host-virus stand-off. Nat Rev Microbiol 4:121–132.https://doi.org/10.1038/nrmicro1343.
34. Baig E, Fish EN. 2008. Distinct signature type I interferon responses are determined by the infecting virus and the target cell. Antivir Ther 13:409 – 422.
35. McKimmie CS, Johnson N, Fooks AR, Fazakerley JK. 2005. Viruses selec-tively upregulate Toll-like receptors in the central nervous system. Biochem Biophys Res Commun 336:925–933.https://doi.org/10.1016/j .bbrc.2005.08.209.
36. Sharma A, Maheshwari RK. 2009. Oligonucleotide array analysis of Toll-like receptors and associated signalling genes in Venezuelan equine encephalitis virus-infected mouse brain. J Gen Virol 90:1836 –1847.
https://doi.org/10.1099/vir.0.010280-0.
37. Li J, Liu Y, Zhang X. 2010. Murine coronavirus induces type I interferon
Hwang and Bergmann Journal of Virology