Modelling Glass Fibre-Reinforced Polymer Reinforced Geopolymer
1Concrete Columns
2Minhao Dong1, Weena Lokuge2, Mohamed Elchalakani3, *, Ali Karrech4 3
1 Phd student, School of Civil, Environmental and Mining Engineering, The University of Western Australia, WA 6009, Australia 4
2 Senior Lecturer, School of Civil Engineering and Surveying, University of Southern Queensland, QLD 4300, Australia 5
3 Senior Lecturer, School of Civil, Environmental and Mining Engineering, The University of Western Australia, WA 6009, Australia 6
4 Associate Professor, School of Civil, Environmental and Mining Engineering, The University of Western Australia, WA 6009, Australia 7
* Corresponding author, email: mohamed.elchalakani@uwa.edu.au 8
9
Abstract. Glass fibre-reinforced polymer (GFRP) bar and stirrup reinforced geopolymer concrete 10
(GPC) is increasingly recognised as a potential replacement to the conventional steel-reinforced 11
ordinary Portland cement (OPC) concrete due to its superior durability. This paper proposed an 12
analytical model to predict the load-displacement relationship of the concentrically and eccentrically 13
loaded GFRP-GPC columns. The cross-section was divided into a number of strips and a strain gradient 14
was assigned to determine the stresses in the cover, core and reinforcement. The theoretical predictions 15
were then validated using experimental results from previous studies on the behaviour of GFRP-GPC, 16
GFRP-OPC concrete and steel-GFRP concrete systems. It was found that the predicted peaks load, 17
displacements at peak load and ductility indices were generally in close agreement with the 18
experimental results of the GFRP-GPC columns. However, the model had a tendency to over-predict 19
the stiffness of GFRP-OPC concrete and steel-OPC concrete columns in the elastic range. Overall, the 20
proposed analytical model is suitable for GFRP-GPC systems and could facilitate the widespread use 21
of this composite material. 22
1. Introduction 24
Corrosion causes millions of dollars of damage in steel reinforced concrete structures every year. The 25
service life of such structure is critically affected without adequate corrosion protection, especially in 26
harsh environments such as the coastal zones in Australia. Therefore, alternative construction materials 27
were investigated to reduce the cost and maintenance of the structure. Geopolymer concrete (GPC) was 28
considered to have better chloride and sulphate resistance than the Ordinary Portland Cement (OPC) 29
concrete [1,2]. The GPC relies on the formation of an amorphous polymeric Si-O-Al framework instead 30
of the calcium-silicate-hydrates (C-S-H) and calcium hydroxides (C-H) found in OPC matrix. The lack 31
of C-H is advantageous as it actively reacts with the chlorides and sulphates, which in turn reduces the 32
alkalinity in the matrix. The improved chemical stability means that the GPC will continuously provide 33
protection to the embedded reinforcement, extending the service life of the structure. Due to the 34
difference in microstructure, GPC has a lower elastic modulus than OPC concrete [3]. 35
Glass Fibre-Reinforced Polymer (GFRP) is also gaining popularity due to its excellent corrosion 36
resistance and high tensile strength. Unlike steel, the GFRP bars do not yield and could be assumed to 37
possess a linear elastic behaviour until failure [4]. GFRP bars have a much lower elastic modulus than 38
steel, therefore they are more susceptible to buckling in compression [5]. Therefore, the unrestrained 39
distance should be reduced by decreasing the spacing of the transverse reinforcement, such as spirals, 40
hoops or stirrups. The short spacing also increased the overall stiffness of the transverse reinforcement, 41
delaying rupturing failures. It was found that by increasing the transverse reinforcement ratio, the load 42
capacity of the members significantly increased [6,7], which demonstrated the contribution of 43
longitudinal GFRP bars in compression. However, international GFRP-reinforced concrete design 44
standards such as ACI 440.1-R15 [8] and CAN/CSA S806-12 [9] do not recommend the inclusion of 45
GFRP bars in the load capacity of the members in compression. Therefore, a better understanding is 46
required for more efficient designs using GFRP. 47
As the concrete continues to rise in compressive strength and reduce in ductility, the ability to predict 48
the load-displacement curves becomes increasingly important. Analytical models were developed for 49
requirement becomes more apparent for GFRP-reinforced members due to GFRP’s inability to yield. 51
For steel-reinforced OPC systems, a handful of analytical models were available. Various confinement 52
models were proposed for axially loaded reinforcement concrete columns. Mander et al. [10] proposed 53
a set of formulations for square, rectangular and circular reinforcement arrangements, which was widely 54
accepted by the research community. However, the opinions on the stress-strain relationship of the 55
eccentrically loaded columns were divided into a few main categories [11]. The first group considered 56
the same stress-strain relationship could be used for both concentrically and eccentrically loaded 57
columns [12,13]. Alternatively, it was believed that a separate stress-strain model must be proposed for 58
eccentrically loaded columns due to the flexural loading [14,15]. The strain-gradient had an influence 59
on the stress distribution in the concrete section, thus affecting the load capacity and ductility of the 60
member. The confinement level varied in each strip of concrete in the cross-section, resulting in a 61
distinct stress-strain relationship. This could be simplified by establishing a model that incorporates the 62
strain gradient effect. Ho and Peng [16] proposed a set of empirical equations for the inverted T-shaped 63
specimens and found good agreements between experimental and predicted results. Feng and Ding [17] 64
introduced the concept of equivalent confinement volume to Mander’s model and found that the 65
analytical results matched experimental results closely. 66
A number of research works reported on the behaviour of concentrically or eccentrically loaded GPC 67
or OPC concrete columns fully reinforced with GFRP bars and stirrups. The contribution of longitudinal 68
GFRP bars to the column load carrying capacity varied from 3% to 11% [5,18–21]. The variability was 69
mainly attributed to the amount of transverse reinforcement. For example, the axially loaded column 70
with 75 mm stirrup spacing had a 13.7% and 30.4% higher load carrying capacity than that with a 150 71
mm and 250 mm stirrup spacing, respectively [5]. Additionally, a high transverse reinforcement ratio 72
improved the ductility of the columns and prevented catastrophic brittle failures [5,7]. Overall, GFRP-73
reinforced columns were more susceptible to slenderness effects than steel due to the lower modulus of 74
GFRP [22]. It was recommended to adopt a slenderness limit of 17 instead of 22 for steel [22]. The 75
main difference between GPC and OPC concrete was that GPC columns had reduced moment 76
[23]. Despite of the distinct behaviour of GFRP-GPC systems from steel-OPC concrete systems, no 78
analytical analysis was carried out for GFRP-reinforced GPC or OPC concrete columns. 79
The literature review highlighted the lack of analytical models for GFRP-reinforced GPC systems. In 80
this study, an analytical model based on flexural analysis was proposed for GFRP-reinforced GPC 81
columns under concentric or eccentric loading. The model was established on the existing principles 82
for modelling the behaviour of steel-reinforced OPC concrete members. It integrated the effect of strain 83
gradient of the confining pressure produced by the transverse GFRP stirrups. Justifications were made 84
to reflect the differences in concrete and reinforcement types, and the loss of load capacity of the 85
concrete cover after spalling. The coefficient of effectiveness was also adjusted accordingly to suit the 86
particular sections studied in this work. The theoretical results were compared against the experimental 87
results for both GFRP-reinforced GPC and OPC concrete columns reported in the literature [5,24]. 88
2. Experimental setup 89
An experimental investigation of 9 GFRP-reinforced GPC columns was carried out by Elchalakani et 90
al. [5]. The GPC mix had by mass: 15% binder, 6.5% alkali activator mixed with 6.1% water and 0.1% 91
superplasticiser, 29.4% fine aggregates, and 47.3% coarse aggregates. The equal parts fly ash and 92
ground granulated blast-furnace slag (GGBS) binder allowed the specimens to be cured in ambient 93
conditions. The 28-day compressive strength (f’c) of the GPC was 26.0 MPa. Three specimens with a 94
stirrup spacing of 75 mm, 150 mm and 250 mm were tested under concentric loading and the other six 95
specimens with a 75 mm or 150 mm stirrup spacing were tested at 25 mm, 50 mm and 75 mm 96
eccentricities (e). The low, medium and high eccentricities were selected to examine the effect of 97
bending moment on load capacities. All the specimens have the same rectangular cross-section of b × 98
d = 260 mm × 160 mm and height of h = 1200 mm. The specimens were fully reinforced by GFRP bars 99
and stirrups. The longitudinal bars were 14 mm in diameter and the 8 mm stirrups were used as 100
transverse reinforcement. A 20 mm concrete cover was selected due to the stronger corrosion resistance 101
103
[image:5.595.148.446.80.555.2]104
Figure 1. The schematics of the columns 105
106
The GFRP-reinforced OPC concrete columns constructed by Elchalakani et al. [24] had a similar cross-107
concentric and eccentric loading. Another 6 columns were constructed with steel rebars and steel ties. 109
The effect of high load eccentricity was not studied. The f’c of OPC concrete was 32.8 MPa, 110
corresponding to 26.2% higher compressive strength than GPC. The OPC concrete columns were 111
reinforced with 12 mm longitudinal GFRP bars and 6 mm GFRP stirrups. The same 20 mm cover was 112
used in GFRP-reinforced specimens where a 40 mm cover was adopted for steel-reinforced specimens. 113
The specimens in both studies were tested to failure using a universal testing machine with a capacity 114
of 2000 kN. A load-controlled regime was used as the displacement-controlled regime was not available 115
on the machine. A loading rate of 20 kN/min was applied to the column specimens. The eccentricity 116
was provided through a pair of steel rollers welded to the top and bottom end plates of the columns. 117
The rotation about the weaker axis was allowed to ensure that the capacity of the testing machine was 118
sufficient to load the specimens to failure. The specimens were designated in terms of the concrete type 119
(“G” for GPC, “O” for OPC concrete, “S” for steel reinforced OPC concrete), the stirrup spacing in 120
millimetre and the loading condition (“C” for concentric loading, “F” for flexural loading or a number 121
corresponding to the eccentricity in millimetre). For example, “G75-150” represents the GFRP-122
reinforced GPC column with a 75 mm stirrup spacing loaded at a 150 mm eccentricity. The key design 123
parameters of the specimens tested in the two studies were summarised in Table 1. 124
3. Analytical model 125
The constitutive models used for confined geopolymer concrete, steel and the procedure used in 126
obtaining the load-deformation curves are described in the following sub sections. 127
3.1 Proposed stress-strain model for confined geopolymer concrete
128
The model proposed in this paper was initially developed by the authors for normal and high strength 129
concrete. Further details of the model can be found elsewhere [25]. Two different exponential curves 130
form the complete stress-strain relationships for confined normal strength concrete and geopolymer 131
concrete. The terms described in this constitutive model are shown in Figure 2. 132
134
Figure 2. Terms used in the stress-strain relationship for geopolymer concrete. 135
136
The uniqueness of this model is that it can predict the lateral deformation as well which can be used to 137
find the confinement exerted by the confining steel or FRP. The confined region was determined based 138
on the recommendations by Mander et al. [10], as illustrated in Figure 3. The constitutive model is 139
briefly described here for the convenience of the reader. 140
141
142
[image:7.595.79.514.419.718.2]144
Axial strain (ε1) is related to lateral strain (ε2) as follows: 145
(1)
146
εcc and ε’cc are axial and lateral strains corresponding to peak axial stress. Parameter a is a function of 147
the uniaxial concrete strength (fc) and it is a property of the material. It is given as in Equation 2. 148 149
2818
.
1
0177
.
0
a
f
c
(2) 150
Equation 1 can be used to find ε' as follows: 151
𝜀′ = 𝜀 𝑐𝑐(𝑣𝑖𝑎)
1
𝑎−1 (3)
152
The initial Poisson’s ratio (
a i
) is given as below: 153
(4)
Equation 1 completely defines the relationship between axial strain and lateral strain if axial strain (εcc) 154
and lateral strain (ε’cc) corresponding to peak axial stress are known. Axial strain corresponding to peak 155
axial stress
cccan be expressed as follows.156
(5)
fl is the confining pressure and εco is the axial strain corresponding to the peak uniaxial compressive 157
strength. Peak axial stress for confined concrete fcc is defined as: 158
'
if
'
if
'
1 1 1 1 2
a cc cc a i cc138
.
0
0002
.
0
)
(
10
8
6 2
c c
a
i
f
f
(6)
where
k
is a constant given by: 159(7)
ft is the tensile strength which is given by: 160
(8)
For a given axial strain, Equations 1-8 can predict the lateral strain if the peak stress and corresponding 161
lateral strain are known for unconfined concrete strength. The following section describes how to find 162
the lateral strain corresponding to peak axial stress. 163
Similar to the observations for normal and high strength concrete [25] and for geopolymer paste [26] 164
it is assumed that geopolymer concrete samples will return to the original volume when the axial strain 165
is corresponding to the peak axial stress. Therefore, at peak stress: 166
(9)
167
(10)
Using the secant value of Poisson's ratio at peak stress (
a f
), Equation 10 can be re-written as follows: 168
(11)
Using shear stress and shear strain factors, axial stress (
1), axial strain (
1) and lateral strain (
2)169
relationships for normal/ geopolymer concrete can be expressed as: 170 k t l c cc
f
f
f
f
1
21 . 0)
(
062
.
0
1
25
.
1
c c lf
f
f
k
67 . 0)
(
32
.
0
9
.
0
c tf
f
0
2
max ,
2 1
v v
cc cc2
'
(12)
171
c and d are material parameters defined as follows: 172
𝑐 = −0.1𝑓𝑐+ 𝑚 and 𝑑 = −0.0003𝑓𝑐− 0.0057 (13)
173
c is the only material parameter that was modified for normal concrete and geopolymer concrete. m for 174
OPC concrete was used as 5 and that for geopolymer concrete was used as 7. 175
mp
is the maximum shear stress at peak and
mp is the corresponding shear strain and are defined in176
Equation 14. 177
(14)
Therefore, Equations 1-14 completely define the deformational behaviour of geopolymer concrete. 178
3.2 Stress-strain model for longitudinal bars
179
A simple idealised elasto-plastic stress-strain model was used for steel in this investigation. 180
𝑓𝑠= {
𝐸𝑠𝑡𝜀𝑠 𝑖𝑓 0 ≤ 𝜀𝑠≤ 𝜀𝑦
𝑓𝑠𝑦 𝑖𝑓 𝜀𝑠> 𝜀𝑦 (15)
181
where fs and εs are steel stress and strain respectively, Est is the modulus of elasticity and fsy and εy are 182
the yield strength and corresponding yield strain of steel. 183
FRP bars are modelled using the below equation. 184
𝑓𝑓𝑟𝑝= {
𝐸𝑓𝑟𝑝𝜀𝑓𝑟𝑝 𝑖𝑓 0 ≤ 𝜀𝑓𝑟𝑝≤ 𝜀𝑢
0 𝑖𝑓 𝜀𝑓𝑟𝑝 > 𝜀𝑢 (16)
where ffrp and εfrp are steel stress and strain respectively, Efrp is the modulus of elasticity and εu is the 186
ultimate strength of FRP bars. 187
3.3 Load-deformation relationships
188
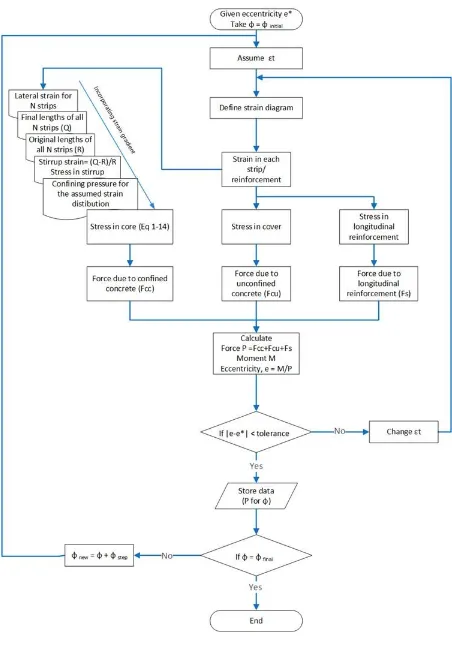
In the analysis process, the section is divided into a number of strips (N). As opposed to concentrically 189
loaded columns, eccentrically loaded columns are subjected to a strain gradient as shown in Figure 4. 190
In order to draw the load deformation curves, a range for the curvature is defined (φinitial = 0 to φfinal in 191
steps of φstep). For an assumed strain distribution (using the given curvature, φ and the assumed strain 192
at extreme compression side, εt), strains for each strip as well as for each reinforcement are first 193
determined. Stresses in the core, cover and reinforcement are calculated using the corresponding stress-194
strain relationships in the previous section. Cover concrete stresses are considered as unconfined 195
concrete stresses while the stresses in reinforcements are obtained using either Equations 15 or 16 for 196
the corresponding strain. For the above assumed strain distribution, the following steps are used to find 197
the stresses in core concrete: 198
Use Equation 1 to find the lateral strain for each of the N number of strips. This is used to final 199
the final lengths for each strip. 200
Deduct the total original lengths of all the N strips (R) from the total final lengths of all the N
201
strips (Q). Use this to find the strain and finally the stress in the stirrup which is used to find 202
the confining pressure provided to the core. 203
Use Equations 1-14 to find the confined concrete stress for each strip in the core. 204
Using all the stresses, forces in core, cover and reinforcement are calculated which are used to find the 205
applied load, the moment and the resulting eccentricity for the assumed strain at extreme compression 206
side, εt. For a given curvature, φ and eccentricity, e*, εt is iterated until the calculated eccentricity is 207
equal to the actual eccentricity within a given tolerance level. At this point, calculated load is stored for 208
the corresponding curvature which was used to calculate the deformation. This process is repeated until 209
the curvature reaches φfinal. The procedure used in getting the load-deflection curve is shown in Figure 210
212
[image:12.595.161.445.104.329.2]213
Figure 4. The strain gradient in the cross-section 214
216
Figure 5. Flow chart used to draw load-deflection curves 217
4. Comparisons and discussions 219
4.1 Predicted load and displacement
220
The experimental and theoretical results are summarised in Table 2. Overall, the theoretical predictions 221
matched well with the experimental results. The predicted loads for GFRP-GPC, GFPR-OPC concrete 222
and steel-OPC concrete all had an average variation of 6% from the experimental data. The variations 223
of the predicted displacements at peak load ranged between 7%-8%. The main discrepancy in the load 224
predictions came from specimens loaded at higher eccentricities. For example, the load capacities of 225
specimen G75-75 and G150-75 loaded at a very high eccentricity of 75 mm were over-predicted by 226
17% and 10%, respectively, whereas their corresponding concentrically loaded columns had a 1% and 227
2% variation, respectively. The over-prediction was less severe in GFRP-OPC concrete and steel-OPC 228
concrete systems. The predicted loads were on average 2% and 5%, respectively, lower than the 229
experimental results, as compared to an average 2% over-prediction for GFRP-GPC systems. It was 230
pointed out that reinforced GPC columns tended to have a reduced rectangular stress block [23]. 231
Therefore, as the moment increased in the cross-section, the load capacity was significantly affected. 232
However, the proposed analytical solution was still valid for GFRP-GPC systems. A 97% accuracy was 233
achieved for GFRP-GPC columns loaded at no eccentricity to medium eccentricities. The predicted 234
deflections did not have a clear trend, however a high accuracy of 92% was achieved for all the 235
specimens. 236
4.2 Predicted ductility
237
As a load-controlled loading regime was adopted for both studies, a special method (Equation 17) 238
proposed in Elchalakani et al. [24] was used to measure the ductility of the columns. 239
𝐷𝐼 =𝐴𝐷𝐸
𝐴𝐵𝐶 (17)
240
The ductility index (DI) was a ratio of the work done post peak to the work done in the elastic range. 241
The former was represented by the area ADE under the load-displacement curve, up to the point on the 242
ABC up to 75% peak load in the elastic range. The method was illustrated in Figure 6. The DI values 244
of all the experimental curves and theoretical predictions are reported in Table 2. The ductility of the 245
GFRP-GPC columns was on average the highest (2.9) among the three groups, followed by GFRP-OPC 246
concrete columns (2.4) and finally the steel-OPC concrete columns (2.3). It could be seen that a 247
combination of GFRP bars and GFRP stirrups could improve the ductility over their steel counterpart, 248
despite that GFRP reinforcement did not yield and have lower stiffness. The columns reinforced with 249
steel rebars and stirrups were able to reach a higher peak load, however with a reduced ductility. The 250
steel-reinforced columns had the lowest ductility indices among the three groups, which was likely 251
attributed to the stiffer response of the steel stirrups. It was reported that the GFRP stirrups gradually 252
opened up post peak, causing a more steadier loss of capacity observed in specimens such as G75-C [5]. 253
The reason that GPC columns outperformed OPC concrete columns was that the transverse 254
reinforcement use in the GPC columns was larger in size, which provided better restraint to the 255
longitudinal bars and better confinement to the concrete. 256
257
[image:15.595.133.465.440.701.2]258
260
The analytical results of GFRP-GPC columns were on average the same (2.9) as the experimental 261
results, showing that the model was appropriate for GPC columns. The model tended to slightly over-262
predict the ductility of GFRP-GPC columns loaded at no or low eccentricities and under-estimate those 263
loaded at higher eccentricities. In comparison, the ductility of all the OPC concrete columns reinforced 264
with steel or GFRP was over-estimated. The average predicted ductility was 3.5 and 2.8 for steel and 265
GFRP reinforced OPC concrete columns, respectively. The reason was likely that a stiffer elastic range 266
was assumed in the analytical model, resulting in a lower ADE value and a greater ductility than tested. 267
The steel-reinforced columns had the lowest ductility indices, similar to the experimental results. 268
4.3 Steel-reinforced OPC concrete columns
269
For steel-reinforced columns as shown in Figure 7, the analytical model was able to produce accurate 270
peak loads and deflections at peak load. For S75-C, the discrepancy was relatively small and the 271
predicted curve successfully captured the rising and descending segments. However, the predicted 272
elastic range of S75-25 and S75-35 were stiffer than the experimental curves, which resulted in a large 273
predicted ductility. The peak loads of the two columns were slightly under-estimated by the analytical 274
model. A similar trend was observed for those with 150 mm stirrup spacing. The behaviour of the 275
concentrically loaded S150-75 was accurately modelled, however the peak loads of those loaded at an 276
eccentricity were over-estimated. Due to the reduced transverse reinforcement ratio, 25 and S150-277
45 loaded at an eccentricity failed in a more brittle manner. Expectedly, lower residual strengths were 278
seen in the analytical results than the columns with 75 mm stirrup spacing. However, they were still 279
higher than test results, which caused the over-estimation of ductility. 280
282
[image:17.595.120.481.72.527.2]283
Figure 7. Experimental and predicted axial load-axial displacement curves for steel-reinforced OPC 284
concrete columns 285
286
4.4 GFRP-reinforced OPC concrete columns
287
The behaviour of the GFRP-reinforced OPC concrete columns was generally well captured by the 288
analytical model. A 6% and 8% variation in peak loads and their corresponding displacements from the 289
experimental results is observed in Figure 8, respectively. The rising and descending curves of the 290
concentrically loaded columns from the analytical model were moderately accurate. However, similar 291
0
200
400
600
800
1000
1200
1400
1600
1800
0
2
4
6
8
10
12
S75-C
S75-C (Analytical) S75-25
S75-25 (Analytical) S75-35
S75-35 (Analytical)
Axial Displacement (mm)
A
xi
al
Load
(k
N
)
0
200
400
600
800
1000
1200
1400
1600
1800
0
2
4
6
8
10
12
S150-C
S150-C (Analytical) S150-25
S150-25 (Analytical) S150-45
S150-45 (Analytical)
Axial Displacement (mm)
A
xi
al
Load
(k
N
to the OPC concrete reinforced with steel rebars and stirrups, the elastic ranges of the eccentrically 292
loaded columns were stiffer than the test results, resulting in larger ductility indices. The post peak 293
responses of the columns with 75 mm stirrup spacing were well modelled by the theoretical predictions. 294
Similar trends were observed for columns with 150 mm stirrup spacing. However, the O150-45 failed 295
in a brittle manner and was not shown in the predicted curve. In terms of columns with large stirrup 296
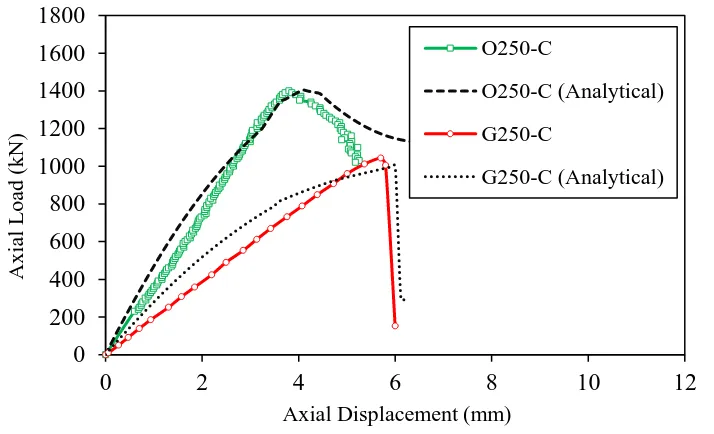
spacings as shown in Figure 9, the predicted behaviour of O250-C also agreed well with the 297
experimental results, similar to O75-C and O150-C. 298
299
[image:18.595.122.479.261.707.2]300
Figure 8. The axial load-axial displacement curves of GFRP-reinforced OPC concrete columns 301
302
0
200
400
600
800
1000
1200
1400
1600
1800
0
2
4
6
8
10
12
O75-C
O75-C (Analytical) O75-25
O75-25 (Analytical) O75-35
O75-35 (Analytical)
Axial Displacement (mm)
A
xi
al
Load
(k
N
)
0
200
400
600
800
1000
1200
1400
1600
1800
0
2
4
6
8
10
12
O150-C
O150-C (Analytical) O150-25
O150-25 (Analytical) O150-45
O150-45 (Analytical)
Axial Displacement (mm)
A
xi
al
Load
(k
N
303
Figure 9. The load-displacement curves of O250-C and G250-C 304
305
4.5 GFRP-reinforced geopolymer concrete columns
306
Figure 10 and 11 show the predicted axial load-axial displacement curves of the GFRP-GPC columns 307
loaded at zero to medium eccentricity (50 mm), and high eccentricity (75 mm), respectively. The GFRP-308
GPC columns were most accurately modelled in the elastic ranges and post peak collapse curves. 309
Therefore, the variations in peak loads, displacements at peak load and ductility indices were 310
satisfactory at 6%, 7% and 18%, respectively. The predicted post peak responses also agreed well with 311
the experimental behaviour. The elastic range of the G75-C was better captured by the analytical model 312
than the OPC concrete specimens. As the load eccentricity increased, the inaccuracy of the results 313
increased. This was attributed to the susceptibility of GPC to bending moment [23]. The height of the 314
rectangular stress block was smaller than OPC concrete. Despite that, the model was successful in 315
accurately predicted the behaviour of GFRP-GPC columns loaded at no to medium eccentricity. The 316
columns with 150 mm stirrup spacing had more brittle responses than those with 75 mm stirrup spacing 317
as a result of the less effective transverse reinforcement. This was reflected by the lower DI values as 318
shown in Table 2. The predicted curve of G250-C was amended to Figure 9. From this figure, it could 319
be seen that with a similar geometry and reinforcement arrangement, the GPC columns had a softer 320
0
200
400
600
800
1000
1200
1400
1600
1800
0
2
4
6
8
10
12
O250-C
O250-C (Analytical) G250-C
G250-C (Analytical)
Axial Displacement (mm)
A
xi
al
Load
(k
N
elastic range. The post peak response of the GPC column was also more brittle, similar to G150-C. 321
Therefore, sufficient transverse reinforcement must be provided for GPC columns, due to its lower 322
elastic modulus than OPC concrete [3]. 323
324
325
[image:20.595.119.478.193.649.2]326
Figure 10. Comparison between analytical and experimental load-deflection curves of the GFRP-327
reinforced GPC columns 328
0
200
400
600
800
1000
1200
1400
1600
1800
0
2
4
6
8
10
12
G75-C G75-C (Analytical)
G75-25 G75-25 (Analytical) G75-50 G75-50 (Analytical)
Axial Displacement (mm)
A
xi
al
Load
(k
N
)
0
200
400
600
800
1000
1200
1400
1600
1800
0
2
4
6
8
10
12
G150-C G150-C (Analytical) G150-25 G150-25 (Analytical) G150-50 G150-50 (Analytical)
Axial Displacement (mm)
A
xi
al
Load
(k
N
329
Figure 11. The axial load-axial displacement curves of G75-75 and G150-75 330
331
5. Conclusions 332
A model was proposed to predict the load-displacement behaviour of the GPC columns fully reinforced 333
with GFRP bars and stirrups. The model was validated by experimental results, including GFRP-GPC, 334
GFRP-OPC concrete and steel-OPC concrete columns. 335
It was concluded that model was suitable for modelling the behaviour of the concentrically or 336
eccentrically loaded GFRP-reinforced GPC columns. On average, the analytical predictions were only 337
6% and 7% away from the experimental results. The elastic and post peak behaviour could be accurately 338
predicted up to medium eccentricity (e/d = 0.31). As the eccentricity continued to increase, the accuracy 339
of the model reduced. The proposed model could be applied to the GFRP-reinforced GPC columns. 340
The model was able to produce accurate predictions of GFRP and steel-reinforced OPC concrete 341
columns. A larger variation of the predicted ductility of GFRP or steel-reinforced OPC concrete 342
columns was observed. The model tended to over-estimate the stiffness of the OPC concrete columns 343
in the elastic range, resulting in an over-estimation of the ductility. In comparison, the stiffness of most 344
GPC columns was accurately modelled in the elastic range. 345
0
50
100
150
200
250
300
0
5
10
15
20
25
30
G75-75
G75-75 (Analytical) G150-75
G150-75 (Analytical)
Axial Displacement (mm)
A
xi
al
Load
(k
N
Acknowledgements 346
The authors are grateful for the donations and support provided by Pultron Composites, New Zealand 347
and Anthony Miles from Sika Australia. 348
References 349
[1] Palomo A, Blanco-Varela MT, Granizo ML, Puertas F, Vazquez T, Grutzeck MW. Chemical 350
stability of cementitious materials based on metakaolin. Cem Concr Res 1999;29:997–1004. 351
doi:10.1016/S0008-8846(99)00074-5. 352
[2] Singh B, Ishwarya G, Gupta M, Bhattacharyya SK. Geopolymer concrete: A review of some 353
recent developments. Constr Build Mater 2015;85:78–90. 354
doi:10.1016/j.conbuildmat.2015.03.036. 355
[3] Ganesan N, Abraham R, Deepa Raj S, Sasi D. Stress-strain behaviour of confined Geopolymer 356
concrete. Constr Build Mater 2014;73:326–31. doi:10.1016/j.conbuildmat.2014.09.092. 357
[4] Ibrahim AMA, Fahmy MFM, Wu Z. 3D finite element modeling of bond-controlled behavior 358
of steel and basalt FRP-reinforced concrete square bridge columns under lateral loading. 359
Compos Struct 2016;143:33–52. doi:10.1016/j.compstruct.2016.01.014. 360
[5] Elchalakani M, Dong M, Karrech A, Li G, Mohamed Ali MS, Yang B. Experimental 361
Investigation of Rectangular Air-Cured Geopolymer Concrete Columns Reinforced with 362
GFRP Bars and Stirrups. J OfComposites Constr 2019. doi:10.1061/(ASCE)CC.1943-363
5614.0000938. 364
[6] Hadi M, Karim H, Sheikh N. Experimental investigations on circular concrete columns 365
reinforced with GFRP bars and helices under different loading conditions. J Compos Constr 366
2016;20:04016009. 367
[7] Elchalakani M, Dong M, Karrech A, Li G, Mohamed Ali MS, Manalo A. Behaviour and 368
design of air cured GFRP-reinforced geopolymer concrete square columns. Mag Concr Res 369
[8] ACI 440.1R-15. Guide for the Design and Construction of Concrete Reinforced with FRP 371
Bars. Farmington Hills, MI, USA: American Concrete Institute; 2015. 372
doi:10.1061/40753(171)158. 373
[9] CAN/CSA S806-12. Design and Construction of Building Components with Fibre-Reinforced 374
Polymers. Ontario: Canadian Standards Association; 2017. 375
[10] Mander JB, Priestley JN, Park R. Theoretical Stress-Strain Model for Confined Concrete. J 376
Struct Eng 1988;114:1804–26. 377
[11] Lokuge WP, Setunge ÃS, Sanjayan JGÃ. Modelling eccentrically loaded high-strength 378
concrete columns 2003:331–41. doi:10.1680/macr.55.4.331.37587. 379
[12] Eivind Hognestad and Douglas McHenry NWH. Concrete Stress Distribution in Ultimate 380
Strength Design. J Proc 1995;52. doi:10.14359/11609. 381
[13] Karsan ID, Jirsa JO. Behaviour of concrete under varying strain gradient. J Struct Eng 382
1970;8:1675–96. 383
[14] Sargin M, Ghosh SK, Handa VK. Effects of Lateral Reinforcement upon the Strength and 384
Deformation Properties of Concrete. Mag Concr Res 1971;23:99–110. 385
[15] Sheikh SA, Yeh CC. Analytical Moment‐Curvature Relations for Tied Concrete Columns. J 386
Struct Eng 2007;118:529–44. doi:10.1061/(asce)0733-9445(1992)118:2(529). 387
[16] Ho JCM, Peng J. Strain-Gradient-Dependent Stress-Strain Curve for Normal-Strength 388
Concrete. Adv Struct Eng 2013;16:1911–30. doi:10.1260/1369-4332.16.11.1911. 389
[17] Feng D-C, Ding Z-D. A new confined concrete model considering the strain gradient effect for 390
RC columns under eccentric loading. Mag Concr Res 2018;70:1189–204. 391
doi:10.1680/jmacr.18.00040. 392
[18] Elchalakani M, Ma G, Aslani F, Duan W. Design of GFRP-reinforced rectangular concrete 393
[19] Afifi MZ, Mohamed HM, Benmokrane B. Axial Capacity of Circular Concrete Columns 395
Reinforced with GFRP Bars and Spirals. J Compos Constr 2014;18:04013017. 396
doi:10.1061/(ASCE)CC.1943-5614.0000438. 397
[20] Tobbi H, Farghaly AS, Benmokrane B. Concrete columns reinforced longitudinally and 398
transversally with glass fiber-reinforced polymer bars. ACI Struct J 2012;109:551–8. 399
doi:10.14359/51683874. 400
[21] Pantelides CP, Gibbons ME, Reaveley LD. Axial Load Behavior of Concrete Columns 401
Confined with GFRP Spirals. J Compos Constr 2013;17:305–13. 402
doi:10.1061/(ASCE)CC.1943-5614.0000357. 403
[22] Mirmiran A, Yuan W, Chen X. Design for slenderness in concrete columns internally 404
reinforced with fiber-reinforced polymer bars. ACI Struct J 2001;98:116–25. 405
doi:10.14359/10153. 406
[23] Tran TT, Pham TM, Hao H. Rectangular Stress-block Parameters for Fly-ash and Slag Based 407
Geopolymer Concrete. Structures 2019;19:143–55. doi:10.1016/j.istruc.2019.01.006. 408
[24] Elchalakani M, Ma G. Tests of glass fibre reinforced polymer rectangular concrete columns 409
subjected to concentric and eccentric axial loading. Eng Struct 2017;151:93–104. 410
doi:10.1016/j.engstruct.2017.08.023. 411
[25] Lokuge WP, Sanjayan JG, Setunge S. Stress strain model for laterally confined concrete. J 412
Mater Civ Eng 2005;17:607–16. 413
[26] Haider GM, Sanjayan JG, Ranjith PG. Complete triaxial stress-strain curves for geopolymer. 414
Constr Build Mater 2014;69:196–202. doi:10.1016/j.conbuildmat.2014.07.058. 415