1
Comparison of the Effects and Distribution of Zinc Oxide Nanoparticles and Zinc Ions in 1
Activated Sludge Reactors 2
3 4
DONGQING ZHANG1, ANTOINE P. TRZCINSKI2*, HYUN-SUK OH3, EVELYN CHEW1,
5
YU LIU1, SOON KEAT TAN1, WUN JERN NG1.
6 7
1Advanced Environmental Biotechnology Centre, Nanyang Environment and Water Research 8
Institute, 1 Cleantech loop, #06-10, Singapore 637141. 9
10
2University of Southern Queensland, School of Civil Engineering & Surveying, Faculty of 11
Health, Engineering and Sciences, 4350 Australia. 12
13
3Singapore Membrane Technology Centre, Nanyang Environment and Water Research Institute, 14
1 Cleantech loop, #06-10, Singapore 637141. 15
16 17 18
19
*Address correspondence to Dr Antoine TRZCINSKI, School of Civil Engineering & Surveying,
20
Faculty of Health, Engineering and Sciences, University of Southern Queensland, 4350 Australia,
21
Telephone number: +61 7 4631 1617;
22
Email: [email protected],
23
2 Abstract
26 27
Zinc Oxide nanoparticles (ZnO NPs) are increasingly applied in the industry which results
28
inevitably in their release of these materials into the hydrosphere. In this study, simulated waste
29
activated sludge experiments were conducted to investigate the effects of Zinc Oxide NPs and
30
compare it with its ionic counterpart (as ZnSO4). It was found that even 1 mg/L ZnO NPs could 31
have a small impact on COD and ammonia removal. Under 1, 10 and 50 mg/L ZnO NPs
32
exposure, the Chemical Oxygen Demand (COD) removal efficiencies decreased from 79.8% to
33
78.9%, 72.7% and 65.7%, respectively. The corresponding ammonium (NH4-N) concentration in 34
the effluent significantly (p < 0.05) increased from 11.9 mg/L (control) to 15.3, 20.9 and 28.5
35
mg/L, respectively. Under equal Zn concentration, zinc ions were more toxic towards
36
microorganisms compared to ZnO NPs. Under 50 mg/L exposure, the effluent Zn level was 5.69
37
mg/L, implying that ZnO NPs have a strong affinity for activated sludge. The adsorption
38
capacity of ZnO NPs onto activated sludge were found to be 2.3, 6.3, and 13.9 mg/g SS at
39
influent ZnO NP concentrations of 1.0, 10 and 50 mg/L respectively, which were 1.74, 2.13 and
40
2.05 fold more than under Zn ions exposure.
41 42
Keywords: ZnO nanoparticles; zinc ions; waste activated sludge; biosorption;
43 44
Introduction 45
46
Nanotechnology has become very popular over the last few decades due to significant advances
47
with applications in medicine and semiconductor, chemical and electronics industries. [1, 2] Zinc
48
oxide (ZnO) nanoparticles (NPs) is one of the most important engineered metal-oxide NPs in
49
electronic sensors, solar cells, coatings, pigments and optics due to its semiconductors properties
3
such as near UV emission and transparent conductivity. [3, 4] They are also applied for the
51
oxidation of environmental pollutants and personal care products and as disinfectants in
52
medicine due to their unique photolytic properties. [5]
53
It is reasonable to believe that an increase in their production and application in the modern
54
industries will inevitably result in their release into the environment and in particular in our
55
waterways. [2, 6] Wastewater treatment plants are considered the last barriers prior to the
56
environmental release of engineered NPs. [7] An environmentally relevant concentration of ZnO 57
NP in wastewater would be around 24-300 µg/L according to Sun et al. [8], but the concentration
58
is likely to be in the mg/L level in the next few years.[9]
59
Furthermore, ZnO NPs are one of the most toxic NPs produced. [10, 11] Farre et al. [12] reported
60
the half maximal effective concentration (EC50) to be in the range of tens of µg/L to several
61
mg/L. Their toxicity on bacteria and crustaceans was demonstrated with LC50 ranging from 0.1
62
to 10 mg/L for ZnO NPs as well as ZnSO4.[13, 14] The exact toxicity of NPs and ionic counterparts 63
on waste activated sludge is still not clear.
64
In this regard, the potential impact of ZnO NPs on the microbial community in wastewater
65
treatment processes have drawn increasing concern because biological treatment of wastewater
66
relies on bacteria to decompose organic matter and nitrogen compounds. In addition, the fate,
67
transport, and toxicity of NPs in wastewater treatment processes may differ largely from those of
68
their ionic counterparts, due to the differences in size and surface charge, potential for
69
biosorption or aggregation. [7] However, to date, knowledge on the fate and transformation of
70
ZnO NPs in wastewater treatment processes is still scarce. [15, 16] Interactions with natural organic
71
matter in real wastewater may result in different behaviour of Zn NPs. For instance, Zn ions can
72
generate complex with humic acids due to their carboxylic and phenolic groups or precipitate as
73
insoluble zinc hydroxide. Moreover, there is evident discord in the published literature regarding
74
the fate and behaviour of ZnO NPs, [17] as well as how this influences their toxicity. [18]
4
The objectives of this study were (a) to compare the short term effects and fate of ZnO NPs
76
and Zn2+ ions in a laboratory scale waste activated sludge process using sequencing batch reactor 77
(SBR) fed with real wastewater; (b) to investigate the effects of 1, 10 and 50 mg/L ZnO NPs on
78
COD and nitrogen removals; (c) to determine the accumulation of Zn ions in the effluent and
79
onto activated sludge over short term experiments; (d) to determine the morphology of activated
80
sludge using Scanning electron microscopy (SEM); (e) to assess the impacts of the presence of
81
ZnO NPs and Zn2+ ions on bacterial integrity using the Live/Dead Baclight bacterial viability 82
technique which was not used previously in particular under short term experiments (5 hours) at
83
concentrations as high at 50 mg/L.
84 85
Materials and methods 86
87
Activated sludge samples
88 89
Primary wastewater was collected from Ulu Pandan Water Reclamation Plant (WRP),
90
Singapore. The total treatment capacity of Ulu Pandan WRP is 361,000 m3 per day. The
91
treatment process includes typical preliminary, primary and secondary treatment processes. The
92
wastewater was collected from the effluent of the primary sedimentation tank. As Ulu Pandan
93
WPR treats combined industrial and domestic wastewater, the contaminant concentrations are
94
expected to be higher than those in common domestic WWTPs. Real wastewater was stored at
95
4°C until it was fed to the SBRs.
96 97
Set-up of Sequencing Batch Reactors (SBR)
5
SBRs were designed to simulate a full-scale operation of aeration and secondary clarification
100
as described by Hou et al. [19] Briefly, SBRs were set up in 500 mL glass beakers as reactors, 101
which were continuously operated for 15 days at 12 hours hydraulic retention time, allowing
102
acclimatization to reach a stable performance. The steady state was established by monitoring the
103
chemical oxygen demand (COD), ammonium and phosphate removal. The SBR cycle consisted
104
in aeration for 10 hours, followed by settling for 2 hours. The SBRs were seeded with nitrifying
105
sludge from Ulu Pandan WRP and adjusted to a mixed liquor suspended solid (MLSS)
106
concentration of 3 g/L, using the effluent from the primary clarifier at the same plant. In each
107
cycle, supernatants following settling were replaced with the effluent from the primary clarifier
108
to start the next cycle.
109
After 15 days of stabilisation period, three SBRs were spiked with ZnO NPs at the
110
concentrations of 1.0, 10, and 50 mg ZnO/L, respectively and three SBRs were spiked with
111
corresponding ionic salt (in the form of ZnSO4·7H2O) at concentration of 3.54, 35.4, and 177 mg 112
ZnSO4·7H2O/L such that both sets of SBR contained exactly 0.8, 8.0 and 40.0 mg Zn/L, 113
respectively. One SBR was employed as control with no Zinc addition. Each condition was
114
operated for one month and steady-state data were collected over three cycles to determine
115
average and standard deviation.
116 117
ZnO NPs characterization
118 119
The ZnO NPs were purchased from Sigma-Aldrich (Singapore) with an average particle size of
120
40±5 nm. ZnO NPs stock solutions (100 mg/L) were prepared by adding dry particles into
Milli-121
Q (pH=6.8±0.2), ultrasonicating the suspensions (30°C, 100 W, 40 kHz) for 30 min and shaking
122
for 2 h to increase their dispersion. The particle-size distribution and zeta potential of ZnO NPs
123
in the suspensions during 24-h incubation were measured using a Malvern Zetasizer Nano-ZS
6
(Malvern Instruments Ltd., UK). The morphology of the ZnO NPs was examined using
125
transmission electron microscopy (TEM) (JEOL JEM-3010, Japan).To avoid agglomeration or
126
aggregation, water bath ultrasonic treatment was carried out to increase their dispersion before
127
using the ZnO NPs suspension.
128 129
Analytical methods
130 131
Sampling commenced after 15 days of operation of reactor, in order to ensure stable operation.
132
Aliquots of completely mixed liquor suspensions were collected every 0.5 h over a period of 5 h.
133
Collected samples were first centrifuged for 20 min at 10,000 rpm (Eppendorf 5810R). The
134
supernatant was collected and the concentrations of COD, MLSS, ammonium (NH4-N) and 135
phosphate (PO43-) were determined according to Standard Methods.[20] All chemical tests were 136
done in duplicate.
137
Analysis of the released Zn2+ concentration in the supernatant was conducted after centrifugation
138
(10,000 rpm for 20 min). 0.5 mL of the supernatant was added to 4.5 mL of Milli-Q water
139
containing 2% ultra-high purity HNO3. [21] The resulting Zn2+ concentrations in the supernatant 140
were measured by MP-AES (4100, Agilent Technologies) in triplicate.
141
In addition to the liquid samples, the Zn level in the activated sludge was also analyzed after acid
142
digestion. The mixed liquor was first centrifuged at 10,000 rpm for 20 min (Eppendorf 5810R)
143
and the supernatant was removed. A 0.5 g sample of solid sludge was totally digested with 3 mL
144
nitric acid (69%, Sigma-Aldrich) followed by 1 mL hydrochloric acid (37%, Sigma-Aldrich) at
145
105ºC for 2h, followed by filtration through a 0.45 µm filter membrane (Whatman, USA). The
146
resulting solution was diluted to a final volume of 10 mL using Milli-Q water. The Zn2+ level in
147
the resulting solution was measured by MP-AES.
7
Bacterial viability assay
150 151
In order to shed light on the impact of ZnO NPs and zinc ions on bacteria integrity, Baclight
152
LIVE/DEAD bacterial viability kit was used (Molecular Probes, USA) as previously
153
described.[22]
154 155
Scanning electron microscopy (SEM) and transmission electron microscope (TEM) imaging
156 157
Samples were investigated using TEM and SEM. In the first case TEM, grids were prepared by
158
placing a drop of suspension (mixed liquor or supernatant) on a holey carbon grid and drawing
159
the suspension through the TEM grid using a paper tissue. The TEM grids were washed
160
afterwards in a drop of distilled water to remove the dissolved compounds. [23] The TEM was 161
operated at 200 kV to detect and characterize aggregation state of NPs in the solution.
162
To prepare SEM image, mixed liquor was first washed 3 times with 0.1 M phosphate buffer
163
solution (PBS) (pH 7.7) and fixed in 0.1 M phosphate buffer (7.4) containing 2.5%
164
glutaraldehyde at 4 °C for 4 h. The dried samples were coated with platinum before SEM
165
analysis according to Zheng et al.[21] The elemental analysis of the particles was carried out using 166
an energy-dispersive X-ray spectroscope (EDS).
167 168
Statistical analysis
169 170
The average ± standard deviation (SD) were reported for each concentration. In order to
171
determine the statistical significance between treatments the critical values through ANOVA
172
one-way analysis of variance were compared (SPSS Statistics V17.0). Results were deemed
173
different at p < 0.05.
8 175
Results and discussions 176
177
Characterization of engineered ZnO NPs
178 179
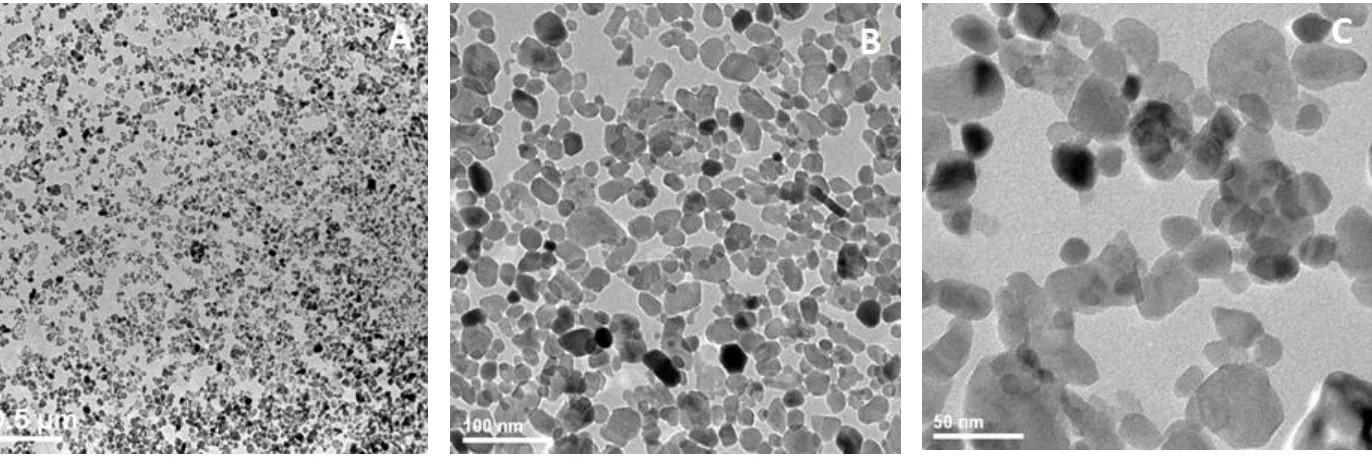
Figure 1 shows ZnO NPs in deionized water imaged by TEM with different scales (i.e., 0.5
180
µm and 500 nm). In the present study, due to their small size and huge surface area, ZnO NPs
181
tend to aggregate or agglomerate in aqueous phase. Although the ZnO NPs used in this study
182
have a diameter in the range of nanometers, some aggregates of different sizes formed in the
183
particle suspension, even after sonication. The size distribution of ZnO NPs is presented in
184
Supplementary Figure S1. The size ranged from 15 nm to 47 nm with a mean size of 33± 8 nm
185
(n=107), which confirmed the nano size range. The zeta potential was found to be -11.7 mV at
186
pH= 6.8 and -6.3 mV at pH=6.4 at the beginning and end of the experiment, respectively.
187 188 189 190
Removal of ZnO NPs and zinc ions in the activated sludge process
191 192
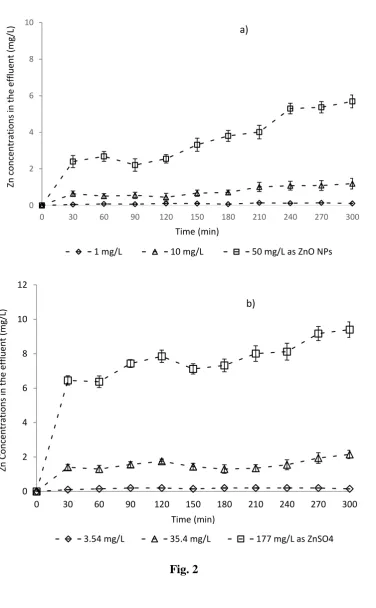
The Zn level in the biomass-free effluent is shown in Figure 2. After 5 h exposure (300 min), the
193
concentrations of soluble Zn2+ in the effluent were 0.11, 1.19 and 5.69 mg/L at the initial ZnO
194
NP concentration of 1.0, 10 and 50 mg/L, respectively. The higher concentrations of released
195
Zn2+ observed at the initial ZnO NP concentration of 50 mg/L might have been attributed to the 196
increased sludge surface charge and the decreased hydrophobicity resulting in more zincions
197
being released from ZnO NPs. [24] Interestingly, the released the Zn2+ levels in Zn2+ ionic
198
treatment (Figure 2B) (0.19, 2.15 and 9.41 mg/L, respectively) were significantly higher than
9
those in the NP treatment indicating that dissolution of Zn2+ was prevalent with ZnSO4. Less 200
Zn2+ was released from NP because humic acids are known to stabilize ZnO NP and retard 201
dissolution rates.[25] By comparison, in a recent study on the fate and behaviour of ZnO NPs in a
202
simulated WWTP, Musee et al. [17] reported an effluent Zn concentration of 1.39 mg/L after 240
203
hours of exposure. In the present study at 5 hours exposure, 86.3%, 85.1% and 85.8% of zinc
204
from ZnO NPs were retained in the sludge at initial ZnO concentrations of 1.0, 10 and 50 mg/L
205
respectively, showing that a large fraction of the ZnO NPs was removed from the wastewater due
206
to adsorption onto waste activated sludge. In contrast, Zn2+ treatment exhibited lower removal
207
efficiencies of 76.3%, 73.1% and 71.2%, compared to ZnO NP treatment.
208 209 210
Effect of ZnO NPs and Zn2+ ions on COD removal
211 212
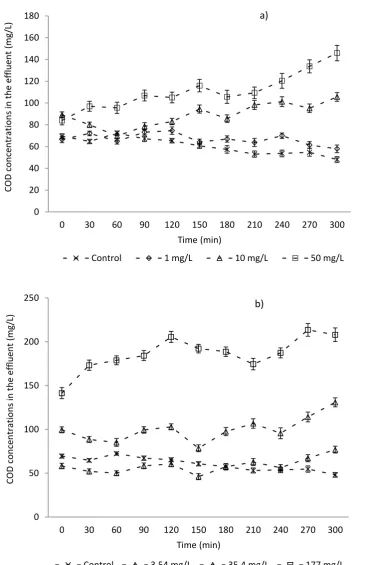
Prior to addition of ZnO NPs, the COD concentration in the effluent was around 66 mg/L (Figure
213
3) which corresponds to removal efficiency of 79.8%. However, the presence of ZnO NPs even
214
at 1 mg/L influenced the COD removal efficiencies, which slightly decreased to 78.9% (p <
215
0.05). The exposure to 10 and 50 mg/L ZnO NPs further decreased COD removal efficiencies to
216
72.7% and 65.7%, respectively. This is in disagreement with Chauque et al. [25] who reported no
217
effect on COD removal at 20 mg/L ZnO NP. Our findings contradict previous studies of the
218
effects of ZnO NPs on COD removal efficiencies. [16, 17] Tan et al. [26] investigated long-term
219
(240 days) effects of ZnO NPs on the system performance of a membrane bioreactor (MBR) and
220
reported that both short- and long-term exposure to 1.0 mg.L-1 of ZnO NPs did not significantly 221
affect COD removal, despite the fact that ZnO NPs may exhibit toxic effects on microorganisms.
222
Likewise, Puay et al. [16] evaluated the effects of ZnO NPs on system performance and bacterial
10
community dynamics of biological wastewater treatment in a lab-scale SBR (over 62 days), and
224
indicated that the removal of COD was not affected significantly by 1 mg/L ZnO NPs.
225 226
However, in the present study, negative impacts on COD removal efficiencies were indeed
227
observed at ZnO NPs concentrations as low as 1 mg/L. This findings suggest that industries
228
releasing high amounts of Zinc nanoparticles should capture NPs before their release or dilute
229
their effluent accordingly to avoid negative impacts on the waste activated sludge process. The
230
lower COD removal efficiencies in the presence of ZnO NPs at higher concentrations are mainly
231
attributed to the Zn2+ released from the ZnO NPs, and the high toxicity of the increasingly
232
abundant Zn2+ ions from ZnO NPs at higher concentrations further reduced the ability of
233
microorganisms to oxidise organic matter. [16, 26] Furthermore, efficient aggregation and proper
234
settling of flocs is of significant importance for the generation of good-quality effluent in the
235
activated sludge process. [27]
236
At concentrations of 10 and 50 mg/L, ZnSO4 exhibited lower COD removal of 68.2% and 42.7%, 237
compared to those of 72.7% and 65.6% in the presence of ZnO NPs. This finding suggests that
238
compared to ZnO NPs, Zn2+ ions exhibited acute toxicity towards microbes at high
239
concentrations, resulting in more severe inhibition of microorganisms. From Figures 2 and 3, it is
240
clear that ZnO NPs is less toxic than ZnSO4 due to the fact that Zn ions from ZnSO4 dissolve 241
more readily in water. Our findings are not in line with Heinlaan et al. [28] who reported that nano
242
ZnO and ZnSO4 exhibit similar toxicities to Vibrio fischeri (with LC50 of 1.1 versus 1.9 mg/L), 243
Daphnia magna (6.1 versus 3.2 mg/L) and Thamnocephalus platyurus (0.98 versus 0.18 mg/L).
244
Liu et al. [18] also suggested that the IC50 values of soluble Zn on activated sludge endogenous 245
respiration, BOD biodegradation, ammonia oxidation, and nitrite oxidation were 2.2, 1.3, 0.8,
246
and 7.3 mg-Zn/L, respectively. In this study, after the addition of 50 mg/L ZnO NPs (equivalent
247
to 40 mg/L Zn2+), the measured Zn2+ concentration in the effluent progressively increased to
11
only 5.7 mg/L after 5 hours, indicating a low dissolution potential of ZnO NPs in the system, a
249
finding consistent with a previous study.[21] However, it is likely that 5.7 mg/L was causing some 250
inhibition regardless of Zn ions origin which contradicts Hou et al. [29] who did not report
251
reduced COD removal at 5 mg/L. This can be explained by the fact that short term experiment
252
using non-acclimatized sludge were performed in this study. When ZnSO4 was used, the Zn2+ 253
concentration quickly increased to 6.5 mg/L after only 30 minutes and gradually increased to 9.4
254
mg/L after 300 minutes, which resulted in a greater toxicity.
255 256
Effect of ZnO NPs and Zn2+ ions on NH
4+-N removal
257 258
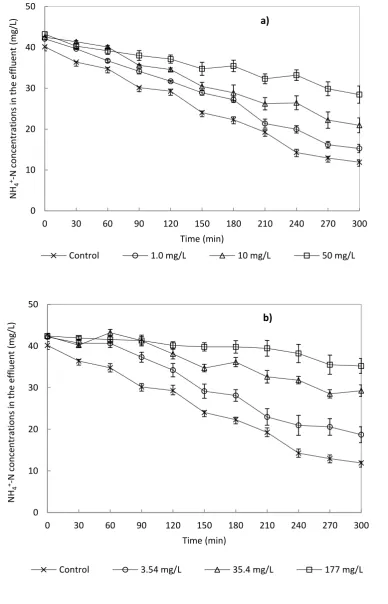
The effects of ZnO NPs and Zn2+ ions on NH4+-N removal are shown in Figure 4. Prior to the 259
ZnO NP exposure, the NH4+-N removal efficiency was 70.3%, but decreased to 63.8% in the 260
presence of ZnO NP at 1 mg/L. Under 10 and 50 mg/L ZnO NPs exposure, the effluent NH4+-N 261
significantly (p < 0.05) increased from 11.9 mg/L (control) to 20.9 and 28.5 mg/L, respectively.
262
This finding implies that the decrease in NH4+-N removal correlate with the inhibition of 263
nitrifying bacteria in the biomass even at low dose of ZnO NPs which was not reported
264
previously using real wastewater. Zheng et al.[21] evaluated the effects of ZnO NPs on 265
wastewater biological nitrogen removal by carrying out a short-term study (4.5 h) in a SBR, and
266
reported that the presence of 10 and 50 mg/L ZnO NPs decreased total nitrogen removal from
267
81.5% to 75.6% and 70.8%, respectively. Likewise, Tan et al.[26]indicated that a significant
268
decrease (p < 0.05) in NH4+-N removal was observed after ZnO NP exposure at concentrations 269
of 1.0 mg/L and 10.0 mg/L ZnO NPs (from 89.9% to 87.2% and 85.2%, respectively). Hou et al.
270
[29] indicated that even low ZnO NP concentrations of 5 mg/L exhibited a significantly negative 271
effect on NH4+-N removal in a simulated SBR process with an 11-d operation period, and 272
observed an 23.7% inhibition in nitrification during exposure to 5.0 mg/L ZnO NP. Additionally,
12
in the present study, effluent ammonia concentrations (18.7 mg/L, 29.3 mg/L and 35.2 mg/L,
274
respectively) in the presence of ZnSO4 were higher than those in the presence of ZnO NPs (15.3 275
mg/L, 20.9 mg/L and 28.5 mg/L, respectively), implying that Zn2+ ions exhibited more severe
276
toxicity to ammonia oxidizing bacteria than ZnO NPs. At high ZnO NPs concentration, the
277
increased release of Zn2+ led eventually to the onset of inhibition of ammonia-oxidizing activity.
278
This can also be explained by an increased production of reactive oxygen species (ROS). [21] At
279
higher NP concentration, the increased cell surface charge and the decreased hydrophobicity may
280
cause the worsened flocculating ability and dispersion of sludge flocs. [24]
281 282
Effect of ZnO NPs and Zn2+ ions on phosphate (PO
43-) uptake
283 284
In biological phosphorus removal systems, hydrolysis of polyphosphate causes soluble
ortho-285
phosphorus (SOP) release in the anaerobic stage, which is accompanied with
286
polyhydroxyalkanoaes (PHA) synthesis and glycogen consumption. [30] Therefore, biological
287
phosphorus removal relies largely on the anaerobic or low-DO conditions for the transformation
288
of intracellular PHA and glycogen. Besides biological removal, phosphorus can also be removed
289
by coagulation and precipitation using polycations.
290
Low PO43- removal efficiencies were expected in the present study due to the lack of anaerobic 291
and anoxic conditions. However, it can be seen from Figure 5A that prior to addition of ZnO NPs,
292
the PO43- removal efficiency was 24.1%. However, a marked (p < 0.05) decrease (17.9%, 11.8% 293
and 4.0%, respectively) was observed when activated sludge was exposed to 1.0, 10 and 50 mg
294
ZnO NPs L-1, respectively. This result showed that ZnO NPs inhibited uptake for cell synthesis. 295
Furthermore, coagulation with Zn2+ ions was not observed probably due to the small amount of
296
Zn2+ released. Similar results were found for the zinc salt treatment (Figure 5B). This finding is
297
13
to 34.3% compared to the control (47.5%), during exposure to 1 mg/L ZnO NPs. Our data
299
therefore showed that problems in nitrogen and phosphorus removal will occur in the waste
300
activated sludge at concentration of 1 mg/L.
301 302
Accumulation of ZnO NPs and zinc ions onto activated sludge
303 304
Activated sludge biomass from biological wastewater treatment processes is able to remove
305
heavy metals from wastewater, and biosorption plays an important role in heavy metal recovery.
306
[31, 32] More recently, ZnO NPs have been observed to bind onto waste activated sludge in SBR 307
processes, [16] in MBR processes [26] and in anaerobic digestion. [33] Different partitioning
308
mechanisms of engineered NPs to biosolids have been identified including binding to
309
extracellular polymers or cell surface, active cellular uptake, entrapment into flocs and diffusion
310
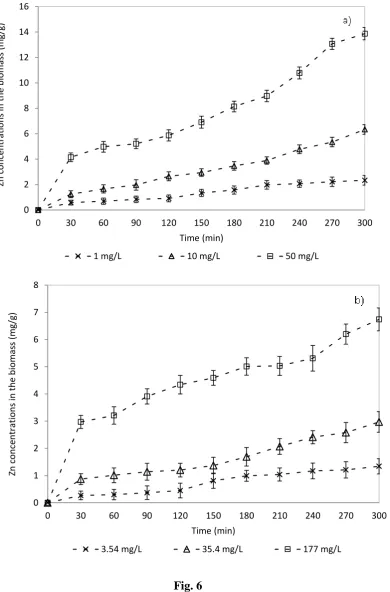
into biofilms [4]. In the present study, a gradual increase of Zn in biosolids was observed for both
311
ZnO NPs and Zn2+ ions treatment (Figure 6). The zinc levels were respectively 2.3, 6.3, and 13.9
312
mg/g MLSS at 1.0, 10 and 50 mg/L ZnO NP exposure after 5 h exposure. These Zn loadings
313
were 1.34, 2.97 and 6.74 mg/g MLSS in the ZnSO4 treatment. At 50 mg/L exposure, a mass 314
balance on Zn revealed that 88% of Zn from ZnO NPs ended up in biosolids and 12% in the
315
effluent. For ZnSO4, the mass balance was 68% onto biosolids and 32% in effluent. 316
By comparison, Musee et al. [17] investigated the fate and behaviour of ZnO NPs in a
317
simulated WWTP over 240 hours and reported a mean Zn concentration of 54 mg/g MLSS and
318
maximum Zn concentration of 112 mg/g MLSS in the sludge. This finding reinforces the results
319
of previous studies [34, 35] which indicated that engineering ZnO NPs showed strong affinity to 320
the sewage sludge rather than dissolution in the treatment effluent. The primary mechanism of
321
NP removal from wastewater is believed to depend upon biosorption onto biomass.
14
Our finding also showed that ZnO NPs have greater potential to be adsorbed onto biosolids
324
compared to Zn2+ ions. Furthermore, this biosorption capacity increased with the concentration 325
of ZnO NPs. This result is in good agreement with Lombi et al. [33] who investigated the fate of
326
ZnO NPs during anaerobic digestion of wastewater and reported that the partition coefficient (Kd)
327
of Zn was smaller in the salt treatment (637 L.kg-1) than for the ZnO NP treatments (915-1258
328
L.kg-1). Their results indicate that ZnO NPs have greater potential to be adsorbed onto anaerobic
329
sludge than Zn2+ ions, and that Zn derived from ZnO NPs was not partitioning in larger measure 330
in the solution phase when compared to the Zn2+ salt. In addition, these observations also support
331
the hypothesis that different mechanisms might govern the removal of ZnO NPs and Zn2+ ions
332
from wastewater. As for ZnO NPs, the attenuation of the ZnO NP concentration in the solution
333
phase is most likely due to precipitation of Zn species and ZnO NP adsorption onto the biomass.
334
In contrast, zinc salt quickly undergo dissolution followed by complexation and precipitation.
335 336
Adsorption of ZnO NPs and Zn2+ ions onto activated sludge
337 338
Engineered NPs can form aggregates in the wastewater sludge through agglomeration, which
339
involves the adherence of single or cluster of particles into larger masses due to attractive forces
340
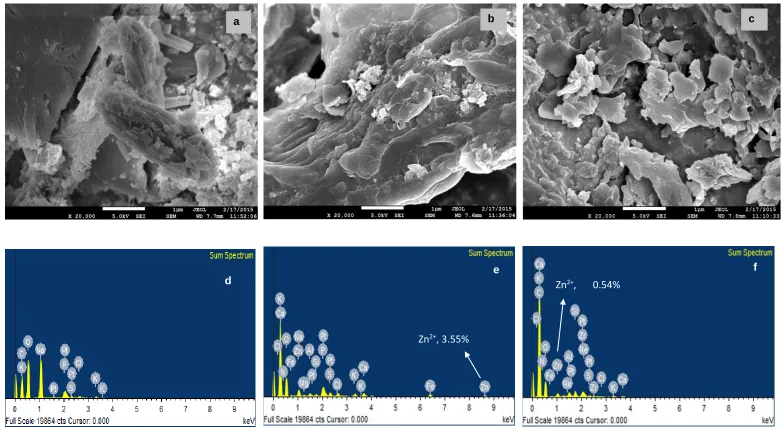
or chemical or mechanical binding. [11] In the present study, the morphological changes in
341
activated sludge induced by the aggregated ZnO NPs and irreversibly agglomerated Zn2+ were
342
observed by SEM (Figure 7A-7C). The SEM images clearly showed that there were large
343
numbers of accumulated ZnO NPs on the surface of sludge after 5 h exposure. SEM images
344
revealed differences in detrimental effect between ZnO NPs and zinc ions. Although these extent
345
of damage cannot be accurately quantified based on our SEM analyses, the ZnO NPs appeared to
346
have formed to larger sized aggregates during the experiment. The accumulation of ZnO NPs
347
and Zn2+ on the activated sludge was also confirmed through EDS profile analysis to confirm
15
their Zn-based composition (Figure 7D-7E). The EDS profile clearly shows a Zn peak that is
349
absent in the sample from the control reactor.
350 351
Bacterial viability assay
352 353
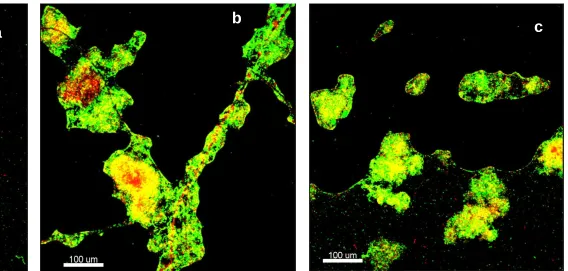
Figure 8 displays the bacterial viability in the control and in the samples treated with ZnO NPs
354
and Zn2+ ions at the highest concentration after 5 h exposure. A large number of fluorescent 355
green cells are evident in the control system (Figure 8A). Compared to the control, the density of
356
dead cells significantly increased after the exposure of the activated sludge to 50 mg/L of ZnO
357
NPs, indicating a great loss in the cell viability (Figure 8B). This can be due to the adsorption of
358
NPs onto the sludge as well as the increase of dissolved Zn2+ content and inhibition of cell
359
activity after exposure to 50 mg/L ZnO NPs. This phenomenon was even greater for the sludge
360
exposed to Zn2+ ions (Figure 8C). The structure of the activated sludge became loose with
361
numerous small aggregates of ZnO NPs which may result in dispersed flocs. This finding is in
362
agreement with previous studies [24, 36] which revealed that higher concentrations of ZnO NPs
363
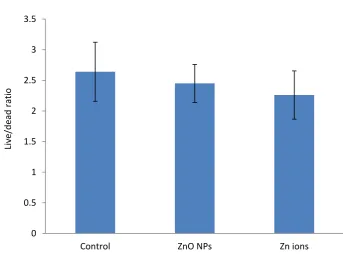
exhibited inhibitory effects on the activity of activated sludge microorganisms. In addition, after
364
5 h exposure to ZnO NPs and Zn ions at a high concentration of 50 mg/L, the live/dead ratio
365
exhibited a decreasing trend (2.45 and 2.26 for ZnO NPs and Zn2+ treatment, respectively),
366
compared to control (2.64) (Supplementary Figure S2). This finding further confirms that the
367
accumulated ZnO NPs on the surface of activated sludge was likely to create a stressful
368
environment for microorganisms, thereby reducing the activity of the activated sludge. This was
369
also supported by the significant reductions in various contaminant removal efficiencies
370
observed during exposure to ZnO NPs and zinc ions at higher concentrations in this study.
16
It has been reported that the toxicity of ZnO NPs to activated sludge would be mainly due to the
373
release of soluble Zn2+ ions. [16, 26] However, in the present study, only 5.6 mg Zn2+ .L-1 was 374
released from 50 mg/L ZnO NPs (Figure 2A) and it is therefore believe that biosorption of NPs
375
onto activated sludge played a major role in inhibition mechanism as shown by the high
376
adsorption capacity and bacterial viability analysis. In comparison, Hou et al. [37] and Li et al. [18]
377
investigated the kinetics of Zn2+ released from ZnO NPs of 50 mg/L, and reported Zn level of 4.9
378
mg/L and 7.1 mg/L, respectively after 24 h exposure. This discrepancy might be attributable to
379
the difference of size and surface area of investigated ZnO NPs, which in turn may lead to the
380
toxicity induced by NPs.
381
Previous studies have reported that the production of extracellular polymeric substances (EPS)
382
could strongly increase the toxicity resistance of activated sludge by preventing direct contact
383
between zinc ions and bacteria. [26, 36] However, once the concentration of metal ions increased, 384
the protective capacity of EPS deteriorated, due to the loose structure under high toxicity. [38]
385
This explains the observation of increased inhibition of activated sludge at higher concentrations
386
of ZnO NPs in the present study. The toxicity of ZnO NPs to bacteria can also be attributed to
387
the changes in sludge properties. [24] At low concentrations of NPs, the dissolved Zn2+ ions from
388
ZnO NPs could function as bridges between the functional groups on the surface of bacteria,
389
helping to aggregate microbes and promoting bioflocculation. However, under exposure to
390
higher concentrations of ZnO NPs, cell surface charge increases, weakening the attraction
391
between EPS and cations, resulting in the reduction of the flocculating ability of activated sludge.
392 393
Conclusions 394
395
In this study, the fate and behaviour of ZnO NPs and zinc ions in the waste activated sludge
396
process were investigated in SBR. The results indicate that biological wastewater treatment
17
plants have great potential to remove ZnO NPs from wastewater. ZnO NPs were efficiently
398
retained by activated sludge, and exhibited greater biosorption capacity and strong affinity to the
399
sewage sludge, compared to Zn2+ ions. The short-term exposure to ZnO NPs at 1 mg/L showed
400
some effects on COD removal, ammonia removal and phosphorus uptake. Exposure to 10 mg/L
401
and 50 mg/L significantly inhibited the biological wastewater treatment process. Compared to
402
ZnO NPs, Zn2+ ions exhibited more severe toxicity towards activated sludge at high
403
concentrations due to a better dissolution of Zn2+ from ZnSO
4. The results of bacterial integrity 404
analysis showed that accumulated ZnO NPs on the surface of activated sludge created a stressful
405
environment for microorganisms, as shown by a decreasing live/dead ratio, thereby reducing the
406
activity of activated sludge.
407 408
Acknowledgements 409
The authors would like to express sincere thanks to the Singapore Economic Development Board
410
and the Environment & Water Industry Programme.
411 412 413
References 414
415
[1] Gottschalk, F.; T. Sonderer; R.W. Scholz; B. Nowack. Modeled environmental
416
concentrations of engineered nanomaterials (TiO2, ZnO, Ag, CNT, fullerenes) for different
417
regions. Environmental Science and Technology, 2009, 43(24), 9216-9222.
418
[2] Brar, S.K.; M. Verma; R.D. Tyagi; R.Y. Surampalli. Engineered nanoparticles in
419
wastewater and wastewater sludge - Evidence and impacts. Waste Manage., 2010, 30(3),
504-420
520.
18
[3] Lin, D.; B. Xing. Root uptake and phytotoxicity of ZnO nanoparticles. Environmental
422
Science and Technology, 2008, 42(15), 5580-5585.
423
[4] Westerhoff, P.K.; A. Kiser; K. Hristovski. Nanomaterial removal and transformation
424
during biological wastewater treatment. Environmental Engineering Science, 2013, 30(3),
109-425
117.
426
[5] Li, Q.; S. Mahendra; D.Y. Lyon; L. Brunet; M.V. Liga; D. Li; P.J.J. Alvarez.
427
Antimicrobial nanomaterials for water disinfection and microbial control: Potential applications
428
and implications. Water Research, 2008, 42(18), 4591-4602.
429
[6] Boxall, A.B.A.; K. Tiede; Q. Chaudhry. Engineered nanomaterials in soils and water:
430
How do they behave and could they pose a risk to human health? Nanomedicine, 2007, 2(6),
431
919-927.
432
[7] Ganesh, R.; J. Smeraldi; T. Hosseini; L. Khatib; B.H. Olson; D. Rosso. Evaluation of
433
nanocopper removal and toxicity in municipal wastewaters. Environmental Science and
434
Technology, 2010, 44(20), 7808-7813.
435
[8] Sun, T.Y.; F. Gottschalk; K. Hungerbühler; B. Nowack. Comprehensive probabilistic
436
modelling of environmental emissions of engineered nanomaterials. Environmental Pollution,
437
2014, 185, 69-76.
438
[9] Tan, M.; G. Qiu; Y.P. Ting. Effects of ZnO nanoparticles on wastewater treatment and
439
their removal behavior in a membrane bioreactor. Biores. Technol., 2015, 185, 125-133.
440
[10] Aruoja, V.; H.C. Dubourguier; K. Kasemets; A. Kahru. Toxicity of nanoparticles of CuO,
441
ZnO and TiO2 to microalgae Pseudokirchneriella subcapitata. Sci. Total Environ., 2009, 407(4),
442
1461-1468.
443
[11] Ma, H.; P.L. Williams; S.A. Diamond. Ecotoxicity of manufactured ZnO nanoparticles -
444
A review. Environmental Pollution, 2013, 172, 76-85.
19
[12] Farré, M.; J. Sanchís; D. Barceló. Analysis and assessment of the occurrence, the fate and
446
the behavior of nanomaterials in the environment. TrAC Trends in Analytical Chemistry, 2011,
447
30(3), 517-527.
448
[13] Heinlaan, M.; A. Ivask; I. Blinova; H.C. Dubourguier; A. Kahru. Toxicity of nanosized
449
and bulk ZnO, CuO and TiO2 to bacteria Vibrio fischeri and crustaceans Daphnia magna and 450
Thamnocephalus platyurus. Chemos., 2008, 71(7), 1308-1316.
451
[14] Song, W.; J. Zhang; J. Guo; J. Zhang; F. Ding; L. Li; Z. Sun. Role of the dissolved zinc
452
ion and reactive oxygen species in cytotoxicity of ZnO nanoparticles. Toxicology Letters, 2010,
453
199, 389-397.
454
[15] Lombi, E.; E. Donner; E. Tavakkoli; T.W. Turney; R. Naidu; B.W. Miller; K.G.
455
Scheckel. Fate of zinc oxide nanoparticles during anaerobic digestion of wastewater and
post-456
treatment processing of sewage sludge. Environmental Science and Technology, 2012, 46(16),
457
9089-9096.
458
[16] Puay, N.Q.; G. Qiu; Y.P. Ting. Effect of Zinc oxide nanoparticles on biological
459
wastewater treatment in a sequencing batch reactor. Journal of Cleaner Production, 2015, 88,
460
139-145.
461
[17] Musee, N.; J.N. Zvimba; L.M. Schaefer; N. Nota; L.M. Sikhwivhilu; M. Thwala. Fate
462
and behavior of ZnO- and Ag-engineered nanoparticles and a bacterial viability assessment in a
463
simulated wastewater treatment plant. Journal of Environmental Science and Health - Part A
464
Toxic/Hazardous Substances and Environmental Engineering, 2014, 49(1), 59-66.
465
[18] Li, M.; L. Zhu; D. Lin. Toxicity of ZnO nanoparticles to escherichia Coli: Mechanism
466
and the influence of medium components. Environmental Science and Technology, 2011, 45(5),
467
1977-1983.
20
[19] Hou, L.; K. Li; Y. Ding; Y. Li; J. Chen; X. Wu; X. Li. Removal of silver nanoparticles in
469
simulated wastewater treatment processes and its impact on COD and NH 4 reduction. 470
Chemosphere, 2012, 87(3), 248-252.
471
[20] APHA, In Standard Methods for the Examination of Water and Wastewater 22th edition.
472
Washington, D.C: 2012.
473
[21] Zheng, X.; R. Wu; Y. Chen. Effects of ZnO nanoparticles on wastewater biological
474
nitrogen and phosphorus removal. Environmental Science and Technology, 2011, 45(7),
2826-475
2832.
476
[22] Zhang, D.; A.P. Trzcinski; H.-S. Oh; E. Chew; S.K. Tan; W.J. Ng; Y. Liu. Comparison
477
and distribution of copper oxide nanoparticles and copper ions in activated sludge reactors. 478
Journal of Environmental Science and Health, Part A, 2017, 1-8.
479
[23] Kaegi, R.; A. Voegelin; C. Ort; B. Sinnet; B. Thalmann; J. Krismer; H. Hagendorfer; M.
480
Elumelu; E. Mueller. Fate and transformation of silver nanoparticles in urban wastewater
481
systems. Water Res., 2013, 47(12), 3866-3877.
482
[24] Chen, H.; X. Zheng; Y. Chen; M. Li; K. Liu; X. Li. Influence of copper nanoparticles on
483
the physical-chemical properties of activated sludge. PLoS ONE, 2014, 9(3).
484
[25] Chaúque, E.F.C.; J.N. Zvimba; J.C. Ngila; N. Musee. Stability studies of commercial
485
ZnO engineered nanoparticles in domestic wastewater. Physics and Chemistry of the Earth, Parts
486
A/B/C, 2014, 67–69, 140-144.
487
[26] Tan, M.; G. Qiu; Y.P. Ting. Effects of ZnO nanoparticles on wastewater treatment and
488
their removal behavior in a membrane bioreactor. Bioresour. Technol., 2015, 185, 125-133.
489
[27] Malik, A.; M. Sakamoto; S. Hanazaki; M. Osawa; T. Suzuki; M. Tochigi; K. Kakii.
490
Coaggregation among Nonflocculating Bacteria Isolated from Activated Sludge. Applied and
491
Environmental Microbiology, 2003, 69(10), 6056-6063.
21
[28] Heinlaan, M.; A. Ivask; I. Blinova; H.C. Dubourguier; A. Kahru. Toxicity of nanosized
493
and bulk ZnO, CuO and TiO2 to bacteria Vibrio fischeri and crustaceans Daphnia magna and
494
Thamnocephalus platyurus. Chemosphere, 2008, 71(7), 1308-1316.
495
[29] Hou, L.; J. Xia; K. Li; J. Chen; X. Wu; X. Li. Removal of ZnO nanoparticles in simulated
496
wastewater treatment processes and its effects on COD and NH4 +-N reduction. Water Science
497
and Technology, 2013, 67(2), 254-260.
498
[30] Zeng, R.J.; R. Lemaire; Z. Yuan; J. Keller. Simultaneous nitrification, denitrification, and
499
phosphorus removal in a lab-scale sequencing batch reactor. Biotechnology and Bioengineering,
500
2003, 84(2), 170-178.
501
[31] Fan, T.; Y. Liu; B. Feng; G. Zeng; C. Yang; M. Zhou; H. Zhou; Z. Tan; X. Wang.
502
Biosorption of cadmium(II), zinc(II) and lead(II) by Penicillium simplicissimum: Isotherms,
503
kinetics and thermodynamics. J. Hazard. Mater., 2008, 160(2-3), 655-661.
504
[32] Göksungur, Y.; S. Üren; U. Güvenç. Biosorption of cadmium and lead ions by ethanol
505
treated waste baker's yeast biomass. Bioresour. Technol., 2005, 96(1), 103-109.
506
[33] Lombi, E.; B. Nowack; A. Baun; S.P. McGrath. Evidence for effects of manufactured
507
nanomaterials on crops is inconclusive. Proceedings of the National Academy of Sciences of the
508
United States of America, 2012, 109(49).
509
[34] Kaegi, R.; A. Voegelin; B. Sinnet; S. Zuleeg; H. Hagendorfer; M. Burkhardt; H. Siegrist.
510
Behavior of Metallic Silver Nanoparticles in a Pilot Wastewater Treatment Plant. Environ. Sci.
511
Technol., 2011, 45(9), 3902-3908.
512
[35] Limbach, L.K.; R. Bereiter; E. Müller; R. Krebs; R. Gälli; W.J. Stark. Removal of oxide
513
nanoparticles in a model wastewater treatment plant: Influence of agglomeration and surfactants
514
on clearing efficiency. Environmental Science and Technology, 2008, 42(15), 5828-5833.
22
[36] Hou, J.; L. Miao; C. Wang; P. Wang; Y. Ao; B. Lv. Effect of CuO nanoparticles on the
516
production and composition of extracellular polymeric substances and physicochemical stability
517
of activated sludge flocs. Bioresour. Technol., 2015, 176, 65-70.
518
[37] Hou, J.; L. Miao; C. Wang; P. Wang; Y. Ao; J. Qian; S. Dai. Inhibitory effects of zno
519
nanoparticles on aerobic wastewater biofilms from oxygen concentration profiles determined by
520
microelectrodes. Journal of Hazardous Materials, 2014, 276, 164-170.
521
[38] Ma, J.; X. Quan; X. Si; Y. Wu. Responses of anaerobic granule and flocculent sludge to
522
ceria nanoparticles and toxic mechanisms. Bioresour. Technol., 2013, 149, 346-352.
23 FIGURE CAPTIONS
526
Figure 1 TEM image of ZnO NPs in the nutrient solution under different magnification: (A) 0.5
527
µm; (B) 100 nm; (C): 50 nm
528
Figure 2 Kinetics of Zn2+ released from a) ZnO NPs at the concentrations of 1.0, 10 and 50
529
mg/L; and b) ZnSO4·7H2O at the concentrations of 3.54, 35.4 and 177 mg/L. Error bars 530
represent standard deviations of triplicate measurement. The error bars were omitted when
531
smaller than the marker.
532
Figure 3 COD concentrations in the effluent of a) ZnO NP treatment; and b) Zn2+ ions treatment
533
Figure 4 NH4-N concentrations in the effluent of a) ZnO NP treatment; and b) Zn ions treatment. 534
Error bars represent standard deviations of triplicate measurement
535
Figure 5 Phosphate concentrations in the effluent exposed to a) ZnO NPs; and b) Zn2+ ions.
536
Error bars represent standard deviations of triplicate measurement
537
Figure 6 Zinc levels in the biosolids for a) ZnO NP treatment; and b) Zn2+ treatment. Error bars
538
represent standard deviations of triplicate measurement
539
Figure 7 SEM images of activated sludge after ZnO NPs and Zn2+ ions exposure at the
540
concentration of 50 mg/L after 5 h. a) Sludge in the control; b) Sludge in the treatment
541
exposed to ZnO NPs; and c) Sludge in the treatment exposed to Zn2+ ions; d) EDS spectra for 542
a); e) EDS spectra for b); and f) EDS spectra for c)
543
Figure 8 Bacterial viability in a) control treatment; b) in the activated sludge exposed to ZnO
544
NPs; and c) in the activated sludge exposed to zinc salt at the concentration of 50 mg L-1 after
545
5 h exposure
546
Supplementary Fig S1. Size distribution of ZnO NPs. The size range determined using TEM as
547
15-47 nm with a mean size of 33± 8 nm (n=107).
548
Supplementary Fig S2. Live/dead ratio after 5 hours exposure of ZnO NPs and Zn ions.
25 Fig. 2 0
2 4 6 8 10
0 30 60 90 120 150 180 210 240 270 300
Zn
co
n
ce
n
tra
tio
n
s in
t
h
e ef
flu
en
t
(m
g/L)
Time (min)
1 mg/L 10 mg/L 50 mg/L as ZnO NPs
0 2 4 6 8 10 12
0 30 60 90 120 150 180 210 240 270 300
Zn
Co
n
ce
n
tra
tio
n
s in
t
h
e ef
flu
en
t
(m
g/L)
Time (min)
3.54 mg/L 35.4 mg/L 177 mg/L as ZnSO4
a)
26 Fig. 3 0
20 40 60 80 100 120 140 160 180
0 30 60 90 120 150 180 210 240 270 300
COD
con
ce
n
tra
tio
n
s in
t
h
e ef
flu
en
t
(m
g/L)
Time (min)
Control 1 mg/L 10 mg/L 50 mg/L
0 50 100 150 200 250
0 30 60 90 120 150 180 210 240 270 300
COD
con
ce
n
tra
tio
n
s in
t
h
e ef
flu
en
t
(m
g/L)
Time (min)
Control 3.54 mg/L 35.4 mg/L 177 mg/L
a)
[image:26.595.104.474.151.717.2]27 Fig. 4 0
10 20 30 40 50
0 30 60 90 120 150 180 210 240 270 300
NH
4
+-N
co
n
ce
n
tra
tio
n
s in
t
h
e ef
flu
en
t
(m
g/L)
Time (min)
Control 1.0 mg/L 10 mg/L 50 mg/L
0 10 20 30 40 50
0 30 60 90 120 150 180 210 240 270 300
NH
4
+-N
co
n
ce
n
tra
tio
n
s in
t
h
e ef
flu
en
t
(m
g/L)
Time (min)
Control 3.54 mg/L 35.4 mg/L 177 mg/L
a)
[image:27.595.96.485.131.736.2]28 Fig. 5 10 11 12 13 14 15 16
0 60 120 180 240 300
Ph o sp h at e co n ce n tra tio n in t h e ef flu en t (m g/L) Time (min)
Control 1 mg/L 10 mg/L 50 mg/L
10 11 12 13 14 15 16 17
0 60 120 180 240 300
Ph o sp h at e co n ce n tra tio n s in th e ef flu en t (m g/L) Time (min)
Control 3.54 mg/L 35.4 mg/L 177 mg/L
29 Fig. 6 0
2 4 6 8 10 12 14 16
0 30 60 90 120 150 180 210 240 270 300
Zn
co
n
ce
n
tra
tio
n
s in
t
h
e b
iomas
s
(m
g/g)
Time (min)
1 mg/L 10 mg/L 50 mg/L
0 1 2 3 4 5 6 7 8
0 30 60 90 120 150 180 210 240 270 300
Zn
co
n
ce
n
tra
tio
n
s in
t
h
e b
iomas
s
(m
g/g)
Time (min)
[image:29.595.102.493.78.671.2]30 Fig. 7
Zn2+, 3.55%
Zn2+, 0.54%
0.97 d
e f
31 Fig. 8
a
0
)
b
0
)
c
0
32
[image:32.595.78.456.80.312.2]Fig S1. Size distribution of ZnO NPs. The size range determined using TEM as 15-47 nm with a mean size of 33± 8 nm (n=107).
Fig S2. Live/dead ratio after 5 hours exposure of ZnO NPs and Zn ions.
0 0.5 1 1.5 2 2.5 3 3.5
Control ZnO NPs Zn ions
Liv
e/d
ead
ra
[image:32.595.76.420.427.681.2]