ASSOCIATION OF FIRST TRIMESTER URIC ACID A PREDICTOR OF GDM
Dissertation submitted in partial fulfilment of the Requirement for the award of the Degree of
M.S. DEGREE–BRANCH VI OBSTETRICS AND GYNAECOLOGY
APRIL 2017
TIRUNELVELI MEDICAL COLLEGE HOSPITAL
THE TAMIL NADU DR.M.G.R. MEDICAL UNIVERSITY,
CHENNAI,
CERTIFICATE
This is to certify that the Dissertation entitled “ASSOCIATION OF FIRST TRIMESTER URIC ACID A PREDICTOR OF GDM” submitted by DR. JEMIMAH J S M.S [Obstetrics and gynaecology]., to The Tamilnadu
Dr.M.G.R. Medical University, Chennai, in partial fulfilment for the award of
M.S (Obstetrics and Gynaecology) is a bonafide work carried out by her under
my guidance and supervision during the academic year 2014-2017. This
dissertation partially or fully has not been submitted for any other degree or
diploma of this university or other.
GUIDE
Prof.Dr.Ramalakshmi, MD., DGO, Department Obstetrics and
Gynaecology,
Tirunelveli Medical College, Tirunelveli- 627011.
HOD
Prof.Dr.MEENA,MD.,DGO.,DNB., Department Obstetrics and
Gynaecology,
Tirunelveli Medical College, Tirunelveli- 627011.
DECLARATION
I, DR.J S JEMIMAH., solemnly declare that the Dissertation titled
“ASSOCIATION OF FIRST TRIMESTER URIC ACID A PREDICTOR
OF GDM” had been prepared by me under the expert guidance and supervision of Prof. Dr. Ramalakshmi MD., DGO., Professor, Department
of Obstetrics and Gynaecology, Tirunelveli Medical College Hospital,
Tirunelveli.
The dissertation is submitted to The Tamilnadu Dr. M.G.R. Medical
University, Chennai in partial fulfilment of the regulation for the award of
M.S. Degree (Branch VI) in Obstetrics and Gynaecology.
It was not submitted to the award of any degree/diploma to any
University either in part or in full previously.
Place: Tirunelveli.
Date:
Dr. JEMIMAH J S M.S [obstetrics and Gynaecology]
POST GRADUATE,
M.S. (Obstetrics and Gynaecology),
ACKNOWLEDGEMENT
I am very much thankful to the Dean Dr. K.Sithy Athiya Munavarah,
Triunelveli Medical College Hospital, Tirunelveli, who has granted
permission to do this study in this institution,
I take this opportunity to express my deepest sense of gratitude to
professor Dr.MEENA, M.D., DGO., DNB., Head of the Department of
Obstetrics and Gynaecology, Tirunelveli Medical College Hospital,
Tirunelveli for encouraging me and rendering timely suggestions and guiding
me throughout the course of this study. simple words cannot express its for
this contribution.
I am extremely thankful to my guide Dr.RAMA LAKSHMI MD
DGO .,
I sincerely thank my professor Dr.SHEBA ROSATTE VICTOR,M.D.,(OG)., Dr.M.SUJATHA ALAGESAN,M.D.,(OG), for their support and guidance.
I am extremely thankful to all my Assistant Professors of the
Department of Obstetrics and Gynaecology for their guidance and support throughout my study period in this institution.
Last but not the least, I am grateful to the antenatal mothers who
willingly cooperated with me during the study
CONTENTS
S.No TITLES Page No
1. Introduction 1
2. Aim of the Study 3
3. Review of Literature 4
4. Materials and Methods 54
5. Results 57
6. Discussion 72
7. Conclusion 77
8. Bibliography
9. Proforma
10. Master Chart
Introduction
Gestational diabetes mellitus is defined as “carbohydrate intolerance
of variable severity with onset or first recognition during present
pregnancy”. This definition applies whether or not insulin is used for
treatment.
It is carbohydrate metabolic disorder. It is due to combination of
hereditary and environmental factors, either by defective secretion and
insulin resistance.
Diabetes complicating pregnancy has become more common
world-wide abnormal maternal glucose regulation occurs in around 3-10%
pregnancies.
The reason for this rise in the prevalence of diabetes are mainly
change in the life style, dietary habits older age at first conception poly
cystic ovarian disease &obesity.
Uric acid is associated with insulin résistance in non pregnant
women. In pregnancy uric acid is correlated with insulin resistance in
women with gestational hypertension, and GDM . Uric acid is also higher
in non-pregnant women with H/O GDM independent of body mass index.
We hypothesis that elevated uric acid in the early weeks of
gestation correlated with development of GDM.
Epidemiology of GDM
The incidence in world wide it is about 1-16% and is western 7% .
The incidence varies based on the Criteria used to diagnose GDM, and the
prevalence of type 2 Diabetes Mellitus and obesity in the population.
In Indian scenario the incidence is increasing from 2 % in 1981 to
16.5% in 2004.
The incidence of diabetes complicating pregnancy increased approximately
40% between 1989 and 2004 (Gestation 2008) African, American, Native
AIM OF THE STUDY
AIM:
To analyse the relationship between first trimester uric acid levels
REVIEW OF LITERATURE PREVALENCE OF GDM
Globally, the quoted prevalence of GDM ranges
from1-16% (Agarwal, Dhatt, Punnose &Koster,2005). This may be in part due to
the different screening and diagnostic strategies employed to identify the
condition and the particular population studied. The Australian
Carbohydrate Intolerance Study(ACHOIS) undertaken in14centersin
Australiaand4 centres in the United Kingdom reported that GDM affected
2-9% of all pregnancies (Crowtheretal, Hilleretal, Mossetal, McPheeetal,
Jeffries & Robinsonetal,2005).Whilst, Tuffnelletal, Westetal and
Walkinshaw et al (2003)in their systematic review of treatment for GDM
and impaired glucose tolerance (IGT), for the 7 Cochrane Database state
Terminology in the literature, relating to disturbances of
carbohydrate metabolism in pregnancy can be confusing .In 1985,the
World Health Organization (WHO) classification subdivided abnormal
glucose tolerance in pregnancy into three categories defined by fasting
venous glucose levels and venous plasma glucose values two hours after a
75 gram oral glucose load (Nordinetal, Weietal, Naingetal and Symonds
et al, 2006).The three classifications were impaired fasting
glucose(IFG),impaired glucose tolerance(IGT) and GDM. The revised
WHO classification (1999) now defines GDM as any abnormal
carbohydrate metabolism first recognized, or diagnosed in pregnancy,
regardless of severity. Remnants of the earlier classification are still
PATHOGENESIS
Pregnancy is a unique physiological condition. It is a diabetogenic
condition due to progressive increase in the insulin resistance.
The diabetogenic effects of pregnancy are:
1. Insulin resistance:
2. Increased lipolysis
3. Changes in gluconeogenesis
4. Uric acid causing insulin resistance
1.Insulin resistance:
a. Presence of human placental lactogen, cortisol, estriol,
progesterone which all have anti insulin action.
b. Increased destruction of insulin by kidney and placenta
(Insulinase)
c. Android obesity (Increase in Omental mesenteric fat.
d. α TNP impaired insulin signalling inhibits insulin receptor
tyrosine kinase activity at the molecular level, there is
2.Increased lipolysis
Glucose is used by the fetus lipolysis is increased in maternal side to
meet caloric needs.
3.Changes in gluconeogenesis
Fetus utilizes energy that derived from alanine and other amino acids
(Gluconeogenesis)
4.Uric acid causing insulin resistance
Two mechanism have been hypothesized by which uric acid can
cause insulin resistance.
Uric acid causes endothelial dysfunction and decrease
Nitric oxide production by epithelial cells.
Uric acid causes inflammation and oxidative stress in
Uric Acid
Endothelial dysfunction
Decrease nitric oxide production by epithelial cells
Decreased glucose uptake
Insulin resistance
I. Nackagawa et al proposed that uric acid causes endothelial
dysfunction and decreases nitricoxide production by the
endothelial cells.
In animals insulins action on cellular glucose uptake of the
skeletal muscle and adipose tissue is dependent on nitric oxide.
Thus decrease in nitric oxide lead to decreased glucose uptake
II. Another mechanism by which uric acid may induce insulin
resistance may be that uric acid cause inflammation and oxidative
stress in adipocytes which is a contributor leads to metabolic
syndrome.
Uric acid increase with increased protein intake alcohol
consumption decreased excretion or increased endogenous
production.
Maternal glucose homeostasis in pregnancy
Maternal glucose homoeostasis pregnancy is a condition of
I. Accelerated starvation
II. Facilitated anabolism
III. Hyper insulinism
IV. Insulin resistance
1. ACCELERATED STARVATION:
There is fasting hypoglycaemia because glucose is diverted to fetes
by facilitated diffusion& increase insulin secretion during pregnancy,
2. FACILITATED ANABOLISM:
There is prolonged hyperglycaemia after eating because of
increase absorption from gut.
delayed glucose exchange from blood
decrease uptake by muscle and splanchnic tissues and
decrease conversion to glycogen in liver.
3. HYPER INSULINISM
Increase in oestrogen and progestogen leads to
B-cell hyperplasia there by leading to increase insulin secretion
increase sensitivities of B-cells to glucose load
increase suppression of glucose after meals.
4.INSULIN RESISTANCE:
Diurnal Changes in Plasma Glucose and insulin in normal late pregnancy
Type of Diabetes:
I.ETIOLOGICAL CLASSIFICATION OF DIABETES MELLITUS
Type 1:
In type-1 diabetes there is absolute insulin deficiency due to
completeβ-Cell destruction.
Immunological cause.
idiopathic
Type 2:
Varies from only insulin resistance to insulin resistance or associated
defective secretion.
Other types:
Genetic mutations that alter β-Cell function leads to maturity onset
diabetes of the young- 1-6, others
Defective insulin action due to genetic cause.
Genetic syndromes–Down, Klinefelter, Turner
Diseases of the exocrine pancreas–pancreatitis, cystic fibrosis
Cushing syndrome,
Pheochromocytoma, others
Drug or chemical induced
Glucocorticosteroids
Inhibit insulin action and stimulate gluconeogenesis resulting
in hyperglycaemia.
Thiazides
Cause hypokalemia that will affect insulin secretion.
β-adrenergic agonists, others
Infections–congenital rubella, cytomegalovirus
coxackievirus
II.CLASSIFICATION DURING PREGNANCY:
1. Pregestational diabetes / overt
2. Gestational diabetes.
White classification in pregnancy
Until mid 1990. Priscilla white classification were followed today we use
Screening of GDM
The best screening test should be sensitive, specific, simple, cheap
and should be used conveniently, by screening of GDM we can prevent
maternal & foetal adverse outcome, we can diagnosis small portions that
are unrecognized pre-existing diabetes so that we can prevent micro
vascular complication by early diagnosis &follow up. Because they are at
increased risk of 50% Type 2 diabetes in 10 to 15 years.
In 2001 the ACOG:
Recommended universal screening for GDM by taking history,
clinical risk factors or with a 50 gm one-hour loading test @24-28 weeks.
They rely on the 100g 3 Hr OGTT for diagnosis. This is called as to as two
step method.
The fifth international workshop conference on GDM (November
2005) endorsed continuation of the use of classification criteria and
strategies for detections and diagnosis of GDM that were recommended @
fourth workshop conference.
Pregnant women can be classified as low, moderate or high risk based on
Low risk:
Screening of GDM not recommended routinely in these group,
Those women had normal birthweight
Who had normal weight before pregnancy
Without history of glucose intolerance
No family history of diabetes in first degree relative
Who belongs to ethnic group where prevalence of GDM is low
Age < 25 years
Moderate Risk:
One or more of the following in these women blood glucose testing
be done 24-28 weeks (one or two step present)
Weight high @ Birth
Over weight prior to pregnancy
Family history diabetes in first degree relative
High risk:
In these women glucose testing should be done immediately possible
Marked obesity
Strong family history of type 2DM
Presence of previous obstetric history of GDM or impaired
glucose tolerance of glycosuria or macrosomia baby
The NICE guidelines of 2008
That screening for GDM be done using risk factors in a
healthy population
BMI> 30Kg/ sqm
Previous baby > 4.5 Kg
First degree relative with DM
Ethnicity
The ADA (American Diabetic association and the IADPSG
Recommended the one step diagnostic 75g -2Hr OGTT
The cut–offs for this OGTT
Post 1 Hr≥180 mg /dl
Post 2 Hr≥ 153 mg/dl
The following algorithm was suggested combining the
recommendation of the ADA and IAD PSG in 2011 for diabetes in
pregnancy
1. Testing of all women the first antenatal visit < 13 weeks – early
detection reduces complication.
2. Test women who have ANY risk factor.
a) Non Caucasian
b) BMI> 25 (a t risk BMI may be lower in some ethnic groups)
c) Previous baby 4000 Gm > more
d) History of GDM or prediabetes, unexplained still birth,
malformed infant.
e) Family history of diabetes in first degree relative.
f) Glycosuria
g) Drugs that increased blood glucose level
h) Polycystic ovarian syndrome cardiovascular disease,
Screening Test Glucose challenge Test:
(O Sullivan Test)
The glucose challenge test is performed by administering 50 gm of
anhydrous glucose orally irrespective of time of the day previous meal.
Venous blood glucose is then measured 1 Hr later plasma glucose level is
>140 mg/dl
3-Hr 100 gm of GTT is recommended.
Seshiah’sspot test:
Plasma glucose estimation is done in relation to the last Meal critical
valves
OHr - 85mg%
½ Hr - 95 mg%
1 Hr - 105 mg%
2 Hr - 105 mg%
2Hr - 30mg%-95 mg%
GTT
Gold standard test is the 3 Hrs 100 gm oral glucose tolerance test
The WHO has recommended the 75 gm of 2 Hr oral GTT which is
often used in Europe.
In the US the 100gm 3 Hr GTT performed.
The patient should be
After on over right fasting 8-10 Hrs (ACOG 2001)
Unrestricted diet in the previous 3 days
Should be ambulant
Smoking should be avoided
Stop drugs - phenytoin thiazides OC pills, steroids
Procedure
After overnight fasting, fasting blood sugar is collected along with
urine sugar.
100 gms of glucose is given. It can be dissolved with 200 ml of plain water
or lime water to improve palatability. venous blood is drawn for 3 hours
along with urine.
O Sullivan
& Mahan
whole blood NDDG Plasma Cerpenters couston plasma WHO DIPSI 2006 IADPSG 2010
Glucose 100gm 100gm 100gm 75gm 75gm 75gm
Fasting 95 105 95 126 92
1Hr 165 190 180 - 180
2Hr 145 165 155 140 140 153
SPECIAL TESTS
Intravenous Glucose tolerance test (GTT)
25 grams glucose in 50% solution is given IV over 3 minutes. Blood
sample is collected every 10 minutes for 1 hour.
Graph of blood glucose against time plotted.
K (Constant) = 0.696 x 100/t ½.
t ½- Time taken for blood glucose to fall to 50% of the value at 10 minutes.
Normal- K= 1.2 TO 2.3 <1.2–Diagnosed as GDM.
Advantages
Short duration
Useful in patients with Malabsorption syndromes.
Disadvantages
Frequent collection
Other screening test
1. Glycosuria
2. Instant blood glucose using strips & meters
3. HbA1C
4. Serum fructosamine assay
I.Glycosuria:
Glycosuria on the second fasting urine is significant. Also glycosuria if
associated with Ketonuria is significant Normally100 gm of glucose
excreted per day.
It can be measured by benedict’s Test +ve with are reducing sugars &
with some drugs. So It is Non- Specific.
I. Clinstix test:
Specific for glucose
Disadvantage:
Glycosuria is present is diabetes mellitus alimentary
glycosuria, Renal glycosuria, Lactosuria.
Blood sugar does not correlate with urine sugar always.
II. Instant blood glucose (CBG) Easy to perform
Vere puncture not needed
Quick results
But lack precision
Capillary blood glucose levels is 20 mg% higher than
whole blood level,
III. Glycosylated HB (HBAIC)
Reflects glycaemic control over last 2-3 months.
Normal ranges 5-8%
<8.5% - good control
8.5-9.5 % fair control
>9.5% - poor control
Variable values in renal failure reduced in anaemia
HbA1C
<7% No Greater risk for anomalies then non diabetic mother.
7-8.5% risk of 5% for anomalies >10% risk of anomalies rises to
22%
Therapy must be for targeted to achieve a pre pregnancy
HbAIC Risk of anomalies
7-8.5% 5%
10% 22%
HbAIC < 6.1 % (NICE Guidelines 2005)
IV. serum fructosamine assay:
Reflects glycemic control over last 2 weeks.
(N) valve up to 285 µmu/L
Reliable in anaemia
Costly test
To assess complications
INVESTIGATIONS FOR ASSESSING GLYCAEMIC STATUS
To assess glycaemic status
1. In controlled GDM, DM, once in 2-4 weeks
2. Self-blood glucose monitoring is mandatory in all the pregnant
women on insulin
3. Patients with fluctuating glucose levels
4. Patients showing recurrent ketosis or hypoglycaemic
5. In the perioperative period
INVESTIGATIONS FOR ASSESSING GLYCAEMIC STATUS:
Urine sugar monitoring–unreliable.
Blood sugar estimation is best.
In controlled GDM, DM, once in 2-4 weeks.
Self-blood glucose monitoring (SMBG) is mandatory in
All the pregnant women on insulin
Patients with fluctuating glucose levels.
Patients showing recurrent ketosis or hypoglycaemia
INVESTIGATIONS FOR ASSESSING COMPLICATIONS
Infections
Asymptomatic bacteriuria to be looked for at booking, 28, 32, 36, weeks.
Vulvar moniliasis screening
Urine should be examined for proteins and microscopic deposits during
each visit.
Diabetic nephropathy
Urine for proteins using dipstick during each visits.
If dipstick +ve 24 hours urinary protein for microalbuminuria.
Renal function tests- blood urea, serum creatinine, serum
electrolytes.
Diabetic retinopathy
Measuring visual acuity
Opthalmoscopic examination through dilated pupils stages
1. Non proliferative retinopathy
3. Proliferative retinopathy.
Coronary heart disease and cardiomyopathy. ECG in all the leads
and echocardiogram.
Fasting lipid profile.
Urine for ketone bodies and serum electrolytes in the presence of
high blood sugar, persistent vomiting and infection.
Screening for fetal anomalies:
Glycosylated Hb estimation.
Chorionic villous sampling
Maternal serum αfetoprotein estimation
Amniocentesis
Targeted ultrasound
Ultra sound
Assessment of altered growth
Ultrasound every 4 weeks form 20 weeks.
MACROSOMIA can be identified by
AC and high diameter > 90thpercentile
Head and femur measurements <90thpercentile.
Abdominal girth > head circumference.
AC change > 1-2 cm/ week.
Increase subcutaneous fat.
For assessing amniotic fluid volume.
For assessing placental positon
ADVERSE OUTCOMES ASSOCIATED WITH GESTATIONAL DIABETES:
Maternal problems
Pregnancy:
Anxiety
Preeclampsia
Birth Trauma (Secondary to macrosomia)
Increased rate of caesarean section
Polyhydramnios
Spontaneous abortion
Preterm labour
Later life:
Increased rate of type 2 DM in later life.
50% recurrence of GDM in 30-50%
Increased rate of hypertension and cardio vascular disease
Problems in offspring (Fatal) neonatal / Adult life.
Fetal life:
o Abortion
o Malformation
o Intra Uterine death
o Macrosomia
o Iatrogenic prematurity
Neonatal life:
Hypoglycemia
Polycythemia
Hyperbilirubinemia
Hypocalcemia
Cardiomyopathy
Respiratory Distress syndrome
Adult life:
Obesity
Increase rate of T2 DM in later life
Fetal macrosomia
Maternal hyperglycaemia Stimulate fetal insulin secretion
particularly during second half of pregnancy. This is turn leads to excessive
somatic growth
The excessive shoulder & trunk fat that characterizes the
macrosomia infant of diabetic mother predispose such infants to shoulder
dystocia & caesarean section.
Insulin like growth factor also important in regulating fetal growth.
Leo and coworkers (2012) reported that there is positive evidence
between insulin like growth factor and birth weight.
The HAPO study also reported dramatic increases of C- peptide
Other factors include epidermal growth factors, fibroblast growth
factors, platelet derived growth factor, leptin, adiponectin.
Neonatal hypoglycaemia
Neonatal hyperinsulinemia may provoke hypoglycaemia within
minutes of birth.
Newborns described by the HAPO study had an incidence of clinical
neonatal hypoglycaemia that increased with increasing maternal OGTT
Maternal obesity:
Torloni and coworkers (2009) estimated that gestational diabetes
prevalence increase by approximately 1% for every 1Kg / m2increase in
BMI
Weight distribution pattern also related to risk of getting gestational
diabetes. In truncal obesity there is increased.
There is also evidence that increased maternal abdominal
subcutaneous fat thickness at 18-22 weeks of GA correlated with BMI and
It was a better predictor of gestational diabetes.
Excessive weight gain also identified in GDM
Congenital malformation
The cause for congenital malformation
Inter related muscular chain reactions due to hyperglycemia
Alteration in cellular lipid metabolism
Excess production of toxic super oxide radicals
Oxidative stress induced by hyperglycemia inhibits migration of
cardiac neural crest cells.
Effects of Diabetes on Pregnancy
Maternal Effects:
1. preeclampsia
Pre-Eclampsia occurs is 10% of patient with GDM. It is more
common in younger, nulliparous, obese, those who gain excessive weight
gain during pregnancies.
The risk of superadded pre-eclampsia is around 35-60% in women
who had micro albuminuria
Severity of these complications varies with the duration and severity
of abnormal glucose levels.
2. Acceleration of the end organ disease nephropathy.
Stage 1:
Microalbuminuria (albumin to creatinine ratio >/=3.5 mg/ mmol or
Stage 2:
Microalbuminuria (albumin to creatinine ratio >/=30 mg/ mmol or
urinary albumin excretes of 200 mg/L or more.
Stage 3:
End stage Renal Disease
3. Risk of death due to cardiomyopathy
4. Other complications preterm labour, chroioammiontis polyhydramnios, UTI.
The steroids and tocolytics like β-Z agonists given in cases of
preterm labour worsen hyperglycaemia and predispose to ketoacidosis
5. In case of uncontrolled diabetes prior to pregnancy risk of recurrent pregnancy loss increase.
6. Febrile illness’ dehydration form hyperemesis or diarrhoeal disease can precipitate ketoacidosis which can be life ending also cause
sudden fetal death
7. Increased need for hospital admission to either initiate insulin therapy or during inter current illness Emergency situation like
8. There is a risk of worsening of end organ damage in nephropathy retinopathy , cardiovascular disease.
9. Neuropathy may manifest in the form of gastroparesis resulting in increasing gastric emptying time.
10.Renal disease develops 25-30/- women with insulin dependent diabetes of a l Background or mild non proliferative retinopathy
should be screened follow up during pregnancy with a dilated fundus
examination should be done.
Intrapartum there may be chances of infections, need for operative
delivery either instrumental or caesarean section
In postpartum period there is risk of postpartum haemorrhage,
Management
Diabetic Diet:
ADA recommends individualized nutritional counselling based on
height and weight on average this includes daily calorie intake of 30 to 35
Kcal/kg. Total calorie constitutes 55%, Carbohydrate 20%, protein 25%,
Fat (<10 saturated fat)
The ACOG 2013 suggests Carbohydrate intake limited to 40% of Total
calorie
Exercise:
The ACOG (2013) include a moderate exercise program in the
treatment plan of women with gestational diabetes
It can decrease the insulin requirement by 50 %
Glucose Monitoring:
There is evidence to support the common practice of blood glucose
self-monitoring for women with diet treated gestational diabetes
The ACOG recommends four times daily glucose monitoring
Insulin Treatment:
The ACOG recommends that insulin be considered in women with
1Hr post prandial levels that persistently Levels that persistently exceed
140 mg/dl or those with 2-Hr levels above 120 mg/dl
The strong dose of insulin 0.7 -1.0 units /kg (ACOG) combination fo
intermediate acting and short acting insulin may be used
Oral hypoglycaemic agent:
The ACOG acknowledge that both glyburide and metformin are
Uric acid
Uric acid is the end product of purine metabolism. Purines are
obtained from both dietary sources, & from the breakdown of body protein
liver kidneys sweet breads, sardines, anchovies spinach sources of
purine.-they are all rich sources of purines
The Kidneys excrete two thirds of the uric acid produced daily.
Remaining one third is excreted in the stool.
Uric acid level shows day to day, Seasonal variations in the same person.
Reference values
Adult males:2.0-7.5 mg/dl
Adult females: 2.0-6.5 mg/dl
In early pregnancy uric acid levels falls by about one third but rise to
non–pregnant levels by term
Children (ages 10-18)
Males: 3.6-5.5 mg/dl significant rise in males ages 12-14 coincides with
Elderly Males older than 40 2-8.5 mg/dt
The normal range for urinary uric acid is between 250-750 mg over a
24 Hr Period
An elevated blood uric and level also known as hyperuricemia.It is
seen in Gout, Renal disease, and renal failure
Alcoholism
Dehydration
Leukemia and lymphoma
Starvation
Metabolic acidosis
Toxemia of pregnancy
Infectious mononucleosis
Hyperlipidema
Haemolytic anaemia
Excessive cell destruction associated with chemotherapy with chemo
changes of uric acid concentration during normal pregnancy:
Uric acid concentrations decreased significantly by 8 weeks when
compared with pre pregnancy values.
This level maintained until about 24 weeks.
Then the concentrations increased such that by term they were
greater than the pre pregnancy values in the majority of patients end
remand elevated until 12 weeks after delivery.
Uric acid
Non pregnant adult 2.5-5.6
First trimester 2.0-4.2
Second trimester 2.4-4.9
Third trimester 3.1-6.3
Uric acid in the first trimester likely approximates preconception
uric acid and elevated uric acid may identify women who are predisposed
to metabolic syndrome with risk of developing GDM, independent of
women with elevated uric acid have a poor adaptation to pregnancy leads
to adverse pregnancy outcomes such as GDM.
Studies on the association of uric acid and GDM.
Zekai tahir Burak et al:
Studied the relationship between serum uric acid creative albumin
gestational diabetes mellitusat the women’s Health and Research Hospital,
Ankera, Turkey, and found.
Creatinine levels were significantly higher in the diabetic group than in the
control group.
Many studies on the association between uric and GDM have been
performed.
Zekai Tahir Burak et al:
Studied Relationship between serum uric acid, creatinine, albumin
and gestational diabetes mellitus at The Women’s Health and Research
Hospital, Ankara, Turkey, and found.
Creatinine levels were significantly higher in the diabetic group than in the
micromol /L vs. 38.01+/- 8.84 micromol /L), P< 0.001]. Uric acid levels
were also higher in the diabetic patients, this elevation was statistically
significant [4.42+/-1.09 vs 3.1+/-0.84 mg /dL (260.78+/-64.31 micromol /L
vs. 231.49+/-49.56 micromol/L), P< 0.001]. There were no differences in
mean albumin concentrations or liver function tests.
Title: Hypertension in pregnancy:
Official journal of the international society for the study of
Hypertension in pregnancy Volume: ISSN: 1525- 6065 ISO Abbreviation:
Publication Date: 2010 Sep studied that High Uric Acid Level during the
First 20 Weeks of pregnancy is Associated with Higher Risk for
Gestational Diabetes Mellitus and Mild preeclampsia.
Results:
Significant linear association was documented between UA level in
the first 20 weeks and the prevalence of GDM and mild preeclampsia. The
lowest and the highest prevalence of GDM were found in the UA </=2.4
mEq/L group (6.3%) ab dub the UA> 5.5 mEq/L group (10.5%) (p<0.001),
Samer Samir Lamey et al
In helipolis Hospital under supervision by prof. Dr. Ali Farid
Mohamed ali Professor of Obstetrics &Gynaecology Faculty of Medicine
Ain Shams University, 2010 studied the Risk of elevated body mass index
in expectation the presence of gestational diabetes mellitus and associated
elevated uric acid concentrations.
Lind T, Godfrey KA, et al
Studied the changes in serum uric acid concentrations during normal
pregnancy. He found that compared with pre- pregnancy values uric acid
concentrations decreased significantly by 8 weeks gestation and this
reduced level was maintained until about 24 weeks. Thereafter the
concentrations increased such that by term they were greater than the
pre-pregnancy values in the majority of patients and remained elevated until at
Simmi Kharb et al:
Studied the relation between Ascorbic acid and uric acid levels in
gestational diabetes mellitus and found that Significantly low vitamin C
levels were observed in GDM as compared to those in controls (P<0.05).
Significantly high serum uric acid levels were observed in GDM as
compared to those in controls (P<0.05). Vitamin C and uric acid levels
showed a significant negative correlation (r=0.25, P<0.05).
Control group Study group
Vit C 1.077± 0.392 0.801± 0.119
MATERIALS AND METHODS
This a prospective study conducted in Tirunelveli Medical College
Hospital Tirunelveli. During (July 2015 year July 2016 ) About
100 antenatal women attending OPD at first trimester were included in the
study. After satisfying inclusion & exclusion criteria. They were recruited
and informed about the aim of the study. informed consent was got from all
patients. Height, weight, BMI was measured Gestational age was
confirmed by ultrasonography
Inclusion Criteria:
Antenatal women with gestational age < 12 weeks
Exclusion Criteria:
Pregnant women > 12 weeks
Overt DM
Or who received steroids in any form
Gout
Other endocrine disorder
Chronic renal disease
H/O thromboembolism
Liver disease, Cardio vascular disease
MEASUREMENTOF PLASMAURICACID:
Venous b l o o d s a m p l e was withdrawn from antenatal
w o m e n w i t h gestationalage<12weeks.Thesampleswerecentrifugedtose
paratethe serum and stored at -70ºC till examined. Uric acid
measured using colorimetric assay with detection limit
of10mg/dl.Thecoefficientwas0.9%.
SCREENINGFORGDM
All antenatal mothers were followed up around 24-28 weeks for
routine GDM screening with 50grams of oral glucose challenge test
(GCT). Those antenatal mothers with plasma glucose level after 1hour
≥140mg/dl, these women are considered high risk and are subjected to
oral glucose tolerance test (OGTT).
ORAL GLUCOSE TOLERANCE TEST
is taken. After which100grams of glucose is taken oral.1hr, 2hr,3hr
glucose levels are measured. Patients are considered to have GDM if two
or more of the 4 values exceed the following:
Fifth international workshop conference on gestational
diabetes-Fasting - 95mg/dl
1hr - 180mg/dl
2hr - 155mg/dl
3hr - 140mg/dl
Those antenatal women with positive GTT were admitted as in -patient and
further evaluated. These antenatal women were managed with diet and some
RESULTS
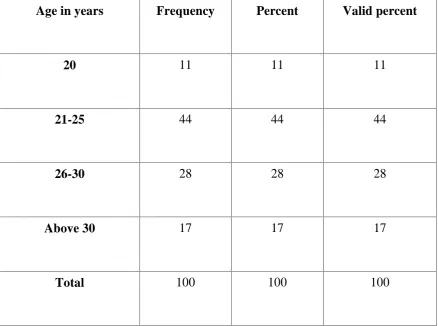
TABLE 1: DISTRIBUTION OF PERSONS IN THE STUDY ACCORDING
TO AGE
Age in years Frequency Percent Valid percent
20 11 11 11
21-25 44 44 44
26-30 28 28 28
Above 30 17 17 17
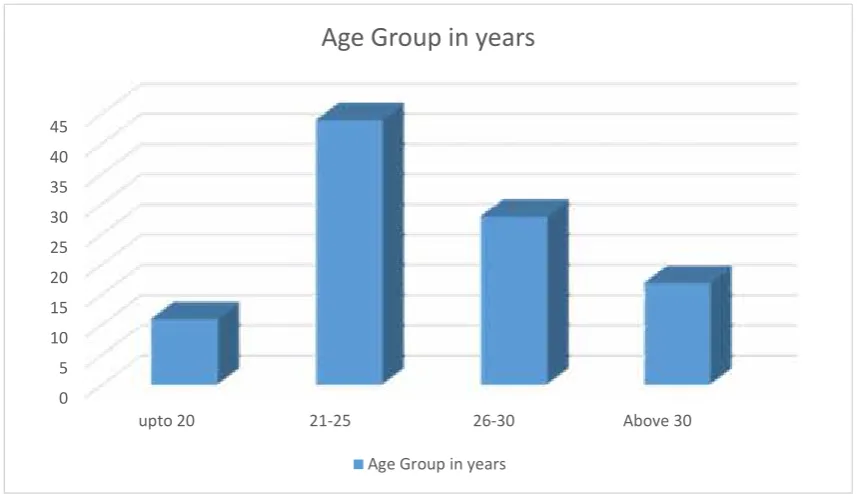
FIG 1: DISTRIBUTION OF PERSONS IN THE STUDY ACCORDING TO
AGE
0 5 10 15 20 25 30 35 40 45
upto 20 21-25 26-30 Above 30
Age Group in years
Age Group in years
In our study, maternal age had no much correlation with the serum
uric acid. In our study age between 21-25 years had much frequency
constituting 44%.
In a study by S. Katherine LAUGHON et al, the mean maternal age and
Above table shows the distribution of persons according to age upto 20
years it is about 11%, 21-25years of age - 44%, in the age group of 26-30 28%
[image:66.595.93.520.285.413.2]above 30 years it is about 17%.
TABLE 2: DISTRIBUTION OF PERSONS IN THE STUDY ACCORDING
TO PARITY
Parity Numbers Percentage
Primi 53 53
Multi 47 47
Total 100 100
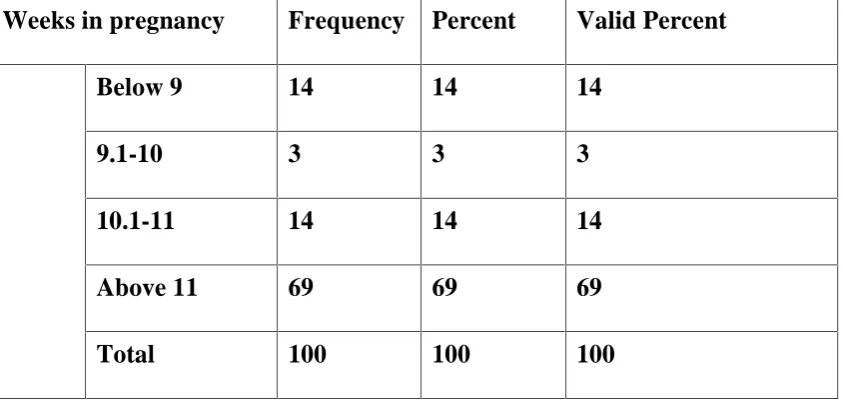
TABLE 3: Distribution of persons with gestational age in weeks
Weeks in pregnancy Frequency Percent Valid Percent
Below 9 14 14 14
9.1-10 3 3 3
10.1-11 14 14 14
Above 11 69 69 69
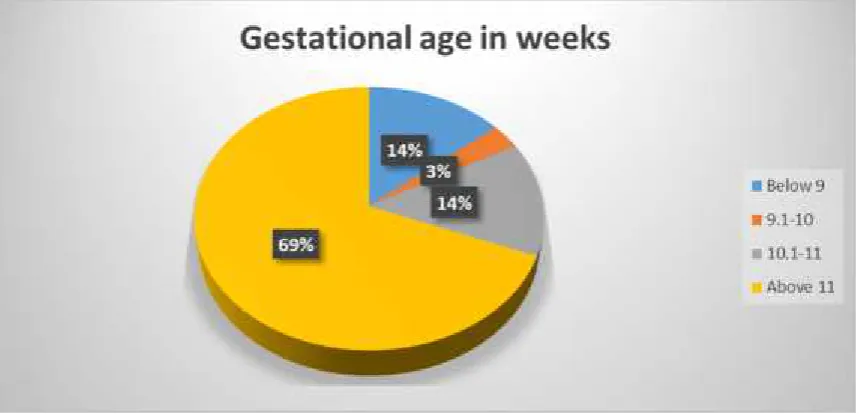
[image:66.595.98.520.491.691.2]FIG 2: GESTATIONAL AGE IN WEEKS
In our study the frequency is high around above 11 weeks. And this had no
Table 4: Distribution of maternal age with elevated uric acid
Age Number(elevated uric acid)
Upto 20 5
21-25 19
26-30 15
>30 4
Total 43
Among total 43 patients with elevated uric acid 19 of them from 21-25
years of age 15 of them 26-30 years of age.
TABLE 5 : DISTRIBUTION OF SERUM URIC ACID
Frequency Percent Valid Percent
Cumulative
Percent
Normal 57 57 57 57
Abnormal 43 43 43 100
[image:68.595.93.527.502.653.2]FIG 3: DISTRIBUTION OF SERUM URIC ACID
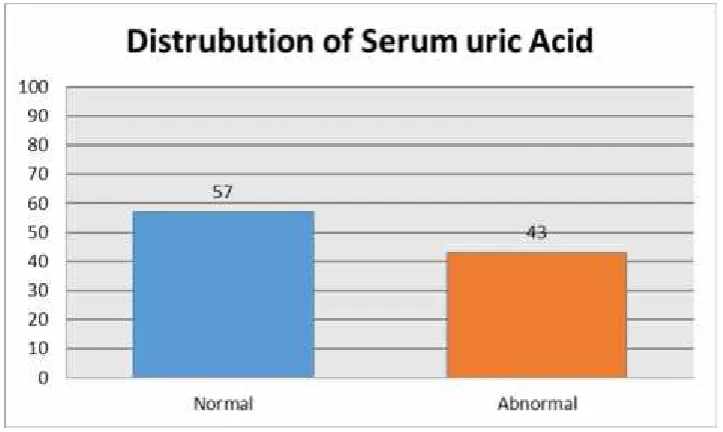
This table shows the distribution of serum uric acid among the total 100
antenatal patients. 57 patients had normal uric acid constituting about 51% and
43 patients had elevated uric acid constituting about 43%
TABLE 6: DISTRIBUTION OF GLUCOSE CHALLENGE TEST
Frequency Percent Valid Percent
Cumulative
Percent
Normal 75 75 75 75
Abnormal 25 25 25 100
[image:69.595.95.527.558.709.2]FIG 4:DISTRIBUTION OF GLUCOSE CHALLENGE TEST
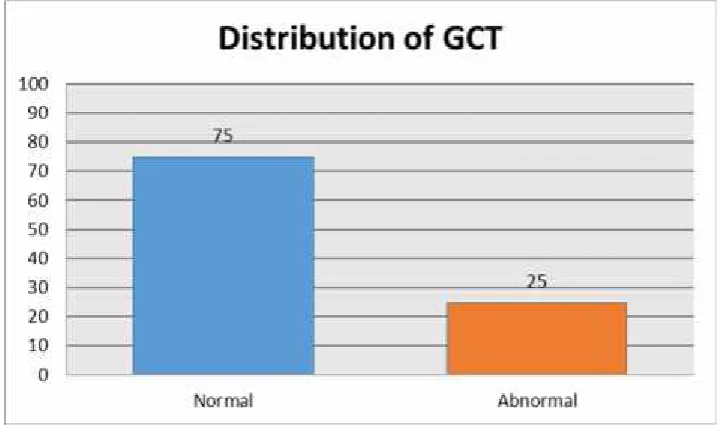
This above table shows the distribution of OCGT. GCT was normal in 75
patients, constituting 75% and GCT was positive in 25% constituting 25%.
TABLE 7: GLUCOSE TOLERANCE TEST
Frequency Percent Valid Percent
Cumulative
Percent
Normal 90 90 90 90
Abnormal 10 10 10 100
[image:70.595.94.526.491.645.2]FIG 5: GLUCOSE TOLERANCE TEST
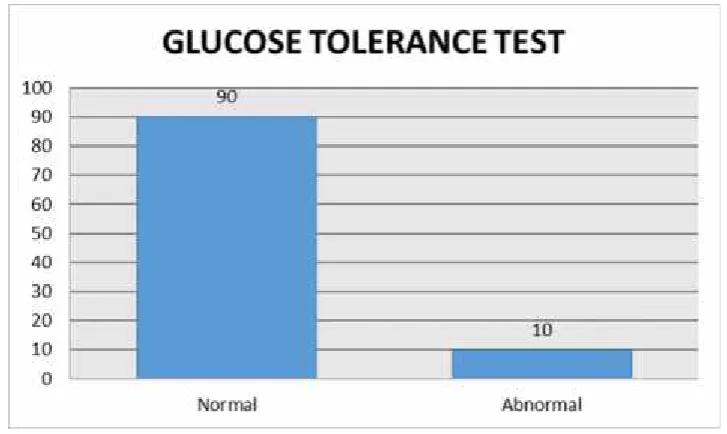
This above table infers that 10 patients had GTT constituting 10% and 90
patients negative constituting 90%.
TABLE 8: SERUM URIC ACID * GCT CROSS TABULATION
OGCT
Uric Acid OGCT Normal OGCT Abnormal
Uric Acid
Normal
45 12
Uric Acid
Abnormal
[image:71.595.93.507.490.703.2]N Mean
Std.
Deviation
Correlation
coefficient
P value
URIC 100 3.50 1.21
0.209 0.036
[image:72.595.132.492.313.525.2]OGCT 100 114.90 31.79
FIG 6: RELATION BETWEEN SERUM URIC ACID AND GCT
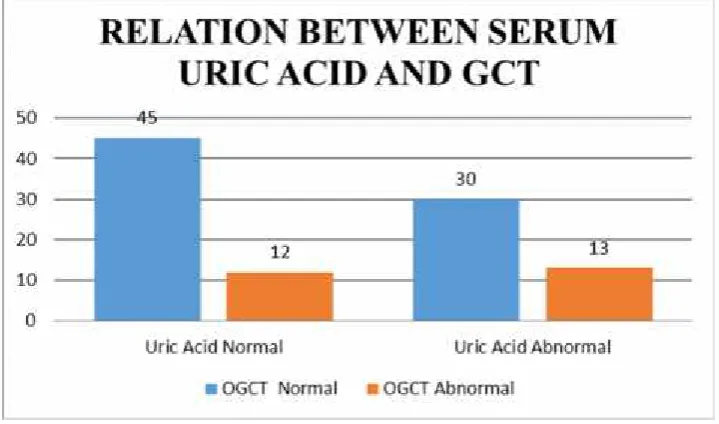
In our study of the total patients 43 with elevated uric acid, 13 patients
had positive GCT–constituting 37%. and those with normal uric acid of 57
TABLE 9: SERUM URIC ACID * GTT CROSS TABULATION
Uric Acid
GTT
Normal Abnormal
Normal 55 2
Abnormal 35 8
Total 90 10
Uric Acid
GTT
P value
Normal Abnormal
Normal 55 2
0.041
FIG 7: RELATIONSHIP BETWEEN SERUM URIC ACID AND GTT
In our study among the 43 patients with elevated uric acid, 8 patients
were positive for GTT. And the remaining 35 negative for GTT. And among the
57 patients with normal uric acid only 2 were GTT Positive. Hence elevated uric
TABLE 10: DISTRIBUTION OF PATIENTS DIAGNOSED GDM
ACCORDING TO PARITY
PARITY TOTAL NO OF
PATIENTS
NO OF PATIENTS
WITH GDM
PRIMI 53 5
MULTI 47 5
TABLE 11: DISTRIBUTION OF PATIENT DIAGNOSED AS GDM
ACCORDING TO AGE
AGE NO OF PATIENT DIAGNOSED AS
GDM
UPTO 20 0
21-25 4
26-30 3
>30 3
[image:75.595.94.532.507.718.2]TABLE 12: CROSS TABULATION OF ELEVATED URICACID WITH
DEVELOPMENT OF GDM
NO OF PATIENT OGCT GTT POSITIVE
+VE _VE
URIC ACID
ABNORMAL (N 43)
13 20 8
URIC ACID NORMAL
(N 57)
12 45 2
Total 25 65 10
TABLE 13: DESCR`IPTIVE STATISTICS
N Mean Std.
Deviation P value
AGE 100 25.36 4.77
HT 100 151.44 7.45
WT 100 50.66 7.03
GA_WEEK 100 12.31 2.04
URIC 100 3.50 1.21 0.426
OGCT 100 114.90 31.79 <0.0001
[image:76.595.96.527.516.715.2]N Mean Std. Deviation Correlation coefficient P value
URIC 100 3.50 1.21
0.179 0.074
[image:77.595.92.570.175.299.2]BMI 100 22.19 3.37
TABLE 14: RELIABILITY OF THE TEST SERUM URIC ACID IN
PREDICTING GDM
Sensitivity Specificity Positive
predictive Value Negative predictive Value Odds ratio
80% 69% 18.65 96.4% 6.2
In a similar study by S. Katherine LAUGHON et al, his hypothesis was the mean
maternal age and gestational age at sampling decreased slightly with increasing
uric acid quartile. Maternal pre- pregnancy BMI increased linearly with
increasing uric acid quartile (p<0.01 for trend and was associated with uric acid
TABLE 15: COMPARISON
Our Study S.Katherine laughon et
al
Positive predictive
value
18.6 % 12
Negative predictive
value
96.4% 96.7
DISSCUSSION
Pregnancy induces progressive changes in maternal carbohydrate
metabolism. As pregnancy advances insulin resistance and diabetogenic stress
due to placental hormones necessitate compensatory increase in insulin
secretion. When this compensation is inadequate gestational diabetes develops
It is possible that the association of uric acid with insulin resistance
is causal. Two mechanisms have been hypothesized by which uric acid can cause
insulin resistance. Nakagawa et al. proposed that uric acid causes endothelial
dysfunction and decreases nitric oxide production by the endothelial cell. In
animals, insulin's action on glucose uptake into cells in the skeletal muscle and
adipose tissue is dependent on nitric oxide. Thus, decreases in nitric oxide lead to
decreased glucose uptake and the development of insulin resistance. Another
mechanism by which uric acid may induce insulin resistance may be that uric acid
causes inflammation and oxidative stress in adipocytes, which is a contributor to
In our prospective study 100 antenatal women were included
belonging to first trimester, who were attendees of Govt. tirunelveli medical
college In our study of the total 100 antenatal 10 were developed GDM. Out of 10
8 had elevated serum uric acid in first trimester, which constitute about 16.7(
% within in GTT).And among 2 GDM mothers with normal serum uric acid
constitute about 3(% within GTT).with p value <0.001)
In our study all antenatal women undertook glucose challenge test (GCT),
more of a screening test. Of the normal uric acid GCT was positive among
12 mothers(constituting 21%).Of the elevated serum uric acid GCT was
positive among 13% mothers(constituting 66.7%).With significant p< 0.001
Though uric acid was strongly associated with body mass index, the
risk of gestational diabetes was increased among women with elevated first
trimester uric acid independent of BMI.
Our findings are consistent with the association of uric acid with
insulin resistance in the non-pregnant population.1 In a large cross-sectional
study of 53,477 non-pregnant adults, serum uric acid was positively correlated
metabolic syndrome, including waist circumference, low HDL cholesterol,
hypertriglyceridemia, hypertension and fasting glucose ≥
110 mg/dl.
A study by Di Cianni et al. in which serum uric acid was
measured at a median of 16 months postpartum in women who had pregnancies
complicated by gestational diabetes. Uric acid was significantly higher in women
with metabolic syndrome (4.8 ± 1.2 mg/dl) versus women without metabolic
syndrome (4.1 ± 0.8, p<0.01), independent of BMI, and metabolic syndrome is a
We did not measure creatinine in order to adjust for glomerular
filtration rate (GFR), but the majority of women would be expected to have
normal excretion since we excluded women with prior diabetes,
hypertension, kidney disease or major medical problems
Hyperuricemia has also been demonstrated to be a risk factor for
developing type 2 diabetes.
This study demonstrates a striking association between first trimester
uric acid and risk of developing gestational diabetes. Women who have a
pregnancy complicated by gestational diabetes have up to a 50% chance of
developing type 2 diabetes in their lifetime. It would be interesting to know
whether these were the women with elevated uric acid in the first trimester.
The relationship of uric acid elevation in early pregnancy does indicate
that metabolic state may affect adverse pregnancy outcomes. With the increase
in both metabolic syndrome and obesity, more women are entering pregnancy
with these conditions. It is possible that of the women who develop GDM, those
with elevated first trimester uric acid are the women who are at risk to develop
Thus we postulate that elevated first trimester serum uric acid helps in
the prediction of gestational diabetes mellitus and also identify those at risk of
developing type II Diabetes mellitus & follow up; also to counsel the patient
CONCLUSION
The objective of implementing an antenatal screening test for GDM
is to identify pre-symptomatic women who will subsequently develop
complications of pregnancy and implement efficacious treatment to reduce
morbidity and mortality. Currently, complications of pregnancy due to GDM are
not diagnosed until mid-late gestation.
It is important to recognize that by the time GDM is diagnosed in
the late second or early third trimester of pregnancy, the ‘pathology’ is probably
established and that reversal of the potential adverse perinatal outcomes may
be limited. Many health professionals advocate
the need for an earlier diagnostic/predictive test for GDM, one
among themis “THEFIRST TRIMESTER SERUM URICACID”.
A pregnant woman with high risk factors as marked obesity, strong
family history of Type II DM, previous history of GDM, impaired glucose
metabolism or glucosuria, History of neonatal death, History of fetal macrosomia,
The use of FIRST TRIMESTER SERUM URIC ACID as a
predictor of GDM is simple, inexpensive, non invasive and easy to perform. This
can be used as a screening test for the prediction of GDM.
Hence in routine antenatal care with predictive test like first
trimester serum uric acid can be applied as a screening test for all women so
BIBLIOGRAPHY
1)Modan M,Halkin H,Karasik A. Elevated uric acid –a facet of
hyperinsulinaemia.Diabetologia 1987;30:713-8(PubMed)
2)Nakagawa T,Tuttle KR, Short RA,Jonson RJ. Hypothesis:fructose induced
hyperuricemia as a causal mechanism for the epidemic of the metabolic
syndrome.Nat clin prac Nephrol.2005;1:80-6(PubMed)
3)Masuo k,Kawaguchi ,Mikami H, OGIHARA T.Serum uric acid and
plasma norepinepherine concentrations predict subsequent weight gain and
blood pressure elevation.Hypertension,2003;42:474-80.
4)Choi HK ,Ford ES ,Prevalence of metabolic syndrome in individuals with
hyperuricemia.Am J med.2007;120:442-7.
5)Coutino Tde A,Turner ST,Peyser PA,Bielak LF,Sheedy PF,2nd ,Kullo
IJ.Associations of serum uric acid with markers of inflammation,metabolic
syndrome and subclinical conorary atherosclerosis.Am J Hypertension
;2007;20:83-9
6) Dehghan A, van Hoek M ,Sijbrands EJ A, High uric acid as a novel risk
factor for type 2 diabetes.Diabetes care 2008;31:361-2
7)Weisz B,Cohen O,Homko CJ,Schiff E,Sivan E.Elevated serum uric acid
9)Anastasiou E,Lekakis JP,Alevizaki M,et al.Impaired
endothelium-dependent vasodilatation in women with previous gestational
diabetes.Diabetes Care 1998;21:2111-5
10)Carpenter MW,Couston DR.Criteria for screening tests for gestational
diabetes.Am J Obstet Gynaeco.1982:144:768-73
11)Dooley SL,Metzer BE,Cho N,Liu K.The influence of demographic and
phenotypic heterogeneity on the prevalence of gestational diabetes
milletus.Int J Gynaecol Obstet.1991;35:13-8.
12). Powers RW,Bodnar LM,Ness RB,et al.Uric acid concentrations among
preeclamptic women with gestational hyperuricemia at delivery .Am J
Obstet gynaec.2006;194:160.
13)Yoo TW,Sung KC,Shin HS,et al.Relationship between serum uric acid
concentration and insulin resistance and metabolic syndrome.Circ
J.2005;69:928-33.
14)Nakanishi N,Okamoto M,Yoshida H,Matsuo Y,Suzuki K.Serum uric acid
and risk of development of hypertension and impaired fasting glucose or
TypeII Diabetes in Japanese male office workers.Eur J
Epidemiol.2003;18:523- 30
15)Lind T,Godfrey KA,Otun H,Philips PR.Changes in serum uric acid
17)Cook S,Hugli O,Egli M,et al.Clustering of cardiovascular risk factors
mimicking the human metabolic syndrome X in Enos null mice.Swiss Med
Wkly.2003;133:360-3
18)Roy D,Perreault M,Marette A.Insulin stimulation of glucose uptake in
skeletal muscles and tissues in vivo is NO dependent.Am J
Physiol.1998;274:E692-9
19)Sautin YY,Nakagawa T,Zharikov S,Johnson RJ.Adverse effects of the
classic antioxidant uric acid in adipocytes :NADPH oxidase-mediated
oxidative/nitrosative stress.Am J Physiol.2007;293:C584-96
20) Furukawa S,Fujita T,Shimbukuro M,et al.C-reactive protein and
metabolic syndrome in women with previous gestational diabetes .Diabetes
Metab Res Rev.2007;23:135-40.
21) Di Cianni G,Lencioni C,Volpe L,et al.Increased oxidative stress in
obesity and its impact on metabolic syndrome.J Clin
Invest.2004;114:1752-61
22) Thomas R Moore, MD et al. Diabetes Mellitus and Pregnancy.
Med/2349 at eMedicine. Version: Jan 27, 2005 update.
23) Metzger BE, Coustan DR (Eds.). Proceedings of the Fourth International
24) BECKETT, A.G. &LEWIS, J.G. (1960). Gout and serum uric
parameters in diabetes mellitus. Quarterly Journal of Medicine, 29, 443.
25) BONER,G. &RIESELBACK, R.E. (1974).The effect of glucose upon
reabsorptive transport of urate by the kidney.Advances in Experimental
Medicine and Biology, 41, 781.
26) HERMAN, J.B. & GOLDBOURT, U.(1982).Uric acid&Diabetes
:observations in a population study. Lancet, ii, 240.
27) HERMAN, J.B., MEDALIE, J.H. & GOLDBOURT, U.Diabetes,
prediabetes and uricemia. Diabetologia, 12, 47.
28) Wein, P., Dong, Z. G., Beischer, N. A. & Sheedy, M. T. (1995). Factors
predictive of recurrent gestational diabetes diagnosed before 24 weeks'
gestation. Am J Perinatol, Vol.12, No.5, pp. 352-356, issn 0735-1631
29) Wein, P. & Beischer, N. A. (2000). Observed increase in prevalence of
gestational diabetes is real. Am J Obstet Gynecol, Vol.182, No.4, pp.
992-993, issn 0002-9378
30) Williams, M. A., Qiu, C., Muy-Rivera, M., Vadachkoria, S., Song, T. &
Luthy, D. A. (2004). Plasma adiponectin concentrations in early pregnancy
and subsequent risk of gestational diabetes mellitus. J Clin Endocrinol
Metab, Vol.89, No.5, pp. 2306-2311, issn 0021-972X
31) Savvidou, M., Nelson, S. M., Makgoba, M., Messow, C. M., Sattar, N.
0012- 1797
32) Ryan, E. A. (2011). Diagnosing gestational diabetes. Diabetologia,
Vol.54, No.3, pp. 480-486, issn 1432-0428
33) Sacks, D. A., Chen, W., Wolde-Tsadik, G. & Buchanan, T. A. (2003).
Fasting plasma glucose test at the first prenatal visit as a screen for
gestational diabetes. Obstet Gynecol,Vol.101, No.6, pp. 1197-1203, issn
0029- 7844
34) The Royal Australian and New Zealand College of Obstetricians and
Gynaecologists. (2008). College statement, C-Obs 7, Diagnosis of
gestational diabetes mellitus. Melbourne: authors.
35)Tomazic, M., Janez, A., Sketelj, A., Kocijancic, A., Eckel, J. & Sharma,
P. (2002). Comparison of alterations in insulin signaling pathway in
adipocytes from type 2 diabetic pregnant women and women with
gestational diabetes mellitus. Diabetologia, 45, 502-508
36) Tuffnell, D., West, J., & Walkinshaw, S. (2005). Treatments for
gestational diabetes and impaired glucose tolerance in pregnancy. Cochrane
Database of Systematic Reviews, 1.89
37) Tuffnell, D., West, J., & Walkinshaw, S. (2005). Time to screen for, and
treat, gestational diabetes. British Journal of Obstetrics and Gynaecology,
113, 3-4.
38) Tuomilehto, J., Lindstrom, J., Eriksson, J. & Valle, T. (2001).
PROFORMA
ASSOCIATION OF FIRST TRIMESTER URIC ACID A PREDICTOR OF GDM
OUTCOME.
NAME : AGE: I.P. NO. : SOCIAL
STATUS : BOOKED/UNBOOKED: LMP :
G P L A
EDD : GESTATIONAL AGE :
DATE OF USG : OBSTETRIC
HISTORY : MATERNAL
ILLNESS : GENERAL
EXAMINATION :
HT. WT. PULSE: BP: TEMP:
ANAEMIA: EDEMA: CVS: RS:
OBETETRIC EXAMINATION
USG
BLOOD INVESTIGATIONS‐
• SERUM URIC ACID(<12 weeks)
• GCT (Glucose challenge test)‐ 24‐28 weeks.
S.No Name Age OP No Ht ht in metre Wt BMI GA Weeks
OBS Code
Uric
Acid OGCT GTT
1 Essaki 21 61901 153 1.53 61 26.0584 16 Primi 5.2 189 80/190/188 2 Perumal 37 61911 154 1.54 60 25.2994 14 G3P2L2 3.2 150 N 3 Prabakaran 32 62403 145 1.45 55 26.1593 12 Primi 2.2 166 N 4 Utchimagali 37 16633 165 1.65 56 20.5693 14 G5P1L3 5 203 120/190/150
5 Mala 23 35217 148 1.48 50 22.8269 16 G2A1 2.7 116 N
6 Syed 23 21619 165 1.65 71 26.079 9 G2P1L1 5.2 143 F147/203/170
7 Shanthi 40 61971 156 1.56 65 26.7094 14 C2P1L1 2.5 60 N
8 Anitha 23 61900 149 1.49 43 19.3685 12 C2P1L1 4.1 90 N
9 Jesumariyal 28 57483 149 1.49 49 22.0711 9 Primi 3.2 127 N 10 Uma Mahesh 37 50189 148 1.48 60 27.3923 9 G2P1L1 4.6 156 88/201/166
11 Pushponai 23 56200 155 1.55 49 20.3954 16 G3A2 5 71 N
12 Muthu mari 19 47836 140 1.4 44 22.449 14 Primi 2.2 60 N 13 Valamath 25 57179 152 1.52 44 19.0443 12 Primi 5.1 129 N 14 Seetha 22 57246 153 1.53 45 19.2234 11 Primi 2.8 149 143/187 15 Jennathnish 27 57143 157 1.57 65 26.3702 14 G2P1L1 4.7 140 N 16 Subbulakshmi 21 43036 165 1.65 57 20.9366 11 G2A1 4.2 82 N 17 Ramalakshmi 30 57067 160 1.6 58 22.6563 16 C3P1L1 2.6 86 N 18 Kamalesh 24 56401 148 1.48 45 20.5442 12 C2P1L1 2.6 70 N 19 Rajammal 36 56817 153 1.53 54 23.0681 13 C2P1L1 2.1 147 83/196/169
20 Maheswari 25 54315 146 1.46 49 22.9874 14 Primi 2 81 N
21 Rajkala 26 53557 154 1.54 50 21.0828 16 C3P2L2 3.6 128 N
22 Usha 25 43214 150 1.5 46 20.4444 11 Primi 4.4 86 N
23 Subbulakshmi 21 43036 165 1.65 57 20.9366 14 Primi 4.2 82 N
24 Arumugam 23 43034 158 1.58 45 18.026 11 C2A1 3.8 102 N
25 Muppidathi 20 43038 149 1.49 44 19.8189 13 Primi 2.8 70 N 26 Mani mala 21 43020 165 1.65 63 23.1405 14 C2P2L1 3.2 129 N 27 Marishwari 27 50261 155 1.55 52 21.6441 10 C3P2L2 3.6 77 N
28 Seetha 23 455299 120 1.2 49 34.0278 12 Primi 4.4 113 N
S.No Name Age OP No Ht ht in metre Wt BMI GA Weeks
OBS Code
Uric
Acid OGCT GTT
33 Elizabeth Rani 24 49744 155 1.55 48 19.9792 9 C3P1L1 2.5 100 N 34 Maharaja 21 49784 154 1.54 52 21.9261 11 C2P1L1 3.4 120 N 35 Palaniana 19 47037 152 1.52 55 23.8054 14 Primi 5.6 100 N 36 Petchiammal 23 19536 145 1.45 45 21.4031 10 C3P2L1 3.2 116 N 37 Kalaselvi 21 36746 157 1.57 46 18.662 16 Primi 5.8 88 N 38 Chitra devi 23 45529 120 1.2 49 34.0278 9 Primi 4.4 113 N 39 Amutha 29 31963 155 1.55 61 25.3902 12 C2P1L1 3.4 101 N 40 Benezir 20 45584 147 1.47 54 24.9896 11 Primi 2.7 109 N
41 Annal 26 45557 145 1.45 55 26.1593 15 C3P1L2 3.2 102 N
42 Syed Ali 36 45923 164 1.64 58 21.5645 14 C2P1L1 4.8 125 N 43 Kaneswari 32 405389 151 1.51 50 21.9289 11 G2PL1 3 193 N 44 Essaki selvi 21 45364 154 1.54 52 21.9261 9 Primi 2.9 147 N 45 Ambitha 28 45367 149 1.49 55 24.7737 14 C3P2L2 3.2 63 N
46 Poosomd 33 32665 151 1.51 51 22.3674 16 Primi 3 140 N
47 Mani mala 27 370414 155 1.55 51 21.2279 12 Primi 4.2 106 N 48 Pushpa latha 22 40521 146 1.46 40 18.7652 10 Primi 3.6 90 N
49 Ambika 29 16607 146 1.46 47 22.0492 13 C2P1L1 3 105 N
50 Lakshmi 19 40401 150 1.5 38 16.8889 12 Primi 2.7 123 N
51 Mariammal 26 38402 153 1.53 45 19.2234 9 Primi 3.3 105 N 52 Muthu mari 24 25890 148 1.48 42 19.1746 13 C2P1L1 2.1 128 N 53 Thanga selvi 31 87796 152 1.52 59 25.5367 12 C2P1L1 6.5 60 N 54 Ayyand 37 35430 139 1.39 55 28.4664 14 C2P1L2 2.3 119 N 55 Myder 28 32853 156 1.56 49 20.1348 9 Primi 2.6 141 120/214/193 56 Seetha lakshmi 24 32344 154 1.54 65 27.4077 12 Primi 5.6 199 N 57 Maharani 27 32606 150 1.5 50 22.2222 13 C2P1L1 2.1 60 N 58 Bala Murugesh 28 32486 160 1.6 58 22.6563 11 Primi 5.3 146 N 59 Jeyalakshmi 23 51903 152 1.52 39 16.8802 9 Primi 2 98 N
S.No Name Age OP No Ht ht in metre Wt BMI GA Weeks
OBS Code
Uric
Acid OGCT GTT
65 Meena 20 22368 160 1.6 48 18.75 14 C2P1L1 3.3 108 N
66 Esthar 26 21556 157 1.57 57 23.1247 9 C2P1L2 4.4 83 N
67 Dhendalesh 30 22302 147 1.47 36 16.6597 9 Primi 2.7 113 N 68 Maharasi 18 22201 148 1.48 56 25.5661 13 Primi 5.2 118 N 69 Rajalatha 28 27928 154 1.54 48 20.2395 14 Primi 7.2 140 130/279/160 70 Muthu Selvi 21 27900 145 1.45 53 25.2081 15 Primi 4.7 142 N 71 Muppidathi 29 17238 155 1.55 45 18.7305 12 C4P3L3 2.7 121 N
72 Poovarasu 28 17239 150 1.5 43 19.1111 14 Primi 2 118 N
73 Mari selvi 21 17306 149 1.49 52 23.4224 11 Primi 2 60 N
74 Parvathy 27 17329 138 1.38 48 25.2048 13 Primi 2 108 N
75 Anadha Lakshmi 22 17314 145 1.45 40 19.025 14 Primi 1.9 98 N 76 Muthu Selvi 28 13975 147 1.47 65 30.0801 9 C2P1L1 3.9 120 N 77 Karpaga valli 24 17410 148 1.48 48 21.9138 12 C2P1L1 2.2 95 N 78 Anadha Lakshmi 22 15819 162 1.62 46 17.5278 12 Primi 5.7 158 87/230/180 79 Arumugam 27 96781 160 1.6 54 21.0938 13 Primi 4.8 106 N 80 Malathy 21 15260 157 1.57 50 20.2848 14 Primi 1.9 149 N
81 Karthiga 29 15167 150 1.5 52 23.1111 9 C3P2L1 2.1 82 N
82 Vijayalakshmi 26 15108 160 1.6 58 22.6563 13 C3P2L1 2.2 140 N
83 Aorthy 20 12345 140 1.4 43 21.9388 9 Primi 2 100 N
84 Devika 28 12665 151 1.51 55 24.1217 13 C4P1L1A1 5.2 196 119/231 85 Karpagam 20 15187 148 1.48 43 19.6311 9 Primi 5.3 121 N 86 Ragavali 24 15170 145 1.45 41 19.5006 13 C2P1L1 3.9 149 N 87 Petchiammal 21 14345 155 1.55 42 17.4818 11 Primi 2.5 81 N
88 Sornam 27 12386 158 1.58 52 20.83 14 C3P2L2 2 157 N
89 Devi 23 10074 146 1.46 43 20.1726 13 C2P1L1 2.7 122 N
90 Lakshmi 26 23076 160 1.6 56 21.875 14 Primi 3 101 N
91 Priya 23 22070 154 1.54 52 21.9261 11 Primi 3 98 N
92 Anadhi 24 21086 146 1.46 58 27.2096 16 C2P1L1 3 92 N
S.No Name Age OP No Ht ht in metre Wt BMI GA Weeks
OBS Code
Uric
Acid OGCT GTT
97 Rajevalli 24 28156 148 1.48 55 25.1096 12 Primi 3.2 128 N
98 Veni 26 21260 156 1.56 56 23.0112 14 C2P1L1 5.8 118 N
99 Rajalakshmi 24 20086 152 1.52 50 21.6413 11 Primi 2.3 120 N