d C
ul
tur
e
CHILDREN’S PARTICIPATION IN CULTURE AND
SPORT
Vickie Chamberlain, Kate Sewel and Simon Braunholtz, Ipsos MORI
The views expressed in this report are those of the researcher and do not necessarily represent those of the Scottish Government or
Scottish Ministers.
© Crown Copyright 2008
Limited extracts from the text may be produced provided the source is acknowledged. For more extensive reproduction, please write to
the Chief Researcher at Office of Chief Researcher,
ACKNOWLEDGEMENTS
CONTENTS
LIST OF TABLES AND FIGURES
EXECUTIVE SUMMARY 1
CHAPTER 1: INTRODUCTION 5
CHAPTER 2: PARTICIPATION IN CULTURAL ACTIVITIES 8
OUTSIDE SCHOOL 8
INSIDE SCHOOL 17
CHAPTER 3: ATTENDANCE AT CULTURAL AND SPORTS EVENTS 23
OUTSIDE SCHOOL 23
INSIDE SCHOOL 25
CHAPTER 4: PARTICIPATION IN SPORTS AND PHYSICAL ACTIVITY 28
OUTSIDE SCHOOL 28
INSIDE SCHOOL 36
CHAPTER 5: VOLUNTEERING 47
CHAPTER 6: CONCLUSIONS 43
APPENDIX A GUIDE TO STATISTICAL RELIABILITY
APPENDIX B SAMPLE PROFILE
APPENDIX C SCOTTISH INDEX OF MULTIPLE DEPRIVATION
APPENDIX D AREA CLASSIFICATIONS
LIST OF TABLES AND FIGURES
[image:6.595.67.540.90.777.2]PAGE CHAPTER 2
TABLE 2.1: FREQUENCY OF LIBRARY USAGE 9
FIGURE 2.1: REASONS FOR LIBRARY USAGE 10
TABLE 2.2: FREQUENCY OF VISITS TO HISTORICAL AND ARCHAEOLOGICAL SITES
11
FIGURE 2.2: REASONS FOR VISIT TO HISTORICAL OR ARCHAEOLOGICAL SITE
12
TABLE 2.3: FREQUENCY OF VISITS TO MUSEUMS AND GALLERIES 13
FIGURE 2.3: REASONS FOR VISIT TO MUSEUM OR GALLERY 14
FIGURE 2.4: NUMBER OF ACTIVITIES UNDERTAKEN OUTSIDE OF
SCHOOL IN THE LAST YEAR 15
TABLE 2.4: PARTICIPATION IN ACTIVITIES OUTSIDE OF SCHOOL 16
TABLE 2.5: PARTICIPATION IN ACTIVITIES AT SCHOOL 19
FIGURE 2.5: NUMBER OF ACTIVITIES DONE WHILST IN SCHOOL 20 TABLE 2.6: PARTICIPATION IN ACTIVITIES AT SCHOOL: AGE WITHIN
GENDER
21
CHAPTER 3
TABLE 3.1: EVENTS BEEN TO OUTSIDE OF SCHOOL TIME 24
FIGURE 3.1: NUMBER OF EVENTS BEEN TO IN THE LAST 12 MONTHS,
EXCLUDING SCHOOL TRIPS 25
TABLE 3.2: ATTENDING EVENTS AS PART OF A SCHOOL TRIP 27
CHAPTER 4
TABLE 4.1: PROPORTION OF YOUNG PEOPLE PARTICIPATING IN SPORT OUTSIDE OF SCHOOL, AT LEAST ONCE A WEEK
29
TABLE 4.2: NUMBER OF CLUB MEMBERSHIPS 30
FIGURE 4.1: MEMBERSHIP OF CLUBS BY GENDER 31
TABLE 4.3: AMOUNT OF TIME SPENT DOING PHYSICAL ACTIVITY OUTSIDE OF SCHOOL
32
FIGURE 4.2: MEAN NUMBER OF MINUTES SPENT TAKING PART IN SPORT OR PHYSICAL RECREATION OUTSIDE OF PE LESSONS IN A TYPICAL WEEK
33
TABLE 4.4: REASONS FOR NOT PARTICIPATING IN PHYSICAL ACTIVITY 34 TABLE 4.5: AMOUNT OF TIME SPENT IN PE CLASSES IN SCHOOL 37 FIGURE 4.3: MEAN NUMBER OF MINUTES SPENT TAKING PART IN PE
CLASSES IN SCHOOL IN A TYPICAL WEEK
38
TABLE 4.6: AMOUNT OF TIME SPENT DOING PHYSICAL ACTIVITY ORGANISED THROUGH SCHOOL, BUT OUTSIDE OF PE CLASS TIME
39
FIGURE 4.4: MEAN NUMBER OF MINUTES SPENT TAKING PART IN PHYSICAL ACTIVITY ORGANISED THROUGH SCHOOL BUT OUTSIDE OF PE CLASSES IN A TYPICAL WEEK
40
CHAPTER 5
EXECUTIVE SUMMARY
2. The survey was conducted using Ipsos MORI Scotland’s Schools Omnibus, an annual survey of secondary school pupils. The overall aim of this study was to provide a picture of children’s participation in culture and sport, to complement the forthcoming findings of the Scottish Household Survey (SHS), which will provide data on adult participation.
3. Topic areas covered in this report include:
• Frequency of participation in culture and the arts outside of school, including library usage and visits to historical sites, museums and galleries;
• Participation in culture and the arts in school time;
• Attendance at cultural and sports events outside of school time and as part of school trips;
• Participation in sports and physical activity outside of school time, including club membership;
• Involvement in physical recreation both in PE classes and other types of physical activity organised through school;
• Young people’s involvement in volunteering.
Methodology
4. The sampling universe comprised 369 secondary state schools throughout Scotland with and without special education units in all but one educational authority, and excluded special schools. This sampling frame was stratified by education authority and within each stratum, schools were selected proportional to the size of the school register, thus producing a nationally representative sample of secondary schools.
5. Fieldwork was carried out between 14 February and 1 April 2008. Of the 213 schools approached, fifty agreed to participate in the survey, giving a response rate of 23%. Fully completed questionnaires were obtained from 2,221 pupils, with an average of Background
Survey (SHS) of adults aged 16+ and it was therefore decided to analyse the findings based on 11-15 year olds to guarantee no overlap with the SHS. The survey was administered using self-completion questionnaires in a mixed ability class such as Personal Social Education or Religious Education during one classroom period.
Main findings
Participation in cultural activities inside and outside of school
6. Outside of school, 96% of young people say they have participated in at least one cultural activity in the last 12 months, while 89% say they have attended at least one cultural event.
7. Young people have a wide range of constructive cultural activities open to them, though lack of interest and wanting to do other things in their spare time is a primary factor for non-participation in cultural activities, irrespective of the type of activity or service.
8. Around half of young people have visited a library at least once in the last 12 months, with most doing so to borrow or return books or use computers or the internet. Among non-users, more than half say they have no need to use the facility and two in five prefer to do other things in their spare time or say they have no interest in libraries.
9. More than half of young people say they have been to a historical or archaeological site in the last 12 months, with most going as part of a trip with their family or friends. Slightly fewer have been to a museum or gallery in the last year, though again, visiting with family and friends is the most common reason why they have done so. As with using libraries, young people say they haven’t been to a historical site or museum because of a lack of interest and having other things to do, though concerns are also raised about perceived cost and feeling out of place in such an environment.
10. Young people take part in a broad range of activities outside of school, with more than half stating that they have done four or more of the activities listed in the survey in the last 12 months. There are a number of differences between boys and girls, with girls significantly more likely to have read for pleasure, taken dance lessons and rehearsed for a performance in the last month than boys. Boys, however, are significantly more likely to have used a computer to create original artworks and to have done crafts such as textile, wood or pottery.
country are more likely to have participated in a range of activities than their peers living in the most deprived areas, including dance lessons; playing an instrument or writing music; painting, drawing or sculpture; and reading for pleasure. Overall, those living in the least deprived areas are 1.5 times more likely to have done four or more of the activities listed in the survey whilst at school than those living in the most
deprived areas of Scotland.
Attendance at cultural and sports events inside and outside of school
12. Young people are most likely to have been to see films and live sports events outside
of school on a regular basis in the last year, with girls likely to have gone to a greater number of events than boys.
13. During school time, around three quarters of young people have been to at least one of the events listed in the survey, with watching a film the most widespread activity. Girls are more likely than boys to have been to events as part of a school trip, particularly exhibitions and collections relating to the arts; performance street arts; theatrical performances; and dance events.
Participation in sports and physical activity inside and outside of school
14. Outside of school, around one in seven young people are doing four or more activities at least once a week, with boys and 12 and 13 year olds most likely to be doing so. Boys and girls aged 15 are most likely to participate in only one sporting activity at least once a week outside of school. Overall, 96% of young people participate in one type of sporting activity outside of school PE lessons and not organised by school.
15. Football is the most popular activity for boys to participate in outside of school, with nearly half playing at least once a week. Girls are most likely to do some form of dancing at least once a week.
16. Just over a quarter of young people are a member of a club through which they participate in sports outside of school, with boys most likely to be a member of a club through which they play football and girls more likely to belong to a club or organisation relating to dance.
17. Boys tend to spend significantly more time taking part in physical activity outside of school than girls (around seven hours v. four and a half hours in a typical week), though for both boys and girls, there is a steady decline in the amount of time spent doing physical recreation outside of school as they get older.
19. During school time, young people tend to spend an average of 2.5 hours in PE classes every week, with boys doing around 20 minutes more than girls. S3 and S4 pupils are also more likely to do 20-30 minutes more in PE classes than their peers in S1 and S2.
20. Young people spend an average of 1 hour 17 minutes doing some form of sport or physical recreation organised through their school but outside of PE classes every week, with boys spending significantly more time doing activities outside of classes than girls. However, more than a third of young people do not do any physical activity organised through school, with 14 and 15 year olds least likely to do so. Moreover, whereas time spent in PE lessons tends to increase with age, there is a steady fall in the amount of time young people spend doing physical activity outside
of PE as they get older.
Volunteering
CHAPTER 1:
INTRODUCTION
1.1 This report presents the findings of a survey of secondary school children in Scotland, carried out for the Europe, External Affairs and Culture Directorate of the Scottish Government. The computer tabulations can be found in a separate volume.
Objectives
1.2 The survey was conducted using Ipsos MORI Scotland’s Schools Omnibus, an annual survey of secondary school pupils. The overall aim of this study was to provide a picture of children’s participation in culture and sport, to complement the forthcoming findings of the Scottish Household Survey (SHS), which will provide data on adult participation.
1.3 Topic areas covered in this report include:
• Frequency of participation in culture and the arts outside of school, including library usage and visits to historical sites, museums and galleries;
• Participation in culture and the arts in school time;
• Attendance at cultural and sports events outside of school time and as part of school trips;
• Participation in sports and physical activity outside of school time, including club membership;
• Involvement in physical recreation both in PE classes and other types of physical activity organised through school;
• Young people’s involvement in volunteering.
Sampling and Fieldwork
1.4 The sampling universe comprised 369 secondary state schools throughout Scotland with and without special education units in all but one educational authority, and excluded special schools. This sampling frame was stratified by education authority and within each stratum, schools were selected proportional to the size of the school register, thus producing a nationally representative sample of secondary schools.
Social Education or Religious Education during one classroom period. An Ipsos MORI interviewer was present to explain the survey to pupils; to reassure them about the confidentiality of the survey; to assist them in completing the questionnaire; and to collect completed questionnaires. In classes where four or more children were absent during the self-completion session, questionnaires were left with the teacher to administer upon the pupil’s return to class. Instructions on how the questionnaire should be completed were left with the teacher, together with a reply paid envelope to return the questionnaires to Ipsos MORI upon completion.
Analysis
1.7 This survey of young people aged 11-18 was intended to complement the Scottish Household Survey (SHS) of adults (defined as aged 16+) and it was decided that analysis in this report should be based only on 11-15 year olds (n=1,762), to guarantee no overlap with the SHS. It should also be noted, however, that the sample includes only three 11 year old pupils, making up 0.2% of the sample (one effect of fieldwork taking place during February and March is that the majority of secondary school pupils are aged 12 and over).
1.8 Where a ‘not stated’ category is included in the data tables, this indicates the proportion of respondents that have not given any response to the question referred to.
1.9 When coding urban/rural indicators it is not always possible to provide data for every case. This can be due to a variety of reasons such as respondent errors due to incomplete and incorrect postcodes given and partly because information does not exist for all postcodes. In this study successful matches are provided for 87% of respondents.
1.10 For the purposes of analysis, the (then) Scottish Executive’s Urban Rural Classification definitions have been used to attach an urban, small town or rural classification to each respondent’s data where postcode information exists. An explanation of how the classifications have been used can be found in the appendices.
1.11 The Scottish Index of Multiple Deprivation (SIMD), constructed by the Scottish Executive, was used in analysis and the appendices provide a full explanation of how the SIMD was used.
Presentation and interpretation of the data
1.12 Throughout this report we have used the term ‘young people’ when referring to 11-15 year olds.
1.13 Unless otherwise stated, all differences commented on in the research findings are statistically significant.
1.15 Where percentages do not sum up to 100%, this may be due to computer rounding, the exclusion of don’t know/not stated categories or multiple answers. Throughout the report, an asterisk (*) denotes any value less than one half of a percent.
1.16 Data are weighted by gender, ethnicity and year group to Scottish Government annual pupil census data (2007) and by 2007 ONS output area classifications. The effect of weighting is shown in the sample profile in the appendices and in the computer tables.
CHAPTER 2: PARTICIPATION IN CULTURAL ACTIVITIES
OUTSIDE SCHOOL
Participation in and attendance at cultural activities outside school
2.1 The Scottish Government’s Manifesto committed to widening access to culture, because of the benefits that participation in culture can bring to the individual. Previous research1 has shown that participation in cultural activities can increase confidence, improve self-esteem, lead to new skills and improve attendance and educational outcomes at school.
2.2 Overall, this survey shows that outside of school, 96% of young people say they have participated in at least one cultural activity in the last 12 months, while 89% say they have attended at least one cultural event.
Library usage
2.3 Half of young people surveyed (51%) have visited a library at least once in the last 12 months, with girls more likely than boys to have done so (55% vs. 47%). While some have been infrequent visitors, two in five have not visited a library at all in the last 12 months (41%), which includes nearly half of 14 year olds and boys (see Table 2.1 below).
2.4 Twelve year olds are most likely to be frequent visitors, with one in ten (10%) making a trip to the library once a week or more often. This is most likely to be 12 year old girls (13%) rather than 12 year old boys (8%). As well as age and gender differences, young people with no working parents in the household are more likely to use the library at least once a week (9%, compared with 4% of those with two working parents) as are those living in a rural area (9%, vs. 5% of urban residents).
Table 2.1: Frequency of library usage
Q – In the last 12 months, how often have you been to a library (excluding school trips)?
Base: 1,762 11-15 year olds
%
Gender Age
All M F 11-12 13 14 15
Not visited library in last 12
months 41 46 37 33 39 49 44
Once or twice in last 12 months 22 20 23 16 22 20 27 Three or four times in last 12
months
9 10 9 12 10 8 7
Once every couple of months 6 5 7 8 5 6 6
Once or twice a month 8 7 9 13 7 6 8
Once a week or more often 6 5 7 10 6 5 2
Don’t know 7 8 7 7 10 6 6
Not stated 1 1 * 1 1 * 1
Source: Ipsos MORI
Reasons for library usage
Figure 2.1: Reasons for library usage
Source: Ipsos MORI
8% 6%
10% 16%
37%
67%
Use computers/internet
To browse/read
Borrow/return/renew books
Borrow/return/renew DVDs/ CDs, videos, CD-ROMs
Something else
Find information on local area/services
Base: All who have visited a library at least once in the last 12 months (884)
Reasons for non-usage
2.6 For the 41% of young people who said they had not visited a library in the last twelve months, the top three reasons are concerned with young people not having a particular interest or reason to use the facility:
• 55% say they don’t have any need to go to the library;
• 42% prefer to do other things in their spare time;
• 38% are not really interested in libraries generally.
2.7 One might imagine that this lack of concern with what libraries have to offer may in part be due to low levels of awareness of what functions they have besides lending books. However, since just 1% of respondents said they did not have enough information about what there is to do at the library, this may not be the case.
2.8 Thirteen year olds are most likely to express having no interest in libraries (45%, compared with 38% overall) and also preferring to do other things in their spare time (52% vs. 42% overall). Fifteen year olds are most likely to feel that they have no need to go to the library (63%, vs. 55% overall) and as might be expected, young people living in a rural area are more liable to attribute their lack of use of the library to poor transport and not being able to get there easily (9%, compared with just 1% of those living in an urban area).
Visits to historical and archaeological sites
2.10 Sub-group differences are most notable when looking at the proportion of young people who have not visited any historical or archaeological site in the last 12 months. Overall, nearly two in five (38%) have not made any visits and this increases to 45% of 14 year old girls and boys (though there is no clear pattern of falling numbers of visits with rising age). Lower household income appears to be closely linked with lack of visits to sites, with young people who live in the most deprived areas of the country and in households where no parents work, significantly more likely to have made no visits (51% and 46% respectively).
Table 2.2: Frequency of visits to historical and archaeological sites
Q – In the last 12 months, how often have you been to a historical or archaeological site (e.g. castle or historical monument), excluding school trips?
Base: 1,762 11-15 year olds
%
Gender Age
All M F 11-12 13 14 15
Not visited any site in last 12 months
38 38 37 35 31 45 39
Once or twice in last 12 months 32 31 33 30 36 27 35 Three or four times in last 12
months
12 11 14 12 14 12 12
Once every couple of months 6 7 5 8 7 5 5
Once or twice a month 3 4 3 4 3 4 2
Once a week or more often 1 1 1 2 * 1 1
Don’t know 7 8 7 9 8 6 6
Not stated 1 1 * 1 * 1 *
Source: Ipsos MORI
Reasons for visits
Figure 2.2: Reasons for visit to historical or archaeological site
Source: Ipsos MORI
5% 3%
9% 19%
27%
72%
Personal enjoyment/relaxation
Learn something new Trip with family or friends
Organised group or tour
Some other reason
Taking part in conservation project
Base: All who have visited a historical or archaeological site (excluding school trips) in the last 12 months (932)
Reasons for not visiting sites
2.12 As with libraries, young people’s reasons for not visiting historical or archaeological sites are primarily concerned with not being interested and having other things to do in their spare time (both 46%). Girls are particularly liable to mention a lack of interest (52%, compared with 41% of boys).
2.13 Lack of transport is cited by one in ten (11%) of the young people surveyed as an explanation for not visiting sites, while for seven per cent, perceived cost, lack of information, and not having anyone to go with are concerns.
Visits to museums and galleries
2.14 Slightly fewer than half of young people (45%) have been to a museum or gallery, other than as part of a school trip in the last 12 months and among those who have, most have done so only once or twice (32% - see Table 2.3 below).
2.15 A greater proportion, 48%, have not visited a museum or gallery at all in the last year, and there are a couple of notable differences by sub group.
• 14 year olds (55%) and 15 year olds (50%) are more likely than their younger peers to not visit museums or galleries;
Table 2.3: Frequency of visits to museums and galleries
Q – In the last 12 months, how often have you been to a museum or gallery (excluding school trips)?
Base: 1,762 11-15 year olds
%
Gender Age
All M F 11-12 13 14 15
Not visited any museum or gallery in last 12 months
48 48 48 41 45 55 50
Once or twice in last 12 months 32 32 33 34 33 29 33 Three or four times in last 12
months 8 8 9 8 9 6 10
Once every couple of months 4 4 3 5 3 4 3
Once or twice a month 1 1 1 2 1 * *
Once a week or more often * * * 1 * * 0
Don’t know 6 6 6 8 7 6 4
Not stated 1 1 1 1 1 1 0
Source: Ipsos MORI
Reasons for visits
2.16 As with trips to archaeological and historical sites, the primary reason young people visit museums and galleries is as part of a visit with family or friends (66% - see Figure 2.3). Those living in the least deprived areas of the country (72%) and in rural areas (74%), are most likely to cite this as one of the reasons for their visit.
Figure 2.3: Reasons for visit to museum or gallery
Source: Ipsos MORI
5% 4% 6% 10% 17% 19% 27% 66%
To see particular exhibition/display
General interest in subject of museum/collection
Visiting with family/friends
Organised group or tour
Taking part in creative activity
With club or organisation e.g. Girl Guides or youth club
Base: All who have visited a museum or gallery (excluding school trips) in the last 12 months (789) Been before and wanted to go
again
Some other reason
Reasons for not visiting museums and galleries
2.18 As with their main reasons for not visiting historical and archaeological sites, many young people are just not especially interested in visiting museums and galleries and have other things they would prefer to do in their spare time (both cited by 47%). Girls are particularly likely to say that they have other things they would prefer to do (52%), but a smaller proportion also appear to have concerns about visiting these types of attraction, with 4% saying they might feel out of place or uncomfortable.
2.19 For 6%, concern about the cost of visiting has seemingly deterred them from making a visit, and this rises to one in ten (11%) young people whose parents are both out of work.
Frequency of participation in artistic and cultural activities
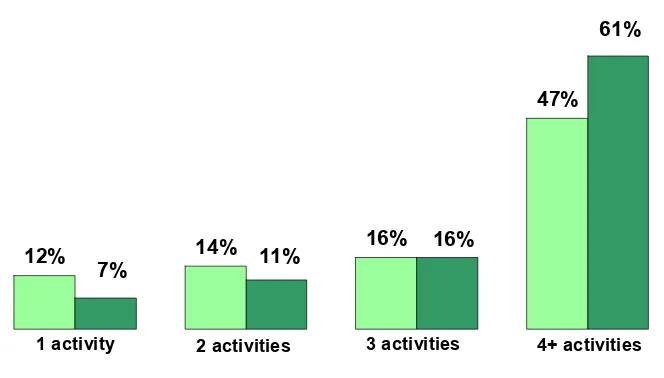
2.20 Young people take part in a broad range of activities outside of school, with more than half (54%) stating that they have done four or more of the activities listed in the survey in the last 12 months. Nevertheless, as with participation in activities while in school, there are a number of differences in young people’s involvement in pursuits outside of school time.
Differences by gender
Figure 2.4: Number of activities undertaken outside of school in the last year
Source: Ipsos MORI
47%
16% 14%
12%
61%
16% 11%
7%
1 activity 2 activities 3 activities 4+ activities
Base: All respondents aged 12-15 (1,759)
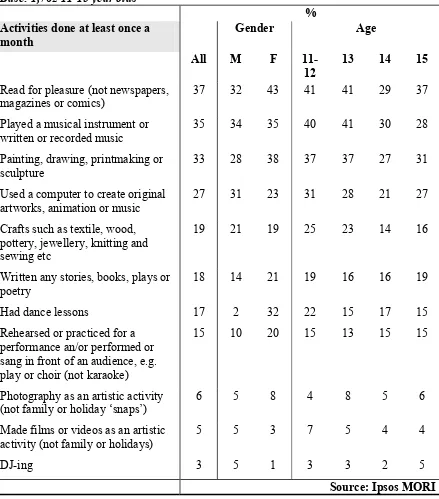
Table 2.4: Participation in activities outside of school
Q – In the last 12 months, how often have you done each of these activities outside of school?
Base: 1,762 11-15 year olds
% Activities done at least once a
month Gender Age
All M F
11-12 13 14 15
Read for pleasure (not newspapers, magazines or comics)
37 32 43 41 41 29 37
Played a musical instrument or
written or recorded music 35 34 35 40 41 30 28
Painting, drawing, printmaking or
sculpture 33 28 38 37 37 27 31
Used a computer to create original artworks, animation or music
27 31 23 31 28 21 27
Crafts such as textile, wood, pottery, jewellery, knitting and sewing etc
19 21 19 25 23 14 16
Written any stories, books, plays or poetry
18 14 21 19 16 16 19
Had dance lessons 17 2 32 22 15 17 15
Rehearsed or practiced for a performance an/or performed or sang in front of an audience, e.g. play or choir (not karaoke)
15 10 20 15 13 15 15
Photography as an artistic activity (not family or holiday ‘snaps’)
6 5 8 4 8 5 6
Made films or videos as an artistic
activity (not family or holidays) 5 5 3 7 5 4 4
DJ-ing 3 5 1 3 3 2 5
Source: Ipsos MORI
Differences by age
2.22 It is clear that young people’s involvement in artistic activities outside of school varies by age, with regular involvement2 in certain pastimes far less common among 14 and 15 year olds than 12 and 13 year olds. Indeed, there are no instances where 14 and 15 year
olds are significantly more likely than 12 and 13 year olds to be doing any of the hobbies listed on a regular basis. For instance, 12 and 13 year olds are far more likely to have done crafts such as textile, wood, knitting or sewing at least once a month than 14 and 15 year olds. Twelve and 13 year olds are also much more likely to have played a musical instrument or written or recorded music and done painting, drawing or printmaking on a regular basis than their older peers.
2.23 There are, however, some activities for which age does not appear to be an influencing factor in involvement. There is little difference in the proportions who say they have rehearsed or practiced for a performance; DJ’d; written stories or books; or done photography.
Differences by area
2.24 There are no clear associations between frequency of participation in activities outside of school and the type of area the young person lives in, but there are some findings worth highlighting nonetheless:
• Young people living in an urban area are more likely to attend dance lessons on a weekly basis than those living in a rural area (18% vs. 12%);
• Those living in the least deprived areas of Scotland are significantly more likely to have played a musical instrument or written or recorded music on a weekly basis than their peers living in the most deprived areas (47% vs. 17%);
INSIDE SCHOOL
Artistic activities
2.25 Young people carry out a diverse range of activities while at school, with more than half (52%) asserting that they have done four or more of the activities listed in the survey. Analysis shows that there are some significant differences between sub groups, including gender, age and the type of area where young people live.
2.26 Table 2.5 below illustrates differences in participation between genders for different activities. On balance, girls appear to have participated in a greater range and number of activities at school than their male peers, with differing levels of participation most prominent in relation to involvement in dance lessons and rehearsing/practicing for a performance.
Table 2.5: Participation in activities at school
Q – Which of the following activities have you done at school in the last 12 months? Base: 1,762 11-15 year olds
%
Gender Year group
All M F S1 S2 S3 S4
Written any stories, books, plays or
poetry 57 53 62 53 53 56 68
Painting, drawing, printmaking or
sculpture 57 53 60 63 73 43 48
Played a musical instrument or written or recorded music
50 50 49 66 66 33 33
Crafts such as textile, wood, pottery, jewellery, knitting and sewing etc
45 48 41 53 59 36 30
Used a computer to create original artworks, animation or music
44 48 40 49 45 39 43
Read for pleasure (not newspapers, magazines or comics)
43 37 48 43 47 35 46
Had dance lessons 33 15 50 41 30 32 29
Rehearsed or practiced for a performance
26 17 34 32 20 23 27
Made films or videos as an artistic activity (not family or holidays)
10 10 10 12 12 11 5
Photography as an artistic activity (not family or holiday ‘snaps’)
7 6 8 7 6 7 8
DJ-ing 4 6 2 6 1 3 6
Done 1 activity 15 18 12 15 12 21 13
Done 2 activities 15 17 14 9 10 20 21
Done 3 activities 15 15 16 12 13 18 18
Done 4+ activities 52 47 57 61 63 38 46
Not stated 2 3 1 2 1 3 2
2.28 Girls are also more likely to have done a greater number of activities than boys, as illustrated in Figure 2.5 below. Nearly three in five girls (57%) claim that they have participated in four or more activities at school in the last 12 months, compared with just under half of boys doing the same number (47%).
Figure 2.5: Number of activities done whilst in school
Source: Ipsos MORI
18% 17%
15%
47% 57%
16% 14%
12%
1 activity 2 activities 3 activities 4+ activities
Q Which of the following activities have you done at school in the last 12 months?
Base: All respondents aged 11-15 (1,762)
Girls Boys
Age and gender differences
2.29 Analysis by age within gender also highlights where there are similarities between genders at certain ages, as well some notable differences (see Table 2.6 below). At different ages, similar proportions of boys and girls have played an instrument or written or recorded music; made films or videos as an artistic activity; and done photography as an artistic activity.
Table 2.6: Participation in activities at school: age within gender
Q – Which of the following activities have you done at school in the last 12 months? Base: 1,762 11-15 year olds
%
Age within gender All
boys All girls
Boy Girl Boy Girl Boy Girl Boy Girl
12 12 13 13 14 14 15 15
Written any stories, books, plays or poetry
53 62 47 56 51 59 49 64 62 67
Painting, drawing, printmaking or sculpture
53 60 64 62 71 73 41 51 35 59
Played a musical instrument or written or recorded music
50 49 67 66 64 70 36 36 33 30
Used a computer to create original artworks, animation or music
48 40 51 45 52 38 44 39 46 38
Read for pleasure (not newspapers,
magazines or comics)
37 48 38 50 42 50 31 40 38 52
Crafts such as textile, wood, pottery, jewellery, knitting and sewing etc
48 41 52 55 60 55 40 36 39 24
Had dance lessons 15 50 25 58 14 47 9 54 15 43
Rehearsed or practiced for a performance
17 34 20 45 12 30 14 31 23 30
Made films or videos as an artistic activity (not family or holidays)
10 10 10 12 12 15 12 11 7 3
Done 1 activity 18 12 18 13 14 9 24 17 17 10
Done 2 activities 17 14 11 8 10 10 23 15 25 19
Done 3 activities 15 16 12 11 14 13 17 19 16 20
Done 4+ activities 47 57 56 66 59 68 32 48 38 50
Source: Ipsos MORI
Differences according to area
2.31 There are some stark differences worth mentioning relating to the type of area where young people live. For instance, those living in the least deprived areas of the country are more likely to have participated in a range of activities than their peers living in the most
CHAPTER 3: ATTENDANCE AT CULTURAL AND SPORTS EVENTS
OUTSIDE SCHOOL
Events attended out of school time
3.1 Young people are most likely to have been to see films and live sporting events on a regular basis3 in the last 12 months. Far fewer have gone regularly, if at all, to any of the other events listed in the survey (see Table 3.1 below).
3.2 While film and sporting events are the most popular activities among both boys and girls and for all age groups, there are some variations to highlight:
• Girls are more likely than boys to have been to see films regularly, with 12 year old (44%) and 15 year old girls (47%) most likely to have done so;
• Boys are much more likely to have gone to sporting events or matches on a regular basis, with very little variation between different aged boys;
• Young people who live in households where both parents work are significantly more likely to have been to the cinema on a regular basis (40%) than those with no parents working (30%);
Table 3.1: Events been to outside of school time
Q – In the last 12 months, how often have you been to each of these events (excluding school trips)?
Base: 1,762 11-15 year olds Events attended at least once a month
%
Gender Age
All M F
11-12 13 14 15
Film at cinema or other venue 37 31 43 38 34 38 40 Live sporting event or match 20 29 10 20 20 19 20 Performance street arts (such as
theatre, music, dance and circus in everyday surroundings like parks, streets or shopping centre)
7 4 10 9 7 5 8
Play, drama and other theatrical performances (such as musicals or pantomime)
4 2 8 7 3 4 4
Other live music event e.g. live band
4 4 5 2 4 4 7
Ballet/contemporary dance/other live dance event
3 * 5 3 4 3 1
Exhibition or collection of art,
photography, sculpture or crafts 2 2 2 1 3 2 2
Event connected with books or writing
2 2 3 3 2 3 1
Opera/classical music performance 2 1 2 1 2 2 1
Differences by gender
[image:31.595.99.427.228.412.2]3.3 Girls tend to go to a greater number of events than boys, with more than two in five girls (42%) having been to 4+ events, compared with just over a quarter of boys (27% - see Figure 3.1 below).
Figure 3.1: Number of events been to in the last 12 months (excluding school trips)
Source: Ipsos MORI
27%
15% 25%
20%
42%
17% 17%
15%
1 event 2 event 3 events 4+ events
Base: All respondents aged 12-15 (1,759)
INSIDE SCHOOL
Events attended as part of school trip
3.4 Three-quarters of young people (74%) have been to at least one of the events listed in the survey, with watching a film the most widespread activity (49%), particularly among S1 pupils (60%).
3.5 On the whole, girls are more likely to have been to events as part of a school trip (see Table 3.2 below). They are significantly more likely than boys to have been to an exhibition or collection relating to the arts; seen performance street arts; been to see a theatrical performance; and been to a dance event. Boys, however, are much more likely to have been to see a film or a live sporting event.
3.6 As with activities participated in whilst at school, girls are more likely to have been to a greater number of events as part of a school trip than boys: nearly one in five (18%) have been to four or more events, compared with just 13% of boys. S1 pupils are most likely to have been to four or more events (20%).
Differences by socio-economic status and area
3.7 There are some differences worth noting relating to the socio-economic status of the young person’s household and the type of area where they live. For example, those living in a household where at least one parent works are significantly more likely to have been to four or more events than those with no parent working (17% vs. 11%).
Table 3.2: Attending events as part of school trip
Q – In the last 12 months, have you been to any of these events as part of a school trip? Base: 1,762 11-15 year olds
%
Gender Year group
All M F S1 S2 S3 S4 Film at cinema or other venue 49 53 46 60 52 50 35 Live sporting event or match 29 37 21 38 30 23 24 Play, drama and other theatrical
performances (such as musicals or pantomime)
24 17 30 29 16 22 28
Performance street arts (such as theatre, music, dance and circus in everyday surroundings like parks, streets or shopping centre)
20 16 24 21 19 20 21
Other live music event e.g. live
band 19 17 21 25 17 19 16
Exhibition or collection of art, photography, sculpture or crafts
18 13 23 19 17 15 21
Event connected with books or writing
11 10 13 12 15 13 5
Opera/classical music performance 5 4 5 6 2 4 7
Ballet/contemporary dance/other live dance event
5 1 9 7 4 6 3
Done 1 activity 28 27 28 27 29 27 28
Done 2 activities 19 21 17 23 19 18 17
Done 3 activities 12 11 13 15 11 9 14
Done 4+ activities 15 13 18 20 14 17 12
Not stated 26 27 24 16 27 30 30
CHAPTER 4: PARTICIPATION IN SPORTS AND PHYSICAL
ACTIVITY
OUTSIDE SCHOOL
Participation in sport and physical recreation outside of school
4.1 In its strategy for developing physical activity4, the Scottish Executive stated that young people should be doing at least one hour of moderate activity on most days of the week. While we do not know in detail for how long and on how many days a week young people are exercising from this survey, we can look at how many activities they are doing every week and through this attempt to build up a picture of the proportion doing ‘regular’ exercise.
4.2 Overall, this survey shows that 96% of young people participate in at least one sporting activity outside of school PE lessons and not organised by school.
Number of activities participated in
4.3 Around one in seven young people (15%) are doing 4+ activities at least once a week, with boys, 12 year olds and 13 year olds most likely to be doing so (see Table 4.1 below). Those living in rural areas are also considerably more likely to be doing 4+ activities than their peers living in urban areas (19%, compared with 13%).
4.4 The same proportion of young people (15%) also claim to be doing three activities at least once a week, while more are doing only two activities (20%) or one activity (28%). Boys and girls aged 15 are most likely to be participating in only one sporting activity outside of school at least once a week.
Table 4.1: Proportion of young people participating in sport outside of school, at least once a week
Q – How often do you do each of the following sports or physical recreation, on your own or with others outside of school PE lessons and not organised by school
Base: 1,762 11-15 year olds Doing activity at least once a week
%
Gender Age
All M F 11-12
13 14 15
Football (organised match or
kick-about with friends in the park) 29 48 10 31 33 28 24
Walking 2+ miles (for recreation or exercise)
28 27 28 23 26 30 30
Running/jogging 26 31 20 29 30 25 21
Dance 17 1 33 21 15 18 13
Cycling (for sport, recreation or
exercise) 16 22 9 18 19 17 10
Swimming 15 13 17 23 19 13 5
Basketball 11 14 7 14 12 8 8
Badminton 10 12 9 9 13 10 10
Golf 5 8 1 5 5 4 5
Tennis 4 6 3 5 7 2 3
Other sport or physical recreation 25 24 26 26 31 22 22
Doing 1 activity 28 28 29 21 28 28 35
Doing 2 activities 20 19 20 25 21 17 16
Doing 3 activities 15 16 13 15 16 16 12
Doing 4+ activities 15 19 12 17 19 15 10
Source: Ipsos MORI
Types of activities participated in
are slightly more likely than boys to swim every week (17% vs. 13%), with 12 year old girls (26%) and those living in the most deprived areas (23%) most likely to do so.
4.7 The only other sport for which there appears to be a link between frequency of activity and level of deprivation is badminton, with young people living in the least deprived areas of the country nearly three times as likely to have participated in the sport on a weekly basis than those living in the most deprived areas (14%, compared with 5%).
Membership of clubs
4.8 Just over a quarter of young people (27%) are a member of a club through which they participate in sports outside of school, with a further 13% the member of two or more clubs (see Table 4.2 below).
Table 4.2: Number of club memberships
Q – Are you a member of a club through which you participate in any of these sports or physical recreation, outside of school?
Base: 1,762 11-15 year olds
%
Gender Age
All M F
11-12 13 14 15
Member of 1 club 27 26 29 23 29 29 28
Member of 2 clubs 9 9 9 9 11 7 7
Member of 3 clubs 2 3 2 4 2 2 2
Member of 4+ clubs 2 2 2 2 3 2 1
Source: Ipsos MORI
4.9 Figure 4.1 below highlights some clear gender differences in club membership: boys are most likely to be a member of a club through which they play football (22%), with membership tending to peak at age 13 (25%). Girls, on the other hand, are much more likely to belong to a club or organisation relating to dance (19%), with 14 year olds most likely to go to some form of dance club (23%).
[image:36.595.72.514.347.523.2]Figure 4.1: Membership of clubs by gender
Source: Ipsos MORI
1% 1% 3% 17% 2% 12% 1% 3% 3% 4% 6% 9% 22% 1% 1% 2% 2% 5% 3% 2% 4% 19% Girls Boys Badminton Swimming Dance Running/jogging Walking Cycling Football Basketball Tennis Golf
Base: All respondents aged 11-15 (1,762)
Other
4.11 There does not appear to be a consistent association between membership of clubs and deprivation or the urbanity or rurality of the area where young people live. There are, nonetheless, some significant distinctions worth highlighting:
• Young people living in the least deprived areas of the country are nearly four times as likely to be a member of a football or dance club than those living in the most deprived areas (both 15% vs. 4%);
• Those living in a small town are much more likely to be a member of a golf club (10% compared with 5% of those living in rural or urban areas); and
• Young people living in a rural area are significantly more likely to be a member of a badminton club than their peers living in urban areas (8% vs. 3%).
Amount of time spent doing physical activity
Table 4.3: Amount of time spent doing physical activity outside of school
Q – In a typical week, how much time in total do you spend taking part in sport or physical recreation outside of school PE lessons?
Base: 1,762 11-15 year olds
%
Gender Year group
All M F
11-12 13 14 15
None 6 5 8 5 5 8 6
Up to 59 minutes 2 2 2 3 2 3 1
1 hour – 1 hour 59 minutes 10 7 13 12 7 9 11
2 hours – 2 hours 59 minutes 15 12 17 14 15 14 15
3 hours – 3 hours 59 minutes 12 10 13 11 13 8 14
4 hours – 4 hours 59 minutes 10 10 10 8 9 10 11
5 hours – 5 hours 59 minutes 8 9 6 9 7 7 8
6 hours or more 31 40 22 30 35 32 27
Mean (minutes) 345 418 271 379 366 327 315
Source: Ipsos MORI
Figure 4.2: Mean number of minutes spent taking part in sport or physical recreation outside of PE lessons in a typical week
Source: Ipsos MORI
403 423
397 457
227 242
328 301
12 yr olds 13 yr olds 14 yr olds 15 yr olds
Base: All respondents aged 12-15 (1,759)
Girls Boys
4.14 Fourteen year olds girls (9%) are most likely to say they have done no physical recreation outside of PE lessons, as are those living in a household where no parent works (10%, compared with 5% of those with both parents working).
Reasons for not participating in physical activity
4.15 The primary reason young people give for not having done any sport or recreational activity outside of PE lessons in the last 12 months (6% of total) is that they prefer to do other things in their spare time (38%). This is the most common explanation given by boys (43%), but for girls, the main rationale they give for their lack of participation is that they don’t have anyone to do it with (25%). A quarter of both boys (25%) and girls (23%) say they just don’t want to do any type of sport or physical recreation.
Table 4.4: Reasons for not participating in physical activity
Q – If you haven’t done any sport or recreational activity in the last 12 months, outside of school PE lessons, what are the reasons why you have not done so?
Base: All excluding ‘don’t know’ and ‘not stated’ responses (388) %
Gender Age
All M F 11-12
13 14 15
I prefer to do other things in my spare time
38 43 33 30 40 44 37
I don’t want to do more sport or physical recreation
24 25 23 29 20 27 18
Don’t have anyone to do it with 22 18 25 24 24 19 22 Not interested in any sports 20 19 22 11 14 26 26 I might feel uncomfortable or out of
place 14 14 13 8 16 14 15
Lack of transport/can’t easily get there
14 12 15 13 17 9 19
Don’t have enough information about what there is to do
13 12 14 15 12 14 11
Changing facilities are not good enough
9 12 6 11 7 4 13
Scared of getting injured 9 11 8 13 17 2 7
It costs too much 7 9 5 6 4 3 13
My health isn’t good enough 6 7 6 3 6 6 10
Other reason 14 14 14 9 16 10 20
Source: Ipsos MORI
4.17 Although not statistically significant because of the small base sizes involved, it is worth mentioning some other differences to emerge from analysis of how opinions vary across different factors:
• 14 and 15 year olds are particularly likely to say they are not interested in any sports (both 26%);
INSIDE SCHOOL
Exercise in school – PE classes
4.18 Scotland has been dubbed the ‘sick man of Europe’ and the amount of physical exercise undertaken by young people has received increasing interest in recent years, as concerns over obesity among young people and the general population have grown5. The Physical Education Review Group published a report in June 20046 which looked at how Scottish schools could be supported to improve the PE curriculum. It looked at enhancing and increasing participation in PE and also young people’s performance in PE, encouraging children to reach their full potential and maintain an interest in physical exercise beyond school.
4.19 In response to the report the then Scottish Executive gave a number of commitments on PE aimed at increasing the amount of time allocated to PE in the school curriculum and improving the range of activities on offer in schools, as well as providing extra PE teachers. One of the Review Group’s recommendations was that schools should work towards providing 2 hours of good quality PE for each pupil every week.
4.20 It would appear to be a positive finding, therefore, that young people tend to spend an average of 2.5 hours in PE classes every week. As Table 4.5 below illustrates, boys reportedly spend around 20 minutes more in PE classes than girls (162 minutes vs. 139 minutes), whilst S3 pupils and S4 pupils tend to do 20-30 minutes more than their peers in S1 and S2.
5 For example the journal Future of Children gave over an entire edition to the issue of childhood
obesity (Future of Children, Vol 16 No 1 Spring 2006, pp1-224)
Table 4.5: Amount of time spent in PE classes in school
Q – In a typical school week, how much time in total do you spend taking part in PE classes in school?
Base: 1,762 11-15 year olds
%
Gender Year group
All M F S1 S2 S3 S4
None 1 2 1 0 1 3 1
Up to 59 minutes 6 6 6 5 2 7 11
1 hour – 1 hour 59 minutes 45 41 48 59 57 33 30
2 hours – 2 hours 59 minutes 28 26 31 30 32 25 27
3 hours – 3 hours 59 minutes 5 7 4 3 3 6 10
4 hours – 4 hours 59 minutes 6 8 4 * 1 14 9
5 hours – 5 hours 59 minutes 4 6 3 0 1 7 9
6 hours or more 3 4 2 3 2 5 2
Not stated 1 1 1 * 0 1 2
Mean (minutes) 151 162 139 136 139 166 164
Source: Ipsos MORI
Figure 4.3: Mean number of minutes spent taking part in PE classes in school in a typical week
Source: Ipsos MORI
203 181
129
137 137 134
153 136
12 yr olds 13 yr olds 14 yr olds 15 yr olds
Base: All respondents aged 12-15 (1,759)
Girls Boys
Exercise in school (but outside of PE classes)
4.22 Young people reportedly spend an average of 1 hour 17 minutes doing some form of sport or physical recreation organised through their school, but outside of PE classes, every week. This would include activities done as part of a school team or club or in a competition.
4.23 Significantly, more than a third of young people (35%) do not do any physical activity organised through the school, with 14 year olds (38%) and 15 year olds (39%) least likely to do so.
Table 4.6: Amount of time spent doing physical activity organised through school, but outside of PE class time
Q – In a typical week, how much time in total do you spend taking part in any sport or physical recreation organised through your school, though not in PE classes?
Base: 1,762 11-15 year olds
%
Gender Year group
All M F S1 S2 S3 S4
None 35 33 37 28 36 37 39
Up to 59 minutes 4 3 4 4 4 3 2
1 hour – 1 hour 59 minutes 14 14 15 20 10 15 13
2 hours – 2 hours 59 minutes 11 11 11 12 10 11 11
3 hours – 3 hours 59 minutes 6 6 6 4 6 4 8
4 hours – 4 hours 59 minutes 5 7 3 5 6 5 3
5 hours – 5 hours 59 minutes 3 5 1 3 3 3 2
6 hours or more 8 10 6 9 7 10 6
Not stated 14 12 17 15 17 11 14
Mean (minutes) 137 158 115 152 149 128 118
Source: Ipsos MORI
Figure 4.4: Mean number of minutes spent taking part in physical activity organised through school but outside of PE classes in a typical week
Source: Ipsos MORI
129 158
174 172
103 91
151 128
12 yr olds 13 yr olds 14 yr olds 15 yr olds
Base: All respondents aged 12-15 (1,759)
CHAPTER 5: VOLUNTEERING
5.1 The Scottish Executive placed young people at the heart of its 2004 Volunteering Strategy,9 through the development of a unique new national programme entitled Project Scotland. This was to be underpinned by a renewed emphasis on dismantling the barriers to volunteering; to securing the long-term supply of volunteers; and to improving their everyday volunteering experience.
5.2 As the strategy asserts, the problems of encouraging volunteering by young people are often analogous to those faced by other excluded groups. For example, feelings of not being welcome and lack of confidence on the part of the young people, and perceiving young people as a problem or lacking in skills on the part of some volunteer involvers. Indeed, research carried out by NFO System 310 in 2004 on behalf of Volunteer Development Scotland, found that there were a number of barriers to volunteering, including perceived lack of time; negative peer pressure; lack of confidence; cost and lack of readily available information. According to the NFO research, young people, along with people from lower socio-economic groups, were most likely to believe that volunteering would leave them out of pocket.
5.3 That said, high numbers expressed an interest, with 72% of 11-15 year olds wanting to volunteer, motivated by the opportunity to see the positive impact of their actions; to work with others; and to gain respect and satisfaction through their achievements. Importantly, the NFO research indicated that people who volunteer when they are young also tend to volunteer when they are older – hence the importance of encouraging and enabling school age children to volunteer. However, the research also found significant differences among economic groups: by the time they begin working, over 40% of the higher economic groups (groups A and B) have volunteered, but only 10% of those in socio-economic groups (groups D and E) have done so.
5.4 Our survey found that around a third of young people (32%) have given up their time for volunteering in the last 12 months, with 12 year old (40%) and 14 year old girls (38%) most likely to have done so, along with those living in a rural area (42%, compared with 28% of urban dwellers). Fifteen year old boys and girls (59% and 60% respectively) are least likely to have volunteered in the last year.
Table 5.1: Types of volunteering activity undertaken
Q – If you have done volunteering during the last 12 months, was this connected to any of the following areas?
Base: 1,762 11-15 year olds
%
Gender Age
All M F 12 13 14 15 Helping at sports (e.g. raising
money, organising events,
coaching, refereeing, score keeping etc)
39 49 32 43 50 31 35
Helping with art, music, signing or a drama group (e.g. painting scenery, teaching singing etc)
20 13 26 22 14 21 23
Helping at a library 4 4 4 9 6 2 *
Helping at museums/galleries 1 2 * 1 0 1 2
None of these 40 37 43 37 34 46 41
Source: Ipsos MORI
CHAPTER 6: CONCLUSIONS
Improving participation in cultural activities
6.2 Tackling the barriers which prevent young people from taking part in cultural activities and events will be key to encouraging usage of services and increasing participation.
6.3 Among those not taking part in cultural/artistic activities outside of school, a general lack of interest and preferring to do other things in their spare time are primary factors in non-participation. Whilst it can be accepted that not all young people will be interested in using services and taking part in activities in their own time, increasing their awareness of the opportunities available to them and addressing some of the perceived barriers to participation, such as cost, lack of information and concerns about feeling out of place, may go some way to improving activity levels.
6.4 Girls tend to participate in a greater range and number of artistic activities during school time than boys and are also more likely to have been to events as part of a school trip. While many of the motivations young people have for participating in such activities will be personal and emotional, and will vary according to age, analysis also shows that the area where the young person lives and the socio-economic status of their household may have some bearing. Those living in the least deprived areas of the country are 1.5 times more likely to have done a number of the activities listed in the survey during school time than those living in the most deprived areas. And young people living in a household where at least one parent works are significantly more likely to have been to a number of events than those with no parent working. It will, therefore, be essential to ensure that young people from more deprived backgrounds do not miss out on the opportunities available to them and that efforts are made to encourage these youngsters to participate wherever possible.
Improving participation in sports activities
6.5 One of the positive findings from this survey is that older children appear to spend just as much time, if not more, in PE classes as their younger peers, and it will be important to continue to encourage the participation of all young people in PE classes for their duration at school. Our research did, however, find a drop off in participation as young people progress through their teenage years, for both extra curricular, school based activities and physical recreation outside of school time.
6.6 While it may be argued that older children are less likely to want to engage with Overall
towards tackling concerns about perceived cost, standard of changing facilities and not having anyone to participate with.
APPENDIX A: GUIDE TO STATISTICAL RELIABILITY
The young people who took part in the survey are only a sample of the total secondary school population in Scotland, and as such, we cannot be certain that the figures obtained are exactly those we would have if everybody had been interviewed (the ‘true’ values). For a random probability survey we can, however, predict the variation between the sample results and the ‘true’ values from a knowledge of the size of the samples on which the results are based and the number of times that a particular answer is given. The confidence with which we can make this prediction is usually chosen to be 95% - that is, the chances are 95 in 100 that the "true" value will fall within a specified range. The survey reported on here was not a random probability survey, being limited to a sample of school pupils across the country. However, for information only, the table below illustrates the predicted ranges for different sample sizes and percentage results at the 95% confidence interval:
Approximate sampling tolerances applicable to percentages at or near to
these levels
Actual
Sample Size 10% or 90% + 30% or 70% + 50% +
Overall 1,762 1.4 2.1 2.3*
*For example, if 50% of all young people were to give a particular answer, the chances are 19 in 20 that the ‘true’ value will fall within the range of +2.3 percentage points from the sample results.
Comparing percentages between sub-groups and overall total
When results are compared between separate groups within a sample, different results may be obtained. The difference may be ‘real’, or it may occur by chance (because not everyone completed a questionnaire). To test if the difference is a real one – i.e. if it is statistically significant – we again have to know the size of the samples, the percentages giving a certain answer and the degree of confidence chosen. If we assume 95% confidence interval, the difference between two sample results must be greater than the values given in the table below:
Actual Sample Size 10% or 90%
+ 30% or 70% + 50% + Overall (1,762)vs:
Sub-groups of: 200 4.4 6.7 7.3
500 3.0 4.6 5.0
*For example, if 50% of the total sample (1,762) gives a particular answer, and 53% of young people in a sub-group of 500 give the same answer, there is not a statistically significant difference between the responses of the two groups.
Looking at the fifth column of the above table shows that there needs to be a difference of +5 percentage points between the two results in order for the difference to be statistically significant. Therefore, if 56% of the latter group give the same answer, then this is a statistically significant difference (since there is a 6 point difference between the two).
Comparing percentages between sub-groups
The following table indicates differences required for significant comparisons between sub-groups.
Approximate sampling tolerances applicable to percentages at or
near to these levels
10% or 90% +
30% or 70% +
50%
+
Size of samples compared:
100 and 100 8.4 12.8 13.9
100 and 250 7.0 10.7 11.6
250 and 250 5.3 8.0 8.8
500 and 250 4.6 7.0 7.6
500 and 500 3.7 5.7 6.2
APPENDIX B: SAMPLE PROFILE
Number Unweighted
% Weighted %
Total 1,762 100 100
Gender
Male 885 50 49
Female 872 49 50
Age
11 3 * *
12 559 32 23
13 342 19 25
14 553 31 26
15 305 17 26
Year group
S1 613 35 25
S2 325 18 25
S3 569 32 25
S4 248 14 24
S5 4 * *
Ethnic origin
White 1,668 95 96
Non-white 88 5 3
Health
Good 1,513 86 86
Not good 17 1 *
Household composition
Two parents in household 1273 72 73
Single parent in household 328 19 19
Sibling in household 1314 75 76
Home ownership
Owned outright or mortgaged 1201 68 70
Rent from Council/Housing Association 321 18 18
Rent other 87 5 4
Work status of household
Two parents work 849 48 50
One parent works 463 26 26
No parent works 311 18 16
Area
Urban 793 45 50
Small town 263 17 17
Rural 449 25 19
Area classification
Terraced blue collar 206 12 18
Younger blue collar 39 2 2
Older blue collar 92 5 5
Transient communities 22 1 2
Settled in the city 11 1 1
APPENDIX C: SCOTTISH INDEX OF MULTIPLE DEPRIVATION
(SIMD)
The Scottish Index of Multiple Deprivation (SIMD), constructed by the Scottish Executive is a ward-level Index based on 31 indicators in six separate ‘domains’ of deprivation:
• Income
• Employment
• Health Deprivation and Disability
• Education, Skills and Training
• Housing
• Geographical Access to Services.
In order to link individual’s responses to datazone level of indices of deprivation, postcode information was collected from respondents. This information provided a match for 99% of those who took part in the study.
The following steps were then taken:
1 Identify the deprivation score given to the datazone and its rank in comparison to the rest of the country
2 Identify which respondents fall into the top 10% of the most deprived areas of the country and the top 10% of the least deprived areas of the country
For the Schools Omnibus out of a sample of 1,762 pupils, 139 young people were judged to live in the top 10% most deprived areas in Scotland and 104 in the top 10% of the least deprived areas.
APPENDIX D: AREA CLASSIFICATIONS
The urban, small town and rural classifications used in this report are based on those produced by the Scottish Executive (2005-2006). Two main criteria are used to derive the classifications: settlement size as defined by the General Register Office for Scotland (GROS) and accessibility based on drive time analysis to differentiate between accessible and remote areas in Scotland. The settlements and accessibility data are then combined to create a Scotland wide classification.
Scottish Executive Urban Rural Classification
1 Large Urban
Areas Settlements of over 125,000 people.
2 Other Urban
Areas Settlements of 10,000 to 125,000 people.
3 Accessible Small Towns
Settlements of between 3,000 and 10,000 people and within 30 minutes drive of a settlement of 10,000 or more.
4 Remote Small Towns
Settlements of between 3,000 and 10,000 people and with a drive time of over 30 minutes to a settlement of 10,000 or more.
5 Accessible Rural Settlements of less than 3,000 people and within 30 minutes drive of a settlement of 10,000 or more.
6 Remote Rural Settlements of less than 3,000 people and with a drive time of over 30 minutes to a settlement of 10,000 or more.
ISSN 0950 2254
ISBN 978 0 7559 7172 5 (Web only publication)