The splashing morphology of liquid-liquid impacts
14
0
0
Full text
(2) CHAPTER 3 - SPLASHING MORPHOLOGY MAP 3.1 Introduction Two comprehensive drop splash maps have been compiled from the data of the high speed video experiments highlighted in Chapter 2. The first is a qualitative splash map shown in Figure 3.2 and details the observed splashing, the flow regimes in which each phenomena resides and the order in which events occur and influence each other. The second map is a quantitative splash map and provides numerical limits on the regimes in terms of Froude and Weber number and will be discussed further at the end of this chapter (Figure 3.49). Details pertaining to the image sequences in this chapter will be classified in 3.2 before the qualitative drop splash map is examined in 3.3.. 3.2 Image Sequence Details In this chapter, each impact shown in this chapter is broken into two separate image sequences. The first image sequence comes from the camera that is focused below the free surface. These images show phenomena such as cavity development, bubble entrapment and vortex ring formation. The second image sequence from the camera focused above the free surface captures phenomena such as jetting and crown formation. Both dyed and un-dyed drop impacts have been used to highlight as much flow behaviour as possible with the least number of image sequences. The un-dyed image sequences tend to be clearer and sharper and enable the reader to discern much finer detail. The dyed drop images, while not as sharp, provide details of the flow around the cavity. A grid system has been adopted to simplify the identification of images. Each row of images has been given a numerical designation (1, 2, 3…..) and each column has been given an alphabetic designation (A, B, C…..). Each image can be uniquely identified by using a combination of the figure label and grid position (e.g. Figure 3.3(4C)). Images within a row are identified by using one number and a hyphenated letter range (e.g. Figure 3.3(4A-C)) and vice versa for a column (e.g. Figure 3.3(1-4C)). The top of every image also contains information pertaining to the needle size, study number, release height and frame number (Figure 3.1). Zero time is considered to be the point when the drop first makes contact with the liquid surface. If the reader wishes to conduct any - 81 -.
(3) analysis on these images, they should use the Froude and Weber numbers as a basis for velocity information, not the release height.. Study Number. Frame Number. Release Height. Needle Size Figure 3.1 Information contained in each image. Table 3.1 provides a summary of the parameters and dimensionless quantities associated with the image sequences shown in this chapter.. Table 3.1 Impact numbers and corresponding dimensionless numbers Impact Sequence Number Name I 26g-01-20. Drop Size (D) (mm) 2.59. Drop Velocity (U) (m/s) 1.02. Froude Number 41. Weber Number 36. Reynolds Number 2341. tc (D/U) (ms) 2.54. II. 26g-04-40. 2.60. 1.16. 53. 48. 2692. 2.24. III. 26g-04-60. 2.63. 1.32. 67. 62. 3082. 1.99. IV. 26g-04-70. 2.57. 1.39. 76. 67. 3178. 1.85. V. 26g-01-80. 2.63. 1.46. 83. 77. 3425. 1.80. VI. 26g-01-100. 2.62. 1.58. 97. 90. 3697. 1.66. VII. 26g-01-120. 2.62. 1.69. 111. 102. 3928. 1.55. VIII. 26g-01-140. 2.63. 1.79. 125. 116. 4199. 1.47. IX. 26g-04-160. 2.61. 1.88. 138. 127. 4380. 1.39. X. 26g-01-200. 2.57. 2.08. 170. 151. 4751. 1.24. XI. 26g-04-210. 2.60. 2.11. 174. 158. 4891. 1.23. XII. 26g-04-220. 2.57. 2.14. 182. 161. 4899. 1.20. XIII. 26g-01-260. 2.57. 2.31. 211. 187. 5279. 1.11. XIV. 26g-04-300. 2.57. 2.43. 235. 207. 5797. 1.06. XV. 26g-01-360. 2.65. 2.67. 275. 258. 6294. 0.99. XVI. 26g-01-640. 2.58. 3.39. 454. 403. 7768. 0.76. - 82 -.
(4) 3.3 Qualitative Splash Map. Figure 3.2 Drop plash map showing all of the flow features and regimes found in liquid-liquid impacts. - 83 -.
(5) 3.3.1. Flow regimes. The first point to note about the qualitative drop splash map (Figure 3.2) is that it is broken into six different flow regimes rather than the three regimes used in the drop splash map discussed in chapter 1 (Figure 1.1). These regimes are:. New Regime Name Total coalescence. Old Regime Name Total coalescence. Primary microbubble formation regime. Composed. Primary vortex ring regime Pre-entrapment jetting regime Primary bubble entrapment regime. Limiting Conditions Oh < 1 We < 20. Primary bubble entrapment regime. Post-Entrapment jetting regime. Thick Jet. The first regime is the so called total coalescence regime and is characterised by very small drops that coalescence without producing any secondary drops or entrapping any bubbles. This regime has been previously described and is Oh number limited. A major change to the classification of the flow regimes involves the splitting of the composed regime into two separate regimes. The composed is split into the primary microbubble formation regime and primary vortex ring regime. In the primary microbubble formation regime an air film becomes entrapped between the impacting drop and the pool which initially prevents coalescence. When the film ruptures numerous microbubbles are formed. This is where the coalescence cascade and Mesler type bubble entrapment occur. The second regime that makes up the old composed regime is the primary vortex ring regime. Here large coherent vortex rings are formed without any significant bubble entrapment or jetting. The next flow regime is a new flow regime dubbed the pre-entrapment jetting regime. This regime occurs just before the primary bubble entrapment regime and is characterised by jets that form as a result of the cavity collapse. However, there is no large bubble entrapment like in the primary bubble entrapment regime, nor is there any large vortex ring formation like in the primary vortex ring regime. Thus, this region becomes distinctly unique to all other regimes. Following the pre-entrapment jetting regime is the so called primary bubble entrapment regime. This regime is already well. - 84 -.
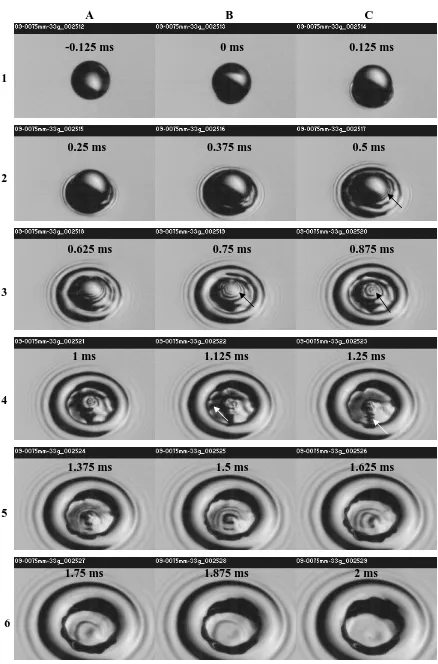
(6) documented and is where large air bubbles are entrapped during cavity collapse. Highspeed jets are also formed in this regime. Finally, the post-entrapment regime is characterised by large cavity formation that collapse to form thick slow moving central jets. The primary vortex ring regime will be discussed first as drops falling in the total coalescence and primary microbubble formation regime are difficult to form from needle pinch off. The lowest velocity original drops formed from needle pinch off in this study fall into the primary vortex ring regime and not the total coalescence or primary microbubble regime. Drops falling in the total coalescence regime and primary microbubble entrapment regime could only be produced from the break up of the central jets in the higher flow regimes and will be discussed later in this chapter.. 3.4 Primary vortex ring regime The formation of large vortex rings with high rotational velocities and a distinct toroidal shape (Impact II) is the distinguishing feature of this regime. The first flow feature worthy of discussion in this regime is the capillary waves that are formed shortly after impact. In the above surface images for Impact I, approximately 0.7 ms after impact (Figure 3.5 (B2)) a series of capillary waves propagate up the impacting drop. These waves converge at the top of the drop approximately 0.6 ms later. Assuming the waves travel up half the drop diameter over this time period, this would put their speed at approximately 2 m/s. Therefore, it possible at these low impact velocities the capillary waves can converge at the top of the drop to pinch off a small secondary drop as postulated by Liow (2001) before the drop has coalesced. However, no secondary drop formation due to the converging capillary waves at the top of the drop has ever been seen in this study. The drop vanishes from view in Figure 3.7 (D2) approximately one normalised time after initial impact which is almost equal to the time it took for the cavity to first appear. The behaviour of these capillary waves can be better visualised by looking down the cavity (Figure 3.8). The drop size used in Figure 3.8 is slightly different to Impact I and II but the impact still resides in the primary vortex ring regime. In Figure 3.8 (C2) the capillary waves become visible. The waves converge at the top of the drop in Figure 3.8 (C3) and are then reflected back inducing a complex series of capillary waves on the cavity’s interface. This results in the initial cavity shape being highly asymmetrical as it expands (Figure 3.3 (A2)) and suggests that capillary driven disturbances have a strong influence over early cavity development. - 85 -.
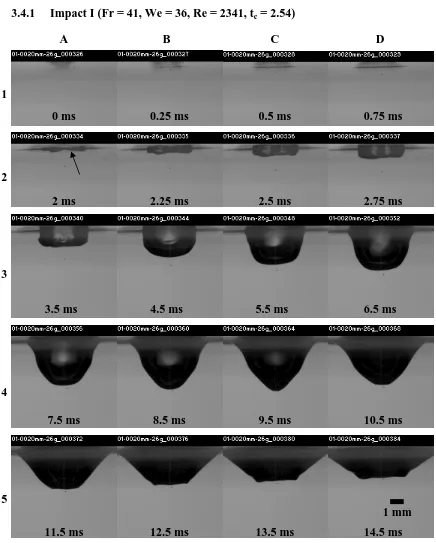
(7) 3.4.1. Impact I (Fr = 41, We = 36, Re = 2341, tc = 2.54) A. B. C. D. 0 ms. 0.25 ms. 0.5 ms. 0.75 ms. 2 ms. 2.25 ms. 2.5 ms. 2.75 ms. 3.5 ms. 4.5 ms. 5.5 ms. 6.5 ms. 7.5 ms. 8.5 ms. 9.5 ms. 10.5 ms. 1. 2. 3. 4. 5 1 mm 11.5 ms. 12.5 ms. 13.5 ms. 14.5 ms. Figure 3.3 Below surface images for Impact I (Fr = 41, We = 36, Re = 2341, tc = 2.54 )(4000 FPS). Figure 3.4 Larger view of the bubble formed below the cavity (A1-C1). - 86 -.
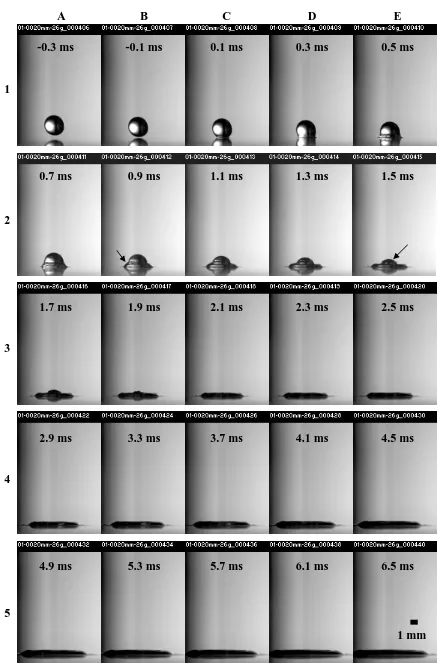
(8) A. B. C. D. E. -0.3 ms. -0.1 ms. 0.1 ms. 0.3 ms. 0.5 ms. 0.7 ms. 0.9 ms. 1.1 ms. 1.3 ms. 1.5 ms. 1.7 ms. 1.9 ms. 2.1 ms. 2.3 ms. 2.5 ms. 2.9 ms. 3.3 ms. 3.7 ms. 4.1 ms. 4.5 ms. 4.9 ms. 5.3 ms. 5.7 ms. 6.1 ms. 6.5 ms. 1. 2. 3. 4. 5 1 mm. Figure 3.5 Above surface images for Impact I (Fr = 41, We = 36, Re = 2341, tc = 2.54 ) (5000 FPS). - 87 -.
(9) 3.4.2. Impact II (Fr = 53, We = 48, Re = 2692, tc = 2.24) A. B. C. D. 1 0.2 ms. 0.87 ms. 1.53 ms. 1.87 ms. 2.2 ms. 2.53 ms. 2.87 ms. 3.2 ms. 3.53 ms. 3.87 ms. 4.2 ms. 4.53 ms. 4.87 ms. 5.53 ms. 6.2 ms. 6.87 ms. 7.53 ms. 8.2 ms. 8.86 ms. 9.53 ms. 10.2 ms. 10.5 ms. 10.9 ms. 11.5 ms. 12.2 ms. 12.9 ms. 14.5 ms. 16.2 ms. 27.9 ms. 33.9 ms. 37.9 ms. 51.2 ms. 2. 3. 4. 5. 6. 7. 8. 1 mm Figure 3.6 Below surface images for Impact II (Fr = 53, We = 48, Re = 2692, tc = 2.24) (3000 FPS). - 88 -.
(10) A. B. C. D. E. -0.2 ms. 0 ms. 0.2 ms. 0.4 ms. 0.6 ms. 0.8 ms. 1 ms. 1.6 ms. 1.8 ms. 2 ms. 2.4 ms. 3.8 ms. 5.2 ms. 6.6 ms. 8 ms. 9.4 ms. 10.8 ms. 12.2 ms. 13.6 ms. 15 ms. 23.4 ms. 24.8 ms. 26.2 ms. 27.6 ms. 29 ms. 1. 2. 3. 4. 5 1 mm. Figure 3.7 Above surface images for Impact II (Fr = 53, We = 48, Re = 2692, tc = 2.24) (5000 FPS). - 89 -.
(11) A. B. C. -0.125 ms. 0 ms. 0.125 ms. 0.25 ms. 0.375 ms. 0.5 ms. 0.625 ms. 0.75 ms. 0.875 ms. 1. 2. 3. 1 ms. 1.125 ms. 1.25 ms. 4. 1.375 ms. 1.5 ms. 1.625 ms. 5. 1.75 ms. 1.875 ms. 2 ms. 6. Figure 3.8 Down cavity image sequence for a drop falling in the primary vortex ring regime at 8000 FPS (Estimated parameters We = 60, Fr = 106, Re = 2684, tc = 1.41) 1 mm. - 90 -.
(12) 3.4.3. Vortex ring development. Examining Impact II, as the drop coalesces, the dyed fluid from the impacting drop begins to permeate the pool Figure 3.6 (B1). The dyed fluid assumes a semi-circular shape before any cavity formation is observed (Figure 3.6 (C1)). The cavity does not begin to appear until Figure 3.6 (A2) which is approximately one normalised time after impact. The first sign of any circulatory motion in the dyed fluid occurs in Figure 3.6 (B2). This is best visualised in image sequence shown in Figure 3.9 which is a larger view of frames 255-261 from Figure 3.6. Initially the cavity has a pronounced cylindrical shape Figure 3.9 (A). The base of the cavity begins to flare outward in Figure 3.9 (B). The dyed fluid around the base of the cavity begins to exhibit a rotational motion in Figure 3.9 (C-D). A distinct vortex core becomes visible in Figure 3.9 (E-F) near the sharp edges of the cavity which is located near the mid point of the cavity. From Figure 3.9 (G) onward the sides of the cavity begin to expand outward and the sharp edges smooth out. The rotating fluid travels down the side of the cavity until converging at the base. The cavity beings to retract in Figure 3.6 (D6), 11.5 ms after initial impact, where the rotating dyed fluid is shed from the cavity and collects into a coherent vortex ring Figure 3.6 (C7). In this thesis, the term coherent is used to describe a vortex ring that maintains a distinct toroidal structure over its time in view. The vortex ring travels downward while maintaining a constant diameter for the rest of the image sequence. The quandary of why strong coherent vortex rings should form in this regime and no others has still not been resolved here. According to theory (Batchelor 1967) vorticity should be created in every impact due to the velocity gradients generated at the interface. However, providing experimental evidence of the vorticity development at the interface is virtually impossible. The only visual clue to the presence of vorticity is the vortex cores that are formed at the sides of the cavity during expansion. Thus, the important question becomes how does the vorticity manifest itself into vortex rings in this regime and no other? What appears to be one of the keys is how the cavity initially develops and how the sharp edge at the side of the cavity form. This effect can also be seen in the numerical simulations of Morton et al. (2000) where the vortex cores form around these sharp edges as well. No conclusive explanation on how or why these sharp edges form and how they promote the vorticity to collect into vortex rings is given here. Rather the evidence presented here has identified a behaviour that needs to be investigated further.. - 91 -.
(13) 2.2 ms. A. 2.53 ms. B 2.87 ms. C 3.2 ms. D 3.53 ms. E 3.87 ms. F 4.2 ms. 1 mm G Figure 3.9 Image sequence of the initial vortex ring development (Frames 255-261) from Figure 3.6. - 92 -.
(14) 3.4.4. Bubble formation. Another interesting feature observed in this regime is the formation of small bubbles almost immediately after impact has been made (Figure 3.4). These bubbles are similar to the bubbles reported by Thoroddsen et al. (2003). In Impact I only one bubble forms after impact (72 µm in diameter) while two form in Impact II (both approx. 100 µm in diameter). The time scale for the formation of these bubbles is less than one frame or <333 µs. This is in the region of the time scale reported by Thoroddsen (<50 µs), which indicates that these bubbles are formed by the same mechanism. A small air disk becomes entrapped between the two liquid surface and rapidly breaks up in the first moments of impact to produce one or two bubbles. The bubbles themselves propagate straight ahead of the expanding cavity. These bubbles do not appear to undergo any rotational motion or any sideways movement, which one would expect to see if the vorticity created during initial impact was of any significant strength. Therefore, it can be postulated that the vorticity created during initial contact is weak and is not likely to be the main driving mechanism for vortex ring formation. In general, the bubbles are drawn into the cavities wake and pulled upward as the cavity retracts and are not transported downward by the vortex ring. The Thoroddsen bubbles were observed ahead of the expanding cavity were observed for all impacts in the primary vortex ring formation regime and for all subsequent higher impact velocity regimes. In the primary microbubble formation regime and total coalescence regime, no Thoroddsen bubbles are observed. Thus, the appearance of the Thoroddsen bubbles appear to be linked to the appearance of strong coherent vortex rings. This can be attributed to the effects the entrapped air film has on cavity development. In the primary microbubble entrapment regime which will be described later and in Chapter 6, the entrapped air film is so large that it initially prevents coalescence. This in turn alters how the cavity develops and prevents the formation of the sharp edges on the sides of the cavity which were shown in Figure 3.9 to be the location where significant vorticity is generated. Thus, the observation of Thoroddsen bubbles implies that there is potential for vortex ring formation.. - 93 -.
(15)
Figure


+5


Related documents
Johansson, “Underreporting of Energy Intake in Repeated 24-Hour Recalls Related to Gender, Age, Weight Status, Day of Interview, Educational Level, Reported Food Intake,
Because Wnt3a is required for oscillating Notch signaling activity in the PSM (Aulehla et al., 2003), the expression of Wnt3a in Sfrp1 –/– ;Sfrp2 –/– embryos was examined
The cycle index of dihedral and cyclic groups acting on both ordered and unordered pairs and triples has also been done, but cycle index of cyclic and dihedral groups acting on
The most important aim of this research is trying to propose a method to remove new user cold start and scalability from recommendation system by utilizing clustering
Mouse and Human Monoclonal Antibodies Protect against Infection by Multiple Genotypes of Japanese Encephalitis Virus.. Estefania Fernandez, a Nurgun Kose, b,c
The criteria used to invite the teachers to participate in the study were the following: (1) to be a graduate from a foreign language teaching program; (2) to be teaching
- The most common malignancy in solitary nodule thyroid is papillary carcinoma (67%),. followed by
Therefore the main objective of this study was to investigate the application of E-nose and FTIR techniques to differentiate freshly squeezed orange juices and the ones
