You can download this publication at: www.education.gov.uk
or order copies online at: www.teachernet.gov.uk/publications
Search using the ref: DFE-RTP-10-001
Copies of this publication can also be obtained from: Department for Education Publications
PO Box 5050 Sherwood Park Annesley
Nottingham NG15 0DJ Tel: 0845 60 222 60 Fax: 0845 60 333 60 Textphone: 0845 60 555 60
Please quote the ref: DFE-RTP-10-001 ISBN: 978-1-84775-754-8
© Crown Copyright 2010
The text in this document (excluding the Royal Arms and other departmental or agency logos) may be reproduced free of charge in any format or medium providing it is reproduced accurately and not used in a misleading context. The material must be acknowledged as Crown copyright and the title of the document specified. Where we have identified any third party copyright material you will need to obtain permission from the copyright holders concerned.
For any other use of this material please contact the Office of Public Sector Information, Information Policy Team, Kew, Richmond, Surrey TW9 4DU or e-mail: [email protected].
PRINERGY 3
Staff
Topic Paper
Tara Whitehorn,
Schools Analysis and Research
Division, Department for
Contents
Chapter One: Introduction and Policy Context 04
1.1 Introduction 04
1.2 Policy context 04
1.2.1 The National Agreement and School Workforce Remodelling 04
1.2.2 The Children’s Plan: Building brighter futures 06
1.2.3 Your child, your schools, our future: building a 21st century
schools system 06
1.2.4 Lamb inquiry: Special Educational Needs and Parental Confidence 06
Chapter Two: Roles, Numbers and Characteristics 07
2.1 Summary 07
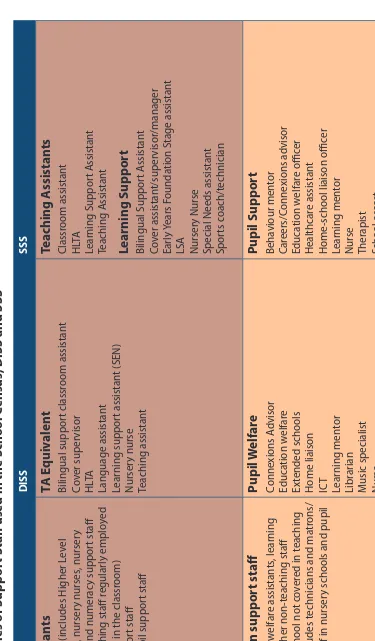
2.2 Categories of support staff used in research and statistics 08
2.3 Numbers of support staff 12
2.3.1 How many support staff are there and where do they work? 12
2.3.2 Higher Level Teaching Assistants 18
2.4 Spend on support staff 19
2.5 Characteristics of support staff 23
2.5.1 Demographics 23
2.5.2 Qualifications 24
2.5.3 Maths and English qualifications 26
2.5.4 Experience 28
2.6 Contractual arrangements 29
2.6.1 Contract types 29
2.6.2 Hours worked 29
2.6.3 Wages 31
Chapter Three: Impact of Support Staff 37
3.1 Summary 37
3.2 Introduction 38
3.3 Impact on teachers 38
3.3.1 Impact on teachers’ workload 38
3.3.2 Impact on teachers’ job satisfaction 41
3.3.3 Impact on teachers’ stress levels 42
3.3.4 Impact on teaching 44
3.4 Impact on pupils 45
3.4.1 Impact on attitudes to learning and behaviour 45
3.4.2 Impact on academic progress 49
3.4.3 Discussion 52
Chapter Four: Support Staff in Practice 53
4.1 Summary 53
4.2 Introduction 54
4.3 Strategic deployment 54
4.3.1 School ethos and culture 54
4.3.2 Supporting teachers, pupils or the school? 57
4.3.3 How are decisions about deployment made? 59
4.3.4 Recruitment 60
4.4 Classroom deployment 60
4.4.1 HLTAs 63
4.5 Communication between teachers and support staff 66
4.6 Training for teachers to work with support staff 67
4.7 Pedagogical and subject knowledge of support staff 68
Chapter Five: Continuing Professional Development,
retention and job satisfaction 71
5.1 Summary 71
5.2 Introduction 72
5.3 Performance management 72
5.3.1 Job descriptions 73
5.3.2 Line management arrangements 74
5.4 Training and development 75
5.4.1 Responsibility for Continuing Professional Development (CPD) 75
5.4.2 Motivations for training 77
5.4.3 Identifying and meeting training and development needs 77
5.4.4 Amount of training and development received 80
5.4.5 Impact of training and development 83
5.4.6 Barriers to training 85
5.5 Vacancies and turnover 85
5.6 Job satisfaction 86
Annex A: Wages of support staff by post title from wave three DISS 91
Annex B: Summary of effects of amount of additional support on
PAL measures (from DISS) 93
Annex C: The size of the impact of support staff on attainment (from DISS) 94
Annex D: Methodological Overview of studies 96
Chapter One: Introduction and Policy Context
1.1 Introduction
This topic paper presents the latest statistics and research on school support staff. Topics covered include: details of the numbers and characteristics of support staff, the impact of receiving additional support on pupils’ attitudes to learning and academic progress, the deployment of support staff, and the training and development of support staff.
1.2 Policy context
2009 saw the publication by the Department1 of several large-scale studies of
support staff. The Deployment and Impact of Support Staff in Schools study (DISS) was commissioned by the Department in 2003 with the aim of gathering information on the deployment, characteristics and impact of support staff. The Aspects of Workforce Remodelling research aimed to explore the strategies that schools were using to implement the changes as a result of the 2003 National Agreement. The Training and Development Agency for Schools (TDA) and Ofsted have also recently published research in this area.
The Department felt it was important to draw all the research together into one coherent report on support staff in order to inform the debate about the future role and likely impacts of support staff.
This next section presents an overview of the recent policy developments which have affected the numbers of support staff in schools and the roles that they play.
1.2.1 The National Agreement and School Workforce Remodelling
The 2003 National Agreement between Government, employers and school workforce unions was designed to support schools in raising standards and tackling workload issues through workforce reforms. The agreement was borne out of concerns over excessive workloads, confirmed by research (PricewaterhouseCoopers, 2001) which found that two thirds of teacher time was spent on activities other than teaching. The agreement includes a seven point plan:
a. Progressive reductions in teachers’ overall hours b. Changes to teachers’ contracts to ensure all teachers: i. Do not routinely undertake admin/clerical tasks ii. Have a reasonable worklife balance
iii. Have a reduced burden of providing cover
iv. Have guaranteed planning, preparation and assessment (PPA) time within the school day
v. Have a reasonable allocation of time in support of leadership/ management responsibilities and (for heads only) the strategic leadership of their schools
vi. Are not expected to invigilate external exams
c. Reductions in unnecessary paperwork and bureaucracy
d. Reform of support staff roles to help teachers and support pupils e. Recruitment of new managers (including business and personnel
managers) to contribute to school business teams
f. Additional resources and national “change management” programme to help schools achieve the necessary reforms
g. Monitoring of progress by the signatories to the Agreement.
The Agreement recognised the impact that it would have on support staff, who would be increasingly recognised for the contribution they make to raising standards and stated that they would have increased choices and career
development opportunities.
The change management programme introduced in order to help schools implement the reforms of the National Agreement is commonly referred to as school workforce remodelling. The Workforce Agreement Monitoring Group (WAMG) play a critical role in ensuring implementation of remodelling, supported by the TDA. WAMG, otherwise known as The Social Partnership (www.socialpartnership.org) is a group of 11 organisations representing employers, government and school workforce unions.
As part of the remodelling agenda the National Remodelling Team (NRT) was established in 2003 – the work of the NRT is now embedded within the work of the TDA. Their role was to work with local authorities to support schools in managing change, implementing the contractual changes from the National Agreement and in the wider workforce remodelling. Local authorities recruited Remodelling Advisors and Remodelling Consultants to support schools through this process.
New support staff roles and status have been introduced as a result of remodelling:
•
Enhanced roles for those achieving Higher Level Teaching Assistant (HLTA)status
•
Creation of cover supervisor and invigilator roles•
Support staff also now have roles in for example, attendance monitoring,1.2.2 The Children’s Plan: Building brighter futures
In December 2007 the Department published the Children’s Plan which outlined plans to make England “the best place in the world for children and young people to grow up”. Whilst recognising the impact of the expanded school workforce on teaching and learning, the Children’s Plan outlined the need for schools to fully exploit the potential of this wider workforce. The Department committed to asking the TDA to work with the National College for Leadership of Schools and Children’s Services (formerly National College of School Leadership and commonly referred to as the National College) to refresh their development strategy to ensure it takes into account the increasingly diverse range of support staff working in schools. The Plan also committed to creating a new negotiating body (the School Support Staff Negotiating Body, SSSNB) which would ensure that support staff were fairly rewarded for their work by developing a national framework for pay and conditions.
1.2.3 Your child, your schools, our future: building a 21st century schools system
The commitments outlined in the Children’s Plan were further developed in the 2009 Schools White Paper. This document also recognises the important role that support staff have played to date in improving children’s lives but acknowledges that more work is needed to ensure effective deployment and development of all support staff so that they are all contributing effectively to the delivery of high quality personalised learning. The White Paper outlined a series of commitments to improve the skill-base and deployment of support staff
(DfE, 2009a).
1.2.4 Lamb inquiry: Special Educational Needs and Parental Confidence
Chapter Two: Roles, Numbers and Characteristics
2.1 Summary
Numbers
•
The number of support staff in schools has increased from 134,000 in1997 to 346,000 in 2009. Teaching assistants make up the largest group of support staff (181,600 in 2009).
•
Around half of all support staff are working in primary schools anda third are working in secondary schools. This proportion varies by category of support staff. Around 70% of teaching assistants work in primary schools but around 90% of technicians and almost 70% of other admin or clerical staff work in secondary schools.
•
The pupil: teaching assistant (TA) ratio is smaller in primary schoolsthan in secondary schools. In 2009 there were, on average, 33.5 pupils for each TA in primary schools, compared to 80.1 pupils for each TA in secondary schools. The special school ratio is a lot smaller than in primary or secondary at 4 pupils per TA in 2009.
•
Data from DISS shows that the majority of schools (over two thirds) havemore than 20 members of support staff. Special schools and secondary schools tend to employ greater numbers of support staff than primary schools. Over half of the secondary schools in the DISS sample employed 61 or more support staff members. As well as school type, the number of FTE pupils and % FSM, EAL and SEN pupils all influence the number of support staff employed in a school.
Spend on support staff (in real terms)
•
In 2008/09 schools spent £4.1bn on education support staff and £3.1bnon non-education support staff. Spend on support staff, both in real terms and as a proportion of schools’ total expenditure has increased since 2002-03, especially for education support staff.
•
Schools vary greatly in the amount that they spend on educationsupport staff in relation to the amount spent on teachers.
•
Schools with higher proportions of pupils eligible for free school mealsCharacteristics
•
Support staff are overwhelmingly white, female and aged 35 or over.•
Between a quarter and a fifth of support staff are qualified up to A/ASLevel and more than one in ten have a degree. Around a tenth have no qualifications. This varies by support staff category. Site and facilities staff tend to be less well qualified than other support staff groups and specialist and technical staff tend to be better qualified. In addition, support staff in secondary and special schools were more highly qualified than those in primary schools.
•
Most support staff are not required to have specific qualifications orexperience for their post and the majority of support staff had not been working in education prior to taking on their current role.
•
The majority of support staff are employed on permanentterm-time-only contracts.
•
Support staff appear to work a range of hours. In one study there wasan equal split between full-time and part-time workers; in DISS a fifth worked 35 hours or more (classed as full-time). The average hours worked per week was 21.7 in wave 3.
•
Support staff in secondary schools worked longer hours than those inprimary schools, and site staff, admin staff and pupil welfare staff worked longer hours than other groups.
•
A third of staff would like to work more hours. A fifth of staff were requiredto work extra hours and two thirds worked extra hours voluntarily.
•
The average hourly wage for support staff is £9.71 although this is higherfor staff in secondary schools and for certain groups of support staff (notably pupil welfare staff, admin staff and technicians. Overall, less than half of support staff are satisfied with their pay.
2.2 Categories of support staff used in research and statistics
Scho ol C ensus DISS SSS Technicians Includes: labor at or y assistan ts , desig n t echnology assistan ts , home ec onomics and cr af t t echnicians and IT technicians but e xcludes technicians in nurser y schools and pupil ref er ral units
Technicians Art/desig
n t echnician IC T manager IC T t echnician Repr og raphics Resour ces staff Scienc e t echnician Technology technician Sp ecialist & T echnic al A rt & cr af t t echnician D esig n & technology technician Food technology technician IC T t echnician/manager Lab technician Libr ar ian Libr ar y/inf or ma tion assistan t M usic specialist Scienc e t echnician Te xtiles technician No c ompar able ca tegor y in S chool C ensus (ther e roles ar e included in other educa tion suppor t staff ca tegor y) O ther P upil Supp or t Esc or t Exam in vig ila tor M idda y assistan t/super visor No c ompar able ca tegor y in SSS No c ompar able ca tegor y in S chool C ensus (ther e roles ar e included in other educa tion suppor t staff ca tegor y)
Facilities Cleaner Cook Other
A
dministr
ativ
e staff
Bursars Secr
etar
ies
O
ther admin/cler
ical staff
A
dministr
ativ
e
Administr
at
or
A
tt
endanc
e offic
er
Bursar Business manager Data manager Examina
tions offic
er
Financ
e offic
er
O
ffic
e manager
PA t
o head
Rec
eptionist
Secr
etar
y
A
dministr
ativ
e staff
Administr
at
or
Bursar Cler
ical assistan
t
Da
ta manager
Examina
tions in
vig
ila
tor
Examina
tions manager
Financ
e offic
er
Financ
e t
echnician
O
ffic
e manager
Rec
eptionist
School business manager Secr
etar
y/P
2.3 Numbers of support staff
2.3.1 How many support staff are there and where do they work?
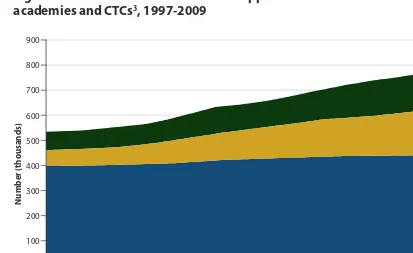
Figure 1 shows the full-time equivalent (FTE) number of support staff in
schools which has increased by more than 200,000 from 134,000 in 1997 to
346,000 in 2009, a 150% increase2. In comparison, the number of teachers in
[image:13.737.90.503.315.568.2]schools has increased by around 40,000 over the period 1997 – 2009 (DfE, 2009b).
Figure 1: FTE number of teachers and support staff in LA maintained schools,
academies and CTCs3, 1997-2009
2 Unless otherwise stated this section refers to Full-Time Equivalent (FTE) numbers of support staff working in schools. The actual number of support staff is likely to be a lot higher than the FTE number.
3 City Technology Colleges
Source: School Census 900
800
700
600
500
400
300
200
100
0
1997 1998 1999 2000 2001 2002 2003 2004 2005 2006 2007 2008 2009
Number
(thousands)
Figure 2 shows that the number of support staff in nursery & primary schools is greater than the number in secondary schools and other schools (DfE, 2009b).
Figure 2: FTE number of support staff in local authority maintained schools, academies and CTCs
Figure 3 shows that Teaching Assistants (TAs) represent the largest group of
support staff (approx. 184,000 in 2009), followed by administrative staff, other
[image:14.737.94.500.548.785.2]support staff and technicians (DfE, 2009b).
Figure 3: FTE support staff in maintained schools,PRUs, CTCs and academies 1997-2009
4
4 Pupil Referral Units
Source: School Census
Source: School Census
0 50 100 150 200 250 300 350
1997 2001 2002 2003 2004 2005 2006 2007 2008 2009
Number
of
support
staff
(thousands)
Academies and CTCs Secondary
PRUs3 and education elsewhere
Nursery and primary Special Schools
0 50 100 150 200 250 300 350 400
1997 1998 1999 2000 2001 2002 2003 2004 2005 2006 2007 2008 2009
FTE
number
(thousands)
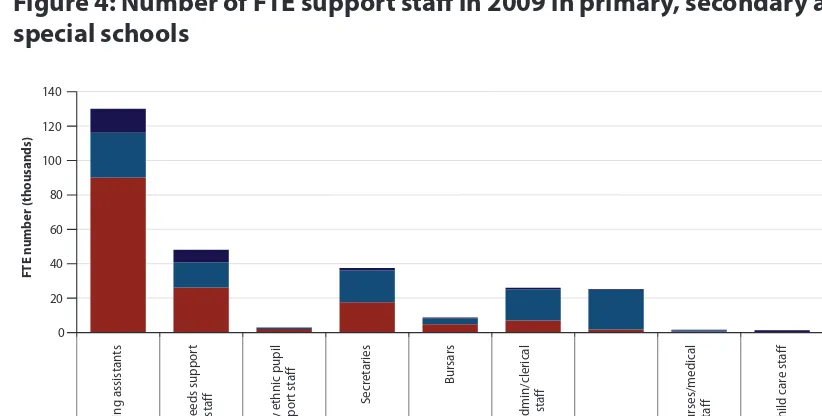
Figure 4 shows that these broad categories mask a lot of differences in the numbers of support staff in schools. Looking at more detailed definitions within schools (excluding CTCs and PRUs), we can see that teaching assistants (TAs) still
make up the largest group (131,000 in 2009, of which around 13,800 were HLTAs5).
Within the broader category of teaching assistant, however, there are nearly 48,000 special needs support staff and almost 3,000 minority ethnic pupil support staff. The next largest category after teaching assistants is other education
support staff (59,000) this category includes librarians, welfare assistants, learning mentors and other non-teaching staff not covered in teaching assistants (see Table 1). Within the broad category of administrative staff there are around 37,000 secretaries and 26,000 ‘other’ admin staff, followed by a much smaller number of
[image:15.737.97.508.380.588.2]school bursars6 (c. 9,000) (DfE, 2009b).
Figure 4: Number of FTE support staff in 2009 in primary, secondary and special schools
5 The role of HLTA was introduced in 2003 in order to recognise the role played by more senior teaching assistants, and to provide them with targeted training to reinforce and improve their skills, thus allowing them to make an even greater contribution to improving standards in schools. HLTAs work alongside teachers acting as specialist assistants for specific subjects or departments, or help lesson planning and the development of support materials. In order to get HLTA status an individual has to undergo a training and assessment programme with support from their school.
6 Now more commonly referred to as School Business Managers.
Source: School Census 0
20 40 60 80 100 120 140
Te
ac
h
in
g
a
ss
is
ta
n
ts
Sp
ec
ia
l n
ee
d
s
su
p
p
o
rt
st
af
f
Minority
ethnic
pupi
l
support
staff
Secretarie
s
B
u
rs
ar
s
Other
admin/clerical st
af
f
M
at
ro
n
s/
n
u
rs
es
/m
ed
ic
al
st
af
f
C
h
ild
c
ar
e
st
af
f
Other
education
su
p
p
o
rt
s
ta
ff
Teaching Assistants Administrative staff Technicians Other support staff
FTE
number
(thousands
)
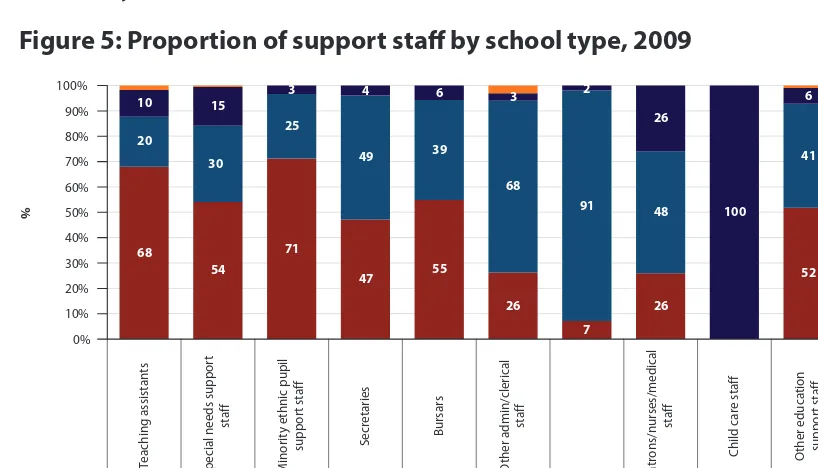
Source: School Census Figure 5 shows that the distribution of categories of support staff across different
school types varies. Around half of all support staff work in primary schools
and a third work in secondary schools. Around 70% of teaching assistants
[image:16.737.94.503.268.502.2]and minority ethnic pupil support staff work in primary schools. Compared to this, 90% of technicians, and almost 70% of other admin or clerical staff work in secondary schools (DfE, 2009b).
Figure 5: Proportion of support staff by school type, 2009
An examination of pupil to TA ratios (see Table 2) shows that the pupil to TA ratio is smaller in primary schools than in secondary schools (i.e. there are fewer pupils to each TA in primary schools than in secondary schools). Although these ratios have decreased over each school type since 2002, in 2009 there were, on average, 33.5 pupils for each TA, compared to 80.1 pupils per TA in secondary schools. In special schools there were, on average, 4 pupils for every TA (DfE, 2009b).
68 54
71
47 55 26
7
26
52 52 20
25
49 39 68
91 48
41 38 10 15
3 4 6 3 2
26
100
6 9
30
0% 10% 20% 30% 40% 50% 60% 70% 80% 90% 100%
Teaching
assistants
Sp
ec
ia
l n
ee
d
s
su
p
p
o
rt
st
af
f
Minority
ethnic
pupi
l
support
staf
f
Se
cr
et
ar
ie
s
Bu
rs
ars
O
th
er
a
d
m
in/clerical
st
af
f
M
at
ro
n
s/
n
u
rs
es
/m
ed
ic
al
st
af
f
Child
care
staf
f
O
th
er
e
d
u
ca
ti
on
support
staf
f
Teaching Assistants Administrative staff Technicians Other support staff All support staff
%
Table 2 Pupil:t
eaching assistan
t
1 ra
tios in lo
cal authorit
y main
tained
2 nurser
y/primar
y, sec
ondar
y, sp
ecial and pupil r
ef
err
al Units
Years:
Januar
y 2002 t
o 2009
Co
ver
age:
England
2002
2003
2004
2005
2006
2007
2008
2009
Nurser
y/P
rimar
yschools
59.1
50.9
46.4
41.8
40.8
37.8
34.6
33.5
Sec
ondar
yda
ta
167.2
148.5
131.2
110.6
98.7
91.7
84.8
80.1
Special
6.7
5.7
5.5
5.0
4.5
4.3
4.1
4.0
PRU
11.2
9.1
7.1
7.0
7.8
7.1
6.9
5.6
Total M
ain
tained S
chools
72.2
62.7
57.2
51.1
48.6
45.2
41.5
39.7
1.
Includes higher lev
el t
eaching assistan
ts
, nurser
y nurses
, nurser
y assistan
ts
, lit
er
ac
y and numer
ac
y suppor
t staff
, an
y other non-t
eaching staff r
egular
ly emplo
yed t
o suppor
t t
eachers in the classr
oom, special needs
suppor
t staff and minor
ity ethnic pupil suppor
t staff
.
2.
Ex
cludes nurser
y educa
tion, academies and cit
y t
echnology c
olleges
.
Sour
ce:
School C
Data from the Deployment and Impact of Support Staff (DISS) project gives us some further evidence on the distribution of support staff in schools. In 2008 around one in ten maintained schools had 10 support staff members or fewer, a quarter had between 11-20 and over a third had between 21-40. Just under a third had 41 or more support staff members (Blatchford et al 2009a).
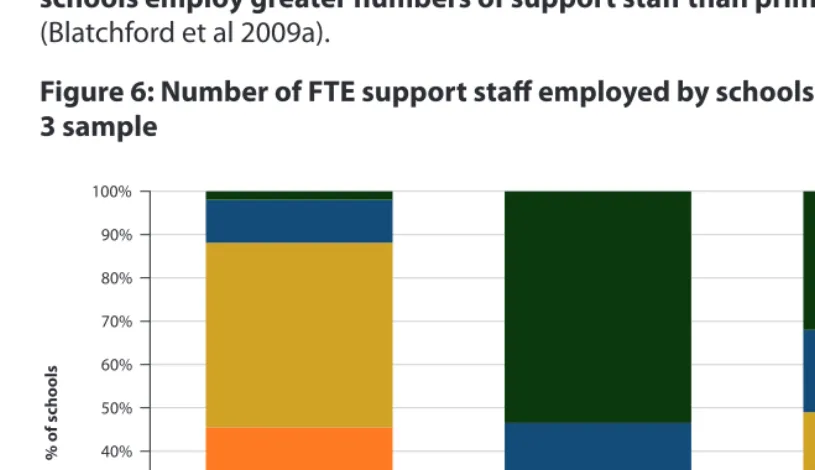
Data broken down by school type (see Figure 6) suggests that although in overall terms there are more support staff members in primary schools than in secondary or special schools, this is because there are a greater number of primary schools
than secondary or special schools and proportionately, secondary and special
schools employ greater numbers of support staff than primary schools
[image:18.737.96.504.376.611.2](Blatchford et al 2009a).
Figure 6: Number of FTE support staff employed by schools in DISS wave 3 sample
DISS also examined the factors which influenced the number of support staff within a school and found that three sets of factors were independently related to the numbers of support staff in school: school type, school size, and pupil need.
0% 10% 20% 30% 40% 50% 60% 70% 80% 90% 100%
Primary Secondary Special
%
o
f s
ch
o
o
ls
Number of support staff
61 or more 21-40
11-20
10 or fewer 41-60
2.3.2 Higher Level Teaching Assistants
[image:19.737.94.504.581.798.2]The role of HLTA was introduced in 2003 in order to recognise the role played by more senior teaching assistants, and to provide them with targeted training to reinforce and improve their skills, thus allowing them to make an even greater contribution to improving standards in schools. HLTAs work alongside teachers acting as specialist assistants for specific subjects or departments, or help lesson planning and the development of support materials. In order to get HLTA status an individual has to undergo a training and assessment programme with support from their school.
Figure 7 shows the number of FTE HLTAs in maintained schools and academies since 2006.
Figure 7: Number of FTE HLTAs in local authority maintained schools and academies
Controlling for:
•
School type•
Number FTE pupils•
% FSM pupils•
% SEN pupils•
% EAL pupils•
% non-White pupils•
School setting(urban/rural)
•
Area of countrySpecial schools have more support staff than primary or secondary schools.
Schools with greater numbers of FTE pupils had more support staff
Schools with higher proportions of FSM, SEN and EAL pupils had more support staff (results differed across role categories)
Adapted from DISS (Blatchford et al 2009a)
0 2 4 6 8 10 12 14 16
2006 2007 2008 2009
Number
(thousands
)
Nursery & Primary Secondary (including Academies) Special PRUs 5,500 HLTAs
in total
9,200 HLTAs in total
11,800 HLTAs in total
14,100 HLTAs in total
A survey of a sample of school senior leaders who employed HLTAs found that over two thirds of schools in the sample had one or two members of staff with HLTA status, however, only 53% of schools reported that they had one or two members of staff carrying out HLTA-level duties. 15% of schools had no one carrying out HLTA-level duties (Wilson et al, 2007).
The same study surveyed a nationally representative sample of people with HLTA
status and found that just over a third were employed in an HLTA role only
(27% full-time and 9% part-time). Sixteen per cent were working part-time as an HLTA and part-time in another role and 17% were working as a senior TA but taking on some HLTA duties. Almost a third were not taking on HLTA duties at all.
2.4 Spend on support staff
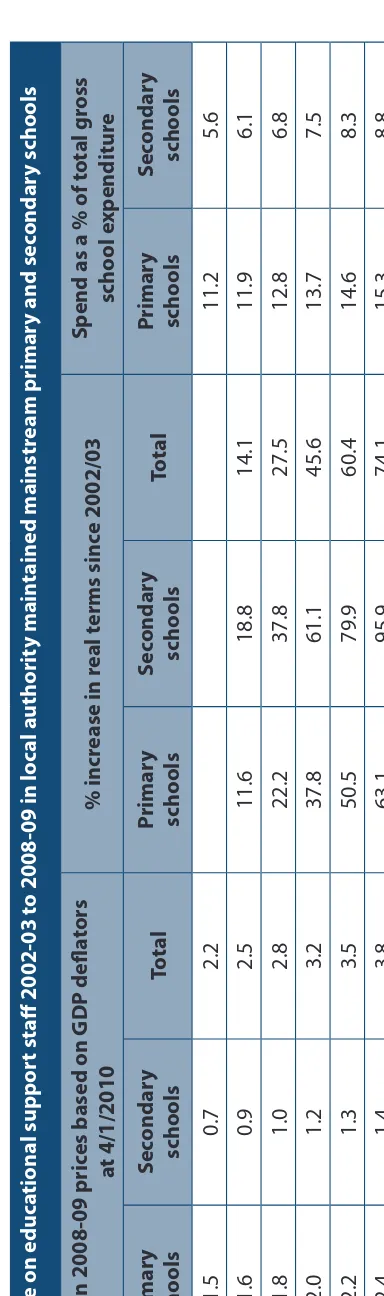
Tables 3 and 4 show that expenditure on support staff (especially education
support staff) has grown rapidly over recent years, both in real terms and as a percentage of schools’ total gross expenditure. In addition, primary schools spend more on support staff as a proportion of their total gross
school expenditure than secondary schools. In 2008-09 the total expenditure
on education support staff7 in maintained primary and secondary schools was
£4.1bn, of which expenditure in primary schools was £2.5bn and in secondary schools £1.5bn. This represents an 86% increase since 2002-03 (in real terms). Growth has been strongest in the secondary sector with expenditure increasing by more than 100% in real terms, whilst growth in primary schools was 74%. In addition to these real terms increases the amount that schools spend on educational support staff as a proportion of their total gross expenditure has also increased year-on-year. In primary schools in 2002/03, 11.2% of total expenditure was on educational support staff and by 2008/09 this had increased to 15.9%. In secondary schools this proportion increased from 5.6% to 9.3%.
Total e
xp
enditur
e on educ
ational supp
or
t staff 2002-03 t
o 2008-09 in lo
cal authorit
y main
tained mainstr
eam primar
y and sec
ondar
y scho
ols
£bn in 2008-09 pric
es based on GDP defla
tors
at 4/1/2010
% incr
ease in r
eal t
erms sinc
e 2002/03
Sp
end as a % of t
otal gr
oss
scho
ol e
xp
enditur
e
Primar
y
scho
ols
Sec
ondar
y
scho
ols
Total
Primar
y
scho
ols
Sec
ondar
y
scho
ols
Total
Primar
y
scho
ols
Sec
ondar
y
scho
ols
2002-03
1.5
0.7
2.2
11.2
5.6
2003-04
1.6
0.9
2.5
11.6
18.8
14.1
11.9
6.1
2004-05
1.8
1.0
2.8
22.2
37.8
27.5
12.8
6.8
2005-06
2.0
1.2
3.2
37.8
61.1
45.6
13.7
7.5
2006-07
2.2
1.3
3.5
50.5
79.9
60.4
14.6
8.3
2007-08
2.4
1.4
3.8
63.1
95.9
74.1
15.3
8.8
2008-09
2.5
1.5
4.1
74.2
109.2
86.0
15.9
9.3
Sour
ce:
Sec
tion 52 O
ut
-tur
n sta
temen
ts (EDUC
ATION SUPPOR
T ST
[image:21.737.123.315.158.806.2]AFF (E03))
Table 4 sho
w
s tha
t unlike pr
imar
y schools
, sec
ondar
y schools spend mor
e on
non-educa
tion suppor
t staff than they do on
educa
tion suppor
t staff (both in r
eal t
er
ms and as a pr
opor
tion of t
otal e
xpenditur
e) and g
ro
wth in this ar
ea has not been as
mar
ked as it has f
or educa
tion suppor
t staff
. I
n 2008-09 the t
otal e
xpenditur
e on
non-educa
tion suppor
t staff in main
tained
pr
imar
y and sec
ondar
y schools w
as £3.1bn , of which e
xpenditur
e in pr
imar
y schools w
as £1.4bn and in sec
ondar y schools £1.6bn. This r epr esen
ts a 43% incr
ease sinc
e 2002-03 (in r
eal t
er
ms). Gr
owth has been str
ongest in the sec
ondar y sec tor with expenditur e incr easing b
y 58% in r
eal t
er
ms
, whilst g
ro
wth in pr
imar
y schools w
as 29%.
The amoun
t tha
t schools spend on
non-educa
tional suppor
t staff as a pr
opor
tion of t
otal g
ross e
xpenditur
e has incr
eased fr
om
8.5% t
o 9.1% in pr
imar
y schools and fr
om 7.8% t
o 9.7% in sec
ondar
y schools
.
Table 4 Total e
xp
enditur
e on
non-educ
ational supp
or
t staff 2002-03 t
o 2008-09 in lo
cal authorit
y main
tained mainstr
eam primar
y and sec
ondar
y scho
ols
£bn in 2008-09 pric
es based on GDP defla
tors
at 4/1/2010
% incr
ease in r
eal t
erms sinc
e 2002/03
Sp
end as a % of t
otal gr oss scho ol e xp enditur e Primar y scho ols Sec ondar y scho ols Total Primar y scho ols Sec ondar y scho ols Total Primar y scho ols Sec ondar y scho ols 2002-03 1.1 1.0 2.1 8.5 7.8 2003-04 1.1 1.1 2.3 3.2 7.9 5.5 8.4 7.8 2004-05 1.2 1.2 2.4 7.1 18.5 12.6 8.6 8.2 2005-06 1.3 1.4 2.6 14.0 32.4 22.8 8.7 8.7 2006-07 1.3 1.5 2.8 18.2 42.5 29.9 8.8 9.1 2007-08 1.4 1.6 2.9 23.2 50.8 36.5 8.9 9.4 2008-09 1.4 1.6 3.1 29.2 57.5 42.8 9.1 9.7 Sour ce: S ec
tion 52 O
ut -tur n sta temen ts (P remises S taff(E04), A dministr ativ
e & Cler
ical S
taff (E05), C
at
er
ing S
taff (E06), C
The Department’s Consistent Financial Reporting (CFR) data demonstrate variation in expenditure on teaching assistants between phases and by school characteristics (such as the proportion eligible for free school meals). The 2008/09 data show
that schools operating in areas of high deprivation, as measured by the
proportion of pupils eligible for free school meals (FSM), spend much more on education support staff than schools with more affluent intakes. Having a high proportion of pupils with Special Educational Needs (SEN) also tends to
be related to higher per pupil expenditure on support staff. It should be noted
that schools with higher levels of FSM and SEN attract, on average, a higher level of funding and hence have a higher level of total per pupil expenditure. Therefore we might expect schools with these characteristics to be spending more on education support staff simply as a function of spending more overall.
The Audit Commission carried out analysis of school expenditure on teachers and education support staff in order to look at the variation in deployment. Figure 8 looks at the amount spent on education support staff for every £1,000
spent on teachers. The analysis shows a wide variation in the amount that
schools spend on education support staff in relation to teachers. In 2007/08,
5% of primary schools spent £500 or more on education support staff for every £1,000 spent on teachers, 55% of primary schools spent £300 or less and 15% of primary schools spent £200 or less. 5% of secondary schools spent around £280 or more on education support staff for every £1,000 spent on teachers, around 50% spend £150 or less and around 10% spend under £100. The Audit Commission argues that schools face difficulties in making informed decisions about the balance of teachers to education support staff because of the lack of evidence and guidance on the cost effectiveness and impact of different options. They recommend that national stakeholders should work to improve the evidence base in this area and to disseminate this in the form of information and guidance to schools and governors.
Figure 8: Schools’ decisions on the ratios of teachers to education support staff
Source: Audit Commission (2009)
600
500
400
300
200
100
0 5
£
Percentage of schools (cumulative)
Primary schools Secondary schools
15 25 35 45 55 65 75 85 95
Spend
on
education
suppor
t staff
per
£1,000
spent
on
teachers
Source: Blatchford et al 2009a (DISS) and Teeman et al, 2009 (SSS)
2.5 Characteristics of support staff 2.5.1 Demographics
The Department’s school census does not collect demographic information on school support staff. However, data gathered from the DISS project and the Training and Development Agency for Schools’s (TDA) Support Staff Study (SSS) develops our understanding of the profile of support staff.
The evidence shows that support staff are overwhelmingly white, female
and aged 35 or over. Both DISS and SSS suggest that a very small proportion of
support staff are from minority ethnic groups (c. 4%). This compares to a quarter of pupils in primary schools and a fifth of pupils in secondary schools (DfE, 2009c).
Table 5: Gender, age and ethnic profile of support staff in DISS and SSS
These profiles did differ to some extent by category of support staff:
•
Although only around 10% of all support staff were male, there were largerproportions of males within the site staff and specialist/technical categories (34% and 43% respectively in SSS and 76% and 41% in DISS).
•
In SSS there was a more even age spread among the specialist and technical category, where around a quarter of all such staff were in each age category. There was also a higher proportion of site staff (34%) in the 55+ category than for all support staff (18%).(Blatchford et al, 2009a and Teeman et al, 2009)
DISS (WAVE 3, 2008) SSS (2008)
Gender
Male 11% 13%
Female 89% 87%
Age (SSS)
18-34 15%
35-44 32%
45-54 34%
55+ 18%
Ethnicity
White 96% 96%
N = 2,847 3,261
The age categories used in DISS were different to SSS but
2.5.2 Qualifications
Both DISS and SSS asked about what types of qualification support staff held. The results are not directly comparable because of the different ways in which
the questions were asked in the two studies.8 The results show that around 10%
of all support staff hold no formal qualifications, between a quarter and a third hold A/AS Level qualifications and more than one in ten have at least a
degree (see tables 6 and 7). As would be expected there are differences between
the different support staff groups:
•
Site and facilities staff are less well-qualified than other support staff groups.Between a third and two fifths of site staff and a quarter of facilities staff have no qualifications, and fewer than 5% of these members of support staff have a degree.
•
Technicians/specialist and technical staff appear to be the most qualified group. According to SSS almost a third of this group holds a qualification above A/AS-Level. In DISS almost a third of this group said they had a degree and over a tenth said they had a higher degree.(Blatchford et al, 2009a and Teeman et al, 2009)
Table 6: Highest academic qualification of support staff in SSS9
8 DISS asked support staff to list which qualifications they held and hence staff could select more than one qualification. SSS asked support staff to name their highest qualification.
9 A Level 1 qualification includes GCSE grades D-G or equivalent. A Level 2 qualification includes GCSE grades A*-C or equivalent. A Level 3 qualification includes A/AS Levels or equivalent.
None (%) Level 1 or
Level 2 (%) Level 3 (%) Higher than Level 3 (%)
TA/HLTA 8 54 23 13
Pupil support 20 49 17 10
Specialist &
Technical 8 34 28 31
Learning support 3 56 20 14
Administrative 6 54 21 16
Site 44 44 7 3
All 14 52 20 14
N one (%) GCSE D
-G (%) GCSE
A*-C (%) CSE (%) O - Le vel (%) A/AS Level (%)
The Department’s Aspects of workforce remodelling research (the Remodelling research) found that a fifth of primary school teaching and learning support staff taking whole classes had an HE qualification, around two fifths (45%) were qualified up to Level 3 and a quarter up to Level 2. In secondary schools, two fifths of secondary school teaching and learning support staff taking whole classes had an HE qualification, a quarter were qualified to Level 3 and a further quarter to Level 2. In special schools a fifth had an HE qualification and a half had a Level 3 qualification (Hutchings et al, 2009).
2.5.3 Maths and English qualifications
Tables 8 and 9 (from SSS) show that the majority of support staff hold a
qualification in maths (75%) and English (83%) and the majority of these are
GCSE or equivalent qualifications. This varied by support staff group:
•
80% or more of TA/HLTAs, specialist and technical, Learning support andadministrative support staff hold maths qualifications.
•
20% of specialist and technical staff with a maths qualification hold a mathsA-level or equivalent compared to 7% of all support staff with a maths qualification.
•
Smaller proportions of pupil support and site staff hold maths qualifications(68% and 44% respectively).
•
Around 90% of TA/HLTAs, specialist & technical, learning support andadministrative support staff hold an English qualification compared to three quarters of pupil support staff and half of site staff.
Table 8: Maths qualifications of support staff in SSS
Table 9: English qualifications of support staff in SSS
% with a maths
qualification Of these:
% with GCSE or
equivalent % with A-level or equivalent
All support staff 75 83 7
TA/HLTA 82 82 4
Pupil support 68 85 5
Specialist and Technical
86 77 19
Learning support 80 84 5
Administrative 83 88 9
Site 44 83 2
Source: Teeman et al (2009)
% with an English
qualification Of these:
% with GCSE or
equivalent % with A-level or equivalent
All support staff 83 85 11
TA/HLTA 91 83 12
Pupil support 77 85 11
Specialist and Technical
89 85 13
Learning support 89 85 10
Administrative 92 87 13
Site 50 82 4
2.5.4 Experience
There is evidence that most support staff members are not required to
have specific qualifications or previous experience for their posts. The DISS
research found that 60% of support staff did not need specific qualifications in order to be appointed to their post. However, the proportion reporting that they had needed specific qualifications showed statistically significant increases over each wave (2004, 2006 and 2008) of the research. Some 45% of support staff stated that they were required to have previous experience for their post (Blatchford et al, 2009a).
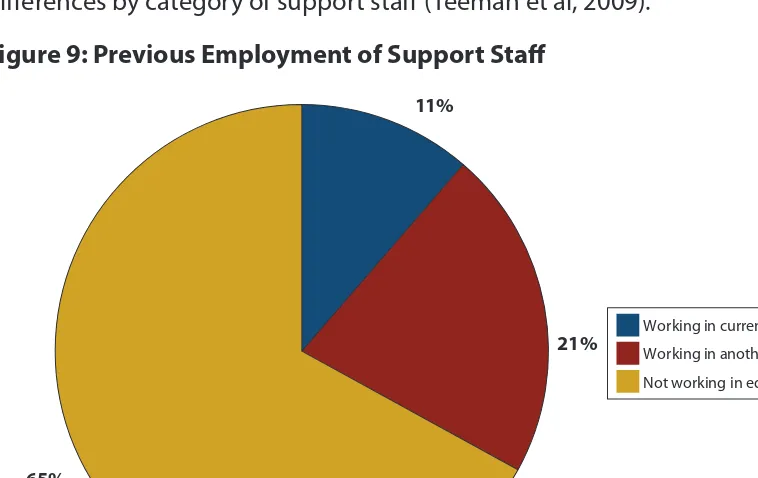
[image:29.737.111.490.396.635.2]SSS provides further evidence on the previous experience of those working as support staff. Figure 9 shows that a third of the sample had been working in a school prior to taking on their current role but two thirds of the sample had not been working in education prior to their current role. There were no real differences by category of support staff (Teeman et al, 2009).
Figure 9: Previous Employment of Support Staff
This is not to imply that these support staff do not have other relevant skills and experience. Ofsted identified a number of examples of highly skilled professionals working as support staff as a result of the “revolutionary shift” in the school
workforce. For example:
•
A marine biologist with a PhD working as a technician in a biology department•
A psychologist training in a maths department•
A recruitment officer from a major national company taking responsibilityfor recruitment across the school
11%
21%
65%
Working in current school Working in another school Not working in education
•
A retired bank manager working as a business manager•
Graduates working as TAs or cover supervisors before undertaking teachertraining. (Ofsted, 2007)
2.6 Contractual arrangements 2.6.1 Contract types
The vast majority of support staff are permanently employed (88% in SSS and DISS) and it appears that equal proportions work full-time and part-time (48%
and 52% respectively in SSS) (Blatchford et al, 2009a; Teeman et al, 2009)10.
The majority of support staff are contracted to work term-times only as less than a third of staff at each wave of DISS and a fifth of staff in the SSS survey reported to be contracted to work 52 weeks a year. The exception to this is site staff, 95% of whom said they were contracted to work 52 weeks a year (Blatchford et al, 2009a; Teeman et al, 2009).
DISS also reported that 14% of support staff held more than one post. Split roles appear to be relatively common for support staff who have achieved Higher Level Teaching Assistant (HLTA) status. A third of HLTA-status support staff surveyed by NFER in November 2006 were working in split roles (including some HLTA duties). Two thirds of these were paid differently for working in these different roles but a third were not paid differently (Wilson et al, 2007).
Most of those with HLTA status (59%) were paid on a term-time only basis with pay spread over 52 weeks, a further fifth were paid throughout the year (e.g. paid for holidays) and just over a tenth (13%) received pay on a term-time only basis.
Two thirds of those with split roles received different pay for their HLTA and
non-HLTA roles (Wilson et al, 2007).
The vast majority of senior leaders were aware of, and used, their LA’s
recommended pay structure for HLTAs. However 10% of those that were aware of the pay structure recommendations were not using them (Wilson et al, 2007).
2.6.2 Hours worked
The DISS survey asked in more detail about the number of hours worked. Around a third of staff worked less than 15 hours a week and a fifth worked between 15-24 hours a week. A further third worked between 25-34 hours a week and under a fifth (17%) worked 35 hours a week or more (classed as full-time in DISS).
The average hours worked per week was 21.7 in wave 3 – a reduction from 23
hours in wave 1. However, there were some marked differences in working hours
across phase of education and by support staff category.
The average number of hours worked was considerably higher in secondary schools (27.2 hours in wave 3) and special schools (24.6 hours) than in primary schools (19.3 hours). Support staff in secondary schools were much more likely to work 35 hours or more a week (32%) than those in primary school (9%).
Site staff had the longest average weekly hours (31.1 hours in wave 3), followed by admin staff (29.4), pupil welfare staff (28.9) and technicians (28.1), whereas other pupil support staff (which includes escorts, exam invigilators and midday supervisors) had the shortest (10.7). This was consistent across all 3 waves. Site staff, admin staff and pupil welfare staff were the groups most likely to work 35 hours or more a week.
DISS also asked support staff about working extra hours (see Figure 10).
A third of staff reported that they would like to work more hours (this was more
common among primary school staff). A fifth of staff were required to work extra
hours and two thirds do so voluntarily. Working extra hours is quite a common
occurrence. Just under half of those who are required to work extra hours do so at least once a week, and three quarters of staff who voluntarily work extra hours do so at least once a week. Over three quarters of those who work extra hours work 3 hours or less a week. Only half of those who are required to work extra hours always/sometimes get paid for doing so. Almost all support staff were working on tasks that were part of their usual jobs when they were working overtime, although a quarter were performing tasks outside of their usual roles
[image:31.737.91.499.499.745.2](Blatchford et al, 2009a).
Figure 10: Working extra hours (all support staff at wave 3)
49% 23%
78% 18%
86% 76% 46%
67% 20%
0% 10% 20% 30% 40% 50% 60% 70% 80% 90% 100%
Required to work extra hours: always/sometimes paid Voluntarily work extra hours:
>3 hours a week Voluntarily work extra hours:
3 hours or less a week Required to work extra hours:
> 3 hours a week Required to work extra hours:
3 hours or less a week Voluntarily work extra hours
at least once a week Required to work extra hours
at least once a week Voluntarily work extra hours Required to work extra hours
%
Data from the DISS case studies (Blatchford et al, 2009b) provides further evidence that schools often rely on the ‘goodwill’ of support staff to work extra hours. Eight of the 9 primary schools and 6 of the 9 secondary schools visited raised this issue, as illustrated by this quote from a secondary school headteacher: “I don’t expect them to stay behind for meetings if they’re not paid for it. A lot of them volunteer to do extra...But no, I would never expect it.”
(Blatchford et al, 2009b p.70) In addition, only half of the schools were paying support staff for these extra hours.
2.6.3 Wages
DISS asked support staff about their wages (before tax). Figure 11 shows that,
on average, in wave 3 (2008) support staff were paid £9.71 an hour, this was higher than the average wage in wave 1 (£8.80 an hour) and in wave 2 (£8.69
an hour). The increases in average wages are roughly in line with the inflation
over that period.
[image:32.737.94.504.512.724.2]Figure 11 also shows that support staff in secondary schools have a higher average hourly wage than those in primary or special schools, and Pupil welfare, technicians and admin staff have higher average hourly wages than other groups. Facilities staff have a much lower average hourly wage (£7.67) than other support staff.
Figure 11: Average wage per hour (before tax) of support staff
8.99
11.44 7.67
8.56
11.61 12.04 10.28
10.63 9.9 9.53
9.71
0 2 4 6 8 10 12 14
Site staff Admin staff Facilities Other pupil support Technicians Pupil welfare TA equivalent Special Secondary Primary All Support Staff
Su
p
p
o
rt
S
ta
ff
R
o
le
Ty
p
e
o
f s
ch
o
o
l
£ per hour
These broad categories mask a lot of differences in average hourly earnings which range from as little as £6.91 an hour for a cleaner (within the facilities category) to
£18.51 an hour for Therapists (in the TA equivalent category). Annex A includes a
full list of the mean wages for individual post titles.
Even within the same category of support staff there is likely to be a great deal of variation in pay depending on which local authority the member of
staff works in. Data gathered during 2009 by the Labour Research Department
[image:33.737.95.502.374.620.2](using the Freedom of Information Act), from 129 local authorities on the grading of these staff identified a wide variety in the grading of these staff, suggesting a wide variation in salaries. Some authorities paid on a fixed point or a short scale whilst others graded on wide ranges. Figure 12 demonstrates the wide variation in pay scale ranges for TAs in these 129 authorities and indicates the implications of pay scales for salary ranges (Labour Research Department, 2010).
Figure 12: Scale Point Ranges for Teaching Assistants in 129 Local Authorities
0 5 10 15 20 25 30 35 40
Scale Point Range Scale point 4
equates to a salary of £12,145 nationally, £14,697 in outer London and £15,036 in inner London
Scale point 34 equates to a salary of £28,636 nationally, £30,390 in outer London and £31,935 in inner London Each red bar represents a local authority
Figure 13, based on data from the DISS surveys, shows that less than half of support staff are satisfied with their pay. Support staff in secondary schools and TAs appear to be the most dissatisfied (Blatchford et al 2009a).
Figure 13: Support staff satisfaction with their pay
Interview data from the Remodelling report revealed high levels of
dissatisfaction among support staff in terms of their pay and contractual
arrangements. Many were unhappy about use of split- and term-time-only
contracts, many felt pay did not reflect the work they did and some referred to feeling exploited by having to do unpaid overtime. A number of headteachers acknowledged that there was a problem regarding poor pay, terms and conditions and poor career/pay development opportunities and there was a perception that recent changes to support staff roles and training had raised support staff expectations about progression and pay but that these were impossible to fulfil (Hutchings et al, 2009). Ofsted (2010) found that the support staff that they interviewed during the course of their research were largely unclear about how their pay or terms and conditions fitted in with the national
picture, due to the lack of coherent national guidance.11
11 Note that the School Support Staff Negotiating Body have been formed to negotiate support staff pay and conditions.
44 44
41
50
33
47
41
53
48 52 52
0 10 20 30 40 50 60 70 80 90 100
All Primary Secondary Special TA Pupil Welfare
Technicians Other Pupil Support
Facilities Adminis trative
Site
%
v
er
y/
fa
ir
ly
s
at
is
fi
ed
2.7 Liaison with parents
A recent survey of more than 1,000 parents of school-aged children showed that the majority of these parents feel that their child’s school has a range of staff who help their child and that all staff have an impact on their child’s learning
(TDA opinion poll, 2010). There is clearly a desire from parents to know more about the different roles within their child’s school: over three quarters of parents said they would like to know more about how different members of staff can help their child and over half said they were confused about who does what
[image:35.737.95.501.325.561.2](see Figure 14).
Figure 14: Parents views on school staff
92% 79%
56% 63%
77%
0% 10% 20% 30% 40% 50% 60% 70% 80% 90% 100% My child's / children's school
has a broad range of staff members who help my child /
children I think that all the staff in my child's / children's school have
a positive impact on their learning Things have changed so much since I was at school that I get confused as to who does what in my child's /children's school
I feel I have a good understanding of all of the job
roles within my child's / children's school I'd like to know more about how
different members of staff can help my child/children
% agree/strongly agree
This is supported by further evidence from this survey which suggests that parents’ awareness of the role and impact of some members of support staff is low (see figure 15). Over three quarters of parents in this survey felt that they had a good understanding of what lunchtime assistants, receptionists and headteachers do in a school and around two thirds felt they had a good understanding of what teaching assistants do. Fewer parents were aware of what attendance officers, learning mentors, parent support advisors, school business managers and extended services coordinators do. Parents’ awareness was also relatively low about the impact that some members of support staff have on their child’s learning. Although around two thirds of parents in the survey felt they knew what the impact of headteachers and teaching assistants was on their child’s learning and half were aware about the impact of lunchtime assistants, fewer parents were aware about the impact of receptionists, learning mentors, attendance officers, parent support advisors, extended services coordinators or school business managers.
Figure 15: Percentage of parents of school-age children who feel they have a good understanding of the role and impact on their child’s learning of the following individuals
68%
20%
26%
38%
76%
45%
77%
82%
17% 65%
16%
22%
39%
50%
31%
41%
70%
19%
0% 10% 20% 30% 40% 50% 60% 70% 80% 90% 100%
Teaching Assistants
School Business Manager
Parent Support
Advisor
Learning Mentor
Lunchtime Assistant
Attendance Officer
Receptionist Headteacher Extended Services Coordinator
%
o
f p
ar
en
ts
w
it
h
school-age
children
Role Impact
This lack of awareness could be explained by a lack of contact between parents and some members of support staff. Data from this survey suggest that parents are most likely to have frequent contact with teachers, teaching assistants and receptionists and that the majority never have any contact with other members of school staff. Between a quarter and a third of parents reported that they have contact with teaching assistants and receptionists daily or weekly (although nearly half of parents said they never had contact with teaching assistants) whereas the majority of parents reported that they never had any contact with lunchtime assistants, school business managers, learning mentors, attendance officers, parent support advisors or extended services coordinators (see Table 10).
Table 10: Frequency of contact between parents and members of school staff
Daily Weekly Monthly Yearly Never Don’t
Know
Teacher 23.5% 17.2% 28.6% 24.0% 4.1% 2.5%
Teaching assistants 13.9% 16.6% 13.3% 7.3% 44.7% 4.1%
Receptionist 5.5% 21.7% 33.3% 17.3% 17.6% 4.6%
Headteacher 4.5% 15.3% 24.9% 31.1% 19.3% 4.7%
Midday assistant 4.1% 5.8% 6.8% 3.9% 72.4% 7.1%
School Business
Manager 2.2% 3.1% 4.9% 4.8% 76.9% 8.2%
Learning Mentor 2.1% 3.7% 10.3% 7.1% 68.2% 8.7%
Attendance Officer 1.9% 2.9% 5.5% 6.0% 75.7% 7.9%
Parent Support Advisor 1.8% 3.6% 8.7% 8.1% 69.0% 8.8%
Extended Services
Co-ordinator 1.4% 3.0% 4.1% 5.9% 73.1% 12.5%
Chapter Three: Impact of Support Staff
3.1 Summary
Impact on teachers
•
Evidence from DISS and the Teachers’ Workload Diary Survey shows thatthe amount of time that teachers spend on admin tasks has decreased. However, there is evidence that teachers do not always perceive that they are spending less time on these tasks. In addition, Ofsted (2010) found no evidence that schools were considering how releasing teachers from these tasks could improve standards.
•
The evidence suggests shows that teachers feel that support staff havehad a positive impact on their workloads, their job satisfaction and their stress levels. The EPPI review of international evidence found that a ‘team teaching’ approach to using teaching assistants was most likely to lead to positive impacts upon the teacher and the school.
•
There was some evidence from DISS and the Remodelling researchthat teachers feel that support staff can have a positive impact on their teaching. However, there is also evidence that the presence of support staff in the classroom can have a negative impact on the extent of teachers’ interactions with supported pupils.
Impact on pupils
•
The evidence on the impact of support staff on pupils’ attitudes andbehaviour is mixed. The EPPI review showed that support staff appear to
have positive impacts on academic engagement but can have a negative impact on supported pupils’ interactions with peers and teachers.
Effective training and collaborative planning between teachers and support staff is essential to maximise their benefits. Ofsted found many examples of where support staff had been used to improve the quality of support, care and guidance on offer to pupils which in turn had led to improvements in attendance and behaviour. However, quantitative analysis within DISS showed that for most year groups there was no significant effect of receiving additional support on pupils’ Positive Attitudes to Learning (PAL) outcomes. The exception to this was in Year 9 where high levels of support were associated with pupils’ becoming less distracted, less disruptive, more confident, more motivated, more independent, being better able to follow instructions and complete tasks, and having better relationships with peers.
•
The evidence on the impact of support staff on pupils’ academic progress3.2 Introduction
The first section of this chapter explores the impact of support staff on teachers’ workload, stress and job satisfaction. The second section looks at the impact of support staff on pupils behaviour, attitudes and academic attainment, distinguishing between studies that have looked at perceptions of impact and those which have looked at the impact of support staff on pupils’ outcomes.
3.3 Impact on teachers
3.3.1 Impact on teachers’ workload
Transfer of routine admin tasks
One of the main changes introduced as a result of the National Agreement was that teachers should no longer routinely undertake a range of clerical and
admin tasks12. A number of studies have looked at the extent to which this has
happened, and the evidence suggests that the amount of time teachers
spend on admin has decreased over time (although teachers may not always
perceive this to be the case). The DISS study found that the extent to which
teachers were performing these tasks decreased at each wave of the study. There were also marked increases in the percentage of teachers reporting that these tasks were now performed by others (typically administrative staff and, to a lesser extent, teaching assistants). However, tasks such as record keeping, arranging classroom displays and giving personnel advice were still largely performed by teachers (over 60% teachers reported performing these tasks). (Blatchford, 2009a). The Department’s Teachers’ Workload Diary Survey also shows that time spent by primary and secondary teachers on general admin support has decreased since 2003 (Angle et al, 2009).
12 Annex 5 to Section 2 of the School Teachers Pay and Conditions Document (STPCD) set out a list of 21 routine and clerical tasks which should be transferred from teachers to support staff, but this was not meant to be exhaustive. The number of tasks commonly quoted is 25, though in the DISS study 26 were listed because pilot research showed that one task seemed to cover two separate activities.
and Ofsted found that classroom-based support staff can have a positive impact on academic progress when they are delivering specific and robust interventions in which they are well-trained and supported. Results from the DISS quantitative analysis was less positive. Controlling for a range of pupil characteristics, receiving higher levels of additional support was largely associated with less academic progress. However, this analysis did not take into account the type or quality of support received and did not include a control group.
•
There were some interactions between effect of support and SEN statusalthough the results do not present a consistent story of the impact of receiving support on pupils with SEN.
•
There was also no consistent story on whether support staff have aFigure 16: Average hours spent on general admin support by primary and secondary classroom teachers
However, data from the Remodelling study suggests that teachers may not perceive that they are spending less time on administrative tasks. This research
found that only a quarter of teachers (in all sectors) agreed that they now
spent less time on routine admin tasks whilst 40% disagreed. Whilst the case
studies showed that schools had implemented a range of measures to ensure the transfer of routine admin tasks, teachers identified a number of reasons why these were not always effective. These included the hours worked by support staff and, in primary, the already large workload of support staff. In some cases it appeared
that teachers also felt that many of these tasks required their professional
skills and were unsure about the criteria for deciding which of these tasks should
be undertaken by support staff. The case studies also showed that some teachers
were choosing to undertake these tasks. For example, some felt that classroom
display work was a key part of their role. In some cases, delegation of these
tasks was thought to take longer than performing the tasks themselves
(Hutchings et al, 2009).
Data from the Remodelling research case studies suggests that primary and secondary schools differ in how they have responded to the need to transfer administrative tasks from teachers to support staff. In primary schools this requirement tends to be met through existing administrative staff (who may require additional training). Secondary schools, on the other hand, had tended to create new, and specialist admin roles, and had recruited new staff from outside of the education sector to fill these roles. Perhaps as a consequence of this, the transfer or admin tasks in primary schools has tended to lead to increased workloads for admin staff. The expansion of admin teams in secondary schools has largely meant that they have been able to absorb the additional workload. This research found that two out of three secondary headteachers said that
4
0 1 2 3 5 6 7
2003 2004 2005 2006 2007 2008 2009
A
ve
ra
g
e
hours
Primary teachers Secondary teachers
complex administrative or pastoral roles had transferred from teachers to support staff (‘to a large extent’ or ‘completely’), compared to one in three primary or special school headteachers although in a third of all schools, some teachers with the relevant expertise continued to carry out complex admin roles. This transfer had been accommodated either through training existing support staff or hiring new support staff members. Teachers often continued to supervise the support staff in these roles (Hutchings et al, 2009).
An Ofsted study of the early effects of the remodelling initiative found that although schools were making progress in the transferral of these tasks from
teachers to support staff, few schools were considering how releasing teachers
from these tasks could improve standards (Ofsted, 2004). In their latest report
there was little evidence of improvement