TEF and informing
student choice
Subject-level classifications, and
teaching quality and student outcome
factors
Research report
June 2018
David Vivian, Andrew Skone James,
Zainab Hazel, Dominic Thomson and
Sam Whittaker
Acknowledgements
Many individuals have been involved in the design and execution of the TEF and Student Choice survey. Particular thanks are given to the 2,790 applicants and 1,051 students for sparing their time to participate in the survey.
We would also like to thank staff at the Department for Education, and in particular the project manager for the research.
David Vivian
Contents
Acknowledgements 2
1 Executive Summary 7
Background and methodology 7
Key findings: Subject classifications 7
Key findings: Teaching quality and student outcome factors 10
Key findings: Awareness and perceived use of the TEF 13
Conclusions 13
2 Background and methodology 15
Background 15
Methodology 16
Structure of the report 19
Reporting conventions 20
3 Subject-level classifications 21
Introduction 21
Accuracy of subject classifications 23
Accuracy: complex courses 25
Sufficiency of subject classifications 27
Usability of subject classifications 28
Usability vs. accuracy of CAH2 subject classifications 30 Subject-specific analysis: Broad classification system 32
Subject-specific analysis: CAH1 classification system 37
Subject-specific analysis: CAH2 classification system 39
Reasons for misclassifying CAH2 45
Subject classification by demographic subgroups 51
4 Teaching Quality and Student Outcome Factors 54
Introduction 54
Which factors are considered most important among applicants? 56 Which factors are considered most important among current students? 59
Other important factors 61
5 Awareness of the TEF 68
Introduction 68
Awareness of provider-level TEF 68
Perceptions of the usefulness of subject-level TEF 71
6 Conclusions 75
Appendix A: Detailed data tables 78
Table of Figures
Figure 1.1 Summary of key subject classification measures 8
Figure 3.1 Accuracy of subject classifications: simple courses 24
Figure 3.2 Accuracy of subject classifications: complex courses 26
Figure 3.3 Likelihood to explore multiple subject areas for complex courses 27
Figure 3.4 Whether subject classifications provide a sufficient amount of information to
help applicants choose where to study 28
Figure 3.5 Ease of subject classification use 29
Figure 3.6 Usability vs. accuracy of subject classifications 31
Figure 3.7 Proportion of applicants accurately classifying to correct Broad subject area 33
Figure 3.8 Proportion of applicants accurately classifying to correct CAH1 subject area 38
Figure 3.9 Proportion of applicants accurately classifying to correct CAH2 subject area 40
Figure 3.10 CAH2 Incorrect classification routes 42
Figure 4.1 Relative importance of teaching quality and student outcome factors among
applicants 57
Figure 4.2 Relative importance of teaching quality and student outcome factors among
students 60
Figure 4.3 Relative weight of each teaching quality and student outcome factor in driving
overall student satisfaction 64
Figure 5.1 Awareness of the TEF 69
Table of Tables
Table 1.1 Importance of factors in determining where to study (applicants) and quality of
undergraduate experience (students) 11
Table 3.1 List of subject areas within each classification 22
Table 3.2 Classification of each CAH2 subject area (simple courses) to Broad subject
area 36
Table 3.3 Summary of key measures by Broad subject (simple courses) 37
Table 3.4 Summary of key measures by CAH1 (simple courses) 39
Table 3.5 Summary of key measures by CAH2 (simple courses) 44
Table 4.1 Teaching quality and student outcome factors presented to applicants and
students 55
Table 4.2 Ranking of relative importance of teaching quality and student outcome factors among students versus ranking of key drivers of student satisfaction 65
1 Executive Summary
Background and methodology
1.1 The Teaching Excellence and Student Outcomes Framework (TEF) was recently introduced to measure teaching quality and student outcomes across Higher Education (HE) in the UK, with a view to driving up quality, and better inform students when making applications. Ratings (Gold, Silver, Bronze or Provisional) are currently awarded at provider-level, and from 2019-2020 they will also be awarded at subject-level.
1.2 This study is intended to provide evidence to refine the design of subject-level TEF, and more broadly, the teaching quality and student outcomes factors contained within it. As well as informing Government policy development, this research will also be available to the statutory independent reviewer of TEF. In particular the project seeks to answer:
• What is the best subject-level classification that allows students to most effectively identify subject-specific TEF information for course/s they want to study?
• Which teaching quality and student outcomes factors are important to students, and might inform TEF development?
• What is the relative importance of TEF-related factors for students’ choice of HE provider and the quality of student experience?
1.3 To reflect the separate objectives of the study, the research was split into two distinct online surveys. The first (part one) focussed on subject-level classification, and was directed at those applying to an HE undergraduate course starting in 2018/19. The second (part two) focussed on teaching quality and student outcomes, and was directed at both applicants and current students (first and second years). Both surveys also covered current awareness of the TEF. 1.4 Fieldwork took place between 29th November and 22nd December 2017, with a
total of 1,806 responses in part one and 2,035 in part two.
Key findings: Subject classifications
Broad classification (containing 7 subject areas), to establish whether CAH2 is the most useable and preferred classification system by applicants.
1.6 Applicants were shown three different subject classifications; Broad (7 subject areas), CAH1 (23 subject areas) and CAH2 (35 subject areas), and asked which subject area’s TEF award they would pick if they wanted an indication of the quality of their preferred course.
1.7 The survey’s set-up was able to ascertain whether the applicant selected the ‘correct’ subject area for each classification, by linking to a database that mapped courses on to subject areas within each classification. Applicants were then asked how easy they found using the classifications, and whether a TEF award for their chosen subject area would be sufficient to help them choose where to study. Key findings are shown in Figure 1.1.
Figure 1.1 Summary of key subject classification measures
1.8 Within each of the three classifications, the majority of applicants selected the correct subject area for their preferred course. Among those studying simple courses (i.e. courses only classified to one subject area), seven in ten (71%) selected the CAH2 subject area correctly. This compared with 68% correctly selecting their CAH1 subject area, and 66% their Broad subject area. The only
Accuracy
(simple courses) (6-10 / 10)Ease Sufficiency(% ‘Yes’)
30% 28% 36%
Base: Ease and sufficiency: All part one applicants (1,806) Accuracy (simple courses): All part one applicants applying to simple courses (Broad: 1,668; CAH1: 1,628; CAH2: 1,605) Accuracy (complex courses): All part one applicants applying to complex courses (Broad: 138; CAH1: 178; CAH2: 201)
Accuracy (complex courses)
Broad CAH1 CAH2
68%
66% 71%
87%
83% 82%
67%
63% 68%
58%
46%
62%
Broad, i.e. applicants were more likely to select the correct CAH2 subject area compared with their Broad subject area.
1.9 For complex courses (i.e. where courses are classified to more than one subject area), applicants had an option to select more than one subject area.
1.10 Around a third of applicants on complex courses accurately selected all subject areas to which their course belonged (30% Broad, 28% CAH1, 36% CAH2), while more than 80% accurately selected at least one correct subject area using each classification (83% Broad, 87% CAH1, 82% CAH2). There were no statistically significant differences in the proportion of (partial or fully) correct responses across each of the classifications.
1.11 Between 60 and 70% of applicants applying to ‘complex’ courses indicated they would be likely to look up information across multiple subject areas (61% Broad, 64% CAH1, 69% CAH2).
1.12 The majority of applicants (on simple or complex courses) reported that their course was ‘easy’ to classify with little variation by classification (63% Broad, 67% CAH1, 68% CAH2). However, applicants were more likely to find CAH2 ‘very easy’ to use (49%), compared with Broad (41%) and CAH1 (43%).
1.13 Applicants were asked whether a TEF subject award in each classification would provide sufficient information to help them choose where to study. For the Broad classification, 46% of applicants considered the subject sufficient, rising to 58% for CAH1 and 62% for CAH2.
1.14 Overall, the survey results suggest that for applicants, the CAH2 subject
classification is the best performing classification of the three tested. This holds across most subgroups, with some exceptions, although these instances show only minor deviations from the overall pattern. Among older applicants and those
domiciled outside of the UK CAH1 tended to perform slightly better, while among BME applicants and those applying to Medium/Low Tariff universities there was little difference between CAH1 and CAH2.
1.15 Outcomes by subject area varied widely. Looking at the best performing classification, CAH2, for the majority of subject areas, at least two-thirds of
applicants correctly classified their course. Applicants applying to Communications and media (59%), and Sociology, social policy and anthropology (55%) tended to be less accurate, while only one in seven (14%) accurately classified their course to Subjects allied to medicine not otherwise specified. For this subject area, which was designed to incorporate courses such as Therapy, Nutrition, Optometry and
Key findings: Teaching quality and student outcome factors
1.16 In part two of the research, 20 factors relating to teaching quality and studentoutcomes were tested with applicants and students to determine their relative importance. The 20 factors (listed below) can be summarised into the following four groups:
• Teaching staff factors • Course factors
• Graduate outcomes • Wider opportunities.
1.17 Using a MaxDiff trade-off approach1, applicants were asked to consider the
importance of these factors when deciding where to study. Students were asked to consider the importance of these factors in influencing the overall quality of their undergraduate experience.
1.18 The two most important factors for both applicants and students were the likelihood of securing a graduate job, and potential exposure to employers, industry and workplaces. ‘Inspiring and engaging staff’ was the third most important factor for applicants and the fourth most important for students, who considered that the qualification received at the end of the course was slightly more important. The importance of earning potential was considerably higher among students than applicants.
1.19 The table below illustrates the importance of all 20 factors, across applicants and students.
Table 1.1 Importance of factors in determining where to study (applicants) and quality of undergraduate experience (students)
Applicants Students
Base (All) 984 1,050
Whether students get graduate level jobs after they
graduate 2.40 3.02
Whether students are exposed to and involved with
employers, industry and workplace 2.19 1.97
Whether teaching staff are inspiring and engaging 1.94 1.72 Whether there are good resources and facilities
available to students 1.63 1.40
Whether the course leads to a professional
qualification 1.56 1.81
Whether students are able to study a variety of
subjects 1.30 1.18
Whether teaching staff are leading experts in
industry or business 1.28 1.25
Whether students give positive feedback (about the
teaching and experience of studying at that provider) 1.19 0.56 Whether the course boosts students' earning
potential 1.09 1.52
Whether students are exposed to and involved in
cutting edge ideas and research 0.97 0.81
Whether the institution is committed to continuous
improvement in teaching 0.78 0.73
Whether academic standards are rigorous and
stretching 0.68 0.58
Whether students are able to specialise deeply in
one subject 0.66 0.67
Whether students are exposed to and involved in
cutting edge ideas and research 0.58 0.60
Whether students improve their transferable soft
skills 0.55 0.70
Whether teaching staff have high level academic
qualifications such as PhDs 0.30 0.35
Whether students receive a high number of contact
hours 0.29 0.35
[image:11.595.61.515.87.712.2]Whether teaching staff have teaching qualifications 0.28 0.35 Whether students are taught in small class sizes 0.26 0.31 Whether teaching staff are on permanent contracts 0.08 0.11
Table ranked by order of importance attributed among applicants
1.20 There was little variation by gender, ethnicity or social disadvantage of the applicant and student. However, more differences were apparent when looking at the
which the applicant/student applied/belonged. Full analysis of statistically significant sub-groups is provided in Chapter 4.
1.21 By subject of study, for applicants to Business and management (3.35) and Computing (3.27), exposure to industry was the most important factor while for applicants to Law (2.74), and Languages, linguistics and classics (2.55), inspiring and engaging staff was the most important factor.
1.22 Among students studying Economics (4.67) and Business and management (4.31), graduate level jobs were of considerably more importance than for students
studying other subjects. Meanwhile, there were only four subject areas where securing graduate level employment was not considered to be the most important factor for students:
• among those studying Creative arts and design, and Architecture, building and planning, exposure to employers, industry and workplaces was the most
important factor (2.98 and 2.56 respectively);
• for those in the fields of Law, and General and others in sciences, inspiring and engaging teaching staff was considered most important (2.44 and 2.95
respectively).
1.23 When invited, most students and applicants did not propose any new factors that they considered important when deciding where to study or in influencing their undergraduate experience. When new factors were mentioned, the most common were; additional or out-of-hours academic support, a good support system, and feedback and advice on progress.
1.24 Students were also asked how satisfied they were with each factor, and with their HE experience as a whole. Regression analysis was then carried out to determine which factors were key to driving overall satisfaction.
1.25 While there was no single dominant factor driving overall student satisfaction, the top two factors were teaching staff factors; “institutions’ commitment to continuous improvement in teaching”, and “whether or not teaching staff are inspiring and engaging”.
1.26 Factors related to the course itself were also key drivers of overall satisfaction, though less so than teaching factors, including feedback about the course provided by other students, whether or not academic standards are rigorous and stretching, the resources and facilities available, the opportunity to study a range of modules and contact hours.
more immediate factors – such as inspiring teaching or rigorous and stretching course design – have more impact in driving their current levels of satisfaction. It is also worth noting that there were a number of factors which were both considered to be relatively unimportant and did not appear to drive satisfaction, including class size and whether staff had teaching qualifications or were on permanent contracts.
Key findings: Awareness and perceived use of the TEF
1.28 The TEF is a new initiative and this research was undertaken within six months of the first TEF awards being published. At this stage, it was therefore expected that awareness and use of TEF would be low, with a gradual increase expected as the TEF becomes more embedded. Levels of early awareness and actual and intended use of the TEF were captured among applicants in both part one and part two, with few differences across the two surveys. It was expected that knowledge of TEF may be higher in the research sample than the wider applicant sample (see Chapter 5). 1.29 The majority of applicants had heard of the TEF (part one 60%, part two 59%), with
two-fifths reporting that they knew what TEF was about (part one 38%, part two 42%), although this dropped to 21% among those who were yet to submit their application. A small minority (part one 15%, part two 16%) reported they had used or intended to use the TEF to inform their application choice.
1.30 Across all applicants, 23% (part one) and 26% (part two) were aware of the TEF award given to their first-choice institution.
1.31 The majority of applicants (part one 68%, part two 78%) considered that subject-level TEF awards would be useful, with 16% and 35% respectively considering it very useful. Only a small minority (part one 5%, part two 3%) considered they would find subject-level TEF to be of no use at all. There is evidence to suggest that
greater awareness of the TEF award scheme in general would increase applicants’ appreciation for subject-level TEF awards: over eight in ten applicants on both surveys (part one 82%, part two 87%) who were already aware of the TEF
considered subject-level TEF would be useful, rising to nine in 10 applicants who were aware of their preferred institution’s specific TEF award (part one 88%, part two 90%). This demonstrates a strong association between familiarity with the provider-level TEF and appreciation of the usefulness of subject-level TEF.
Conclusions
1.32 Of the subject classifications tested, the research suggests that CAH2 is the optimal classification to take forward for use within subject-level TEF. The study provides evidence that CAH2 offers the greatest accuracy for making subject-level
1.33 Rewording some of the CAH2 subject categories should lead to further improvements in accuracy and a likely positive impact on ease of use and suitability. However, for ‘Subjects allied to medicine’ a wider review is recommended.
1.34 The findings indicate that the Broad subject classification (with 7 subjects) would not be helpful to potential applicants to assist in their decision making, based on its poor performance on sufficiency, as well as issues with accuracy among those applying for courses that should be classified as Humanities, Natural Sciences or Social Sciences.
1.35 The study also highlights a number of teaching quality and student outcome factors that could be considered when further developing subject-level TEF. The trade off and regression analysis produced different factors, reinforcing that it is important in the TEF to consider teaching quality factors that have a short term impact on student satisfaction while undertaking an HE course and those with a longer term impact, linked to graduate outcomes. There were a handful of factors that appeared low on the list of both set of analyses and potentially, from a student perspective, could be deprioritised from subject-level TEF development. This includes teaching staff contracts, class sizes and the academic qualifications of teachers.
1.36 The research also provided an opportunity to measure and benchmark levels of awareness of provider-level TEF among the first group of applicants to have had potential exposure to TEF awards. While TEF is still in its early stages of
implementation, this research represents an early opportunity to establish a baseline for student engagement with the TEF. The study shows that around two-fifths of 2018/19 applicants (part one 38%, part two 42%) were aware of what TEF refers to and around one in eight (part one 15%, part two 16%) had used the TEF to inform their choice of institution, or intended to do so. Around a quarter (part one 23%, part two 26%) were aware of the TEF award given to their first-choice institution. As TEF becomes more embedded, we would expect applicant and student awareness and usage of TEF to grow over time, and the results from this research will form the baseline against which future awareness and student engagement can be measured.
2 Background and methodology
Background
2.1 The Teaching Excellence and Student Outcomes Framework (TEF) has been introduced as part of a suite of wide-ranging reforms within Higher Education (HE) in the UK, with a view to driving up quality of and esteem for teaching, and better informing students’ choices about what and where to study2.
2.2 TEF awards are decided by an independent panel of experts, including academics, students and employer representatives. The HE provider’s undergraduate teaching is assessed against ten criteria that cover areas of teaching quality, learning
environment, student outcomes and learning gain. The TEF panel considers evidence from a set of metrics using national data as well as written evidence submitted by the provider.
2.3 Participating HE providers receive a gold, silver or bronze award reflecting the excellence of their teaching, learning environment and student outcomes. Providers that are eligible but do not yet have sufficient data to be fully assessed are awarded a provisional TEF award. In June 2017, the first TEF awards were assigned to 295 participating HE providers.
2.4 TEF assessments are currently made at provider level. From 2019-2020, following two years of pilots and a technical consultation, TEF assessments will be made at subject level, providing applicants with a better understanding of a provider’s teaching quality and student outcomes in the subject they are looking to study. 2.5 In order to administer the TEF at subject level, a subject classification system is
needed to define what a ‘subject’ is for the purpose of assessment and ratings. Subject classification systems group individual courses and programmes together to different levels of granularity and identify different subject area groups that could be awarded a TEF rating. This research explores three subject classifications:
• Level 2 of the Common Aggregation Hierarchy (CAH2), containing 35 subject areas
• Level 1 (CAH1), containing 23 subject areas; and
• Broad subject group, containing seven subject areas grouped from CAH2. 2.6 The government is currently proposing to use CAH2 as the subject classification
system for Subject-level TEF. The broad system is also proposed for use in the
2 The specification for how the TEF functions can be found here:
assessment process, but not for student-facing ratings or information. This research therefore tests how well CAH2 would work for students, as well as comparing this to CAH1 and the broad classification to test whether the granularity of CAH2 is
preferred. CAH2 and the 7 broad subject groups are also being tested with HE providers in the first year of the subject level pilots.
2.7 In particular, this research project looks to answer:
• What is the best subject-level classification that allows students to most effectively identify subject-specific TEF information for course/s they want to study?
• Which teaching quality and student outcomes factors are important to students, and might inform TEF development?
• What is the relative importance of TEF-related factors for students’ choice of HE provider and the quality of student experience?
Methodology
2.8 In order to meet the breadth of objectives, the study was split into two parts. The first (Part one) was focussed on subject-level classifications and conducted with applicants to an HE undergraduate course starting in 2018/19, while the second (Part two) focussed on teaching quality and student outcome factors and was conducted with both applicants, and HE students (in their first and second year of study). Each part consisted of a 10-minute online survey, with fieldwork taking place between 29th November and 22nd December 2017. This section takes each part in turn.
Part one: Survey sampling
2.9 The target sample consisted of individuals applying to an HE undergraduate course for the 2018/19 academic year.
2.10 Purposive sampling by JACS was undertaken to achieve a spread of interviews by CAH2 subject areas, and to ensure representation by gender, age and domicile3.
2.11 Fieldwork was timed before the application deadline in January 2018, to ensure a mix of individuals who had already submitted their application (applicants), and those who had not submitted an application but were planning on doing so (pre-applicants). This approach was taken to understand whether new applicants might
3 As CAH2 is a new subject classification it does not currently appear on applicant databases. However,
find the process more difficult than those who had already experienced the application process.
2.12 Both applicants and pre-applicants were sourced from the UCAS database, and topped up by an online student / applicant panel provider, YouthSight4. In total there
were 1,806 survey responses, with 156 responses from pre-applicants and 1,650 from applicants. Tables A.1.1-A.1.3 in Appendix A show the breakdown by subject area and key subgroups.
Part one: Survey questionnaire
2.13 Applicants first named the title of their preferred course. This answer was automatically linked to a datafile which determined which subject area (within Broad, CAH1 and CAH2) their preferred course belonged to.
2.14 They were then asked to select the subject area they would look at, to get an indication of the quality of their course. They were shown each of the three
classifications separately (Broad, CAH1, CAH2), with the order in which these were shown rotated by respondent.
2.15 Due to the linked datafile, the applicants’ selected subject area could be marked correct or incorrect. Applicants who chose the incorrect CAH2 subject area were subsequently informed of the correct subject area and asked why they did not select this (to avoid survey fatigue applicants were not asked about incorrect Broad or CAH1 selections). All applicants were also asked how easy they found it to determine which subject area(s) was appropriate for their course, for all three classifications, and whether a TEF award given for the subject area they chose would provide them with a sufficient amount of information to help them choose where to study.
2.16 In this way the survey produced three key measures for determining the usability of each classification: accuracy, ease of use and sufficiency (defined in Chapter 3). In addition, the time it took applicants to make their classification was measured as a comparison marker of the ease and difficulty of using each classification.
2.17 Applicants were also asked about their awareness and use of the provider-level TEF, and whether they would find subject-level TEF useful.
4 UCAS has more than 380 provider customers including Further education colleges (FECs) and alternative
2.18 Before the main survey commenced, a soft launch was used to test applicants’ comprehension of each question and review sampling assumptions in relation to response rates.
Part two: Survey sampling
2.19 The target samples for part two were individuals applying to an HE undergraduate course for the 2018/19 academic year, and current first and second year students. Unlike part one, there was no target sample of pre-applicants. Applicants who had submitted were of more interest as they would be more likely to have a considered view on the importance of teaching quality and student outcome factors and more likely to have used TEF.
2.20 Across both applicants and students, separate targets were set by subject, gender, age and domicile to achieve a sample which was representative of the applicant and student populations.
2.21 Applicants were sourced through a combination of the UCAS database and an online panel provider, YouthSight, while all students were sourced through YouthSight.
2.22 A total of 2,035 individuals were surveyed in part two, split 984 applicants and 1,051 first and second year students. Tables A.1.1-A1.3 in Appendix A present a
breakdown by subject and other key subgroups.
Part two: Survey questionnaire
2.23 A total of 20 teaching quality and student outcome factors were identified prior to the research. These include factors that are already reflected in TEF as well as some factors that have been identified by stakeholders and/or government for potential inclusion in future developments of TEF. These are listed in Chapter 4. 2.24 Applicants were asked which of these teaching factors they considered important
when deciding where to study, while students were asked which factors they considered important when thinking about the quality of their HE experience. A max-diff trade-off approach was used to determine levels of importance, with
respondents presented with 15 screens, each showing separate lists of four random factors and asked to select the most and least important on each screen5. Using
this information, an importance score was calculated algorithmically for each factor. 2.25 Students then rated their satisfaction with each factor based on their experience so
far of HE, on a scale of 0-10. They also rated their satisfaction with their overall
5 For example, if a respondent is presented with four options (A, B, C, D) and chooses B as ‘most
experience of their undergraduate degree. This enabled a regression analysis that determined how important each of the 20 factors were in informing a student’s overall satisfaction. More information on this and the max-diff trade-off analysis is available in Chapter 4.
2.26 Applicants and students were also asked if they could think of other measures relating to teaching quality and student outcomes that they considered important. As in part one – the survey also asked about applicants’ awareness and use of the provider-level TEF, and whether they would find subject-level TEF useful.
2.27 Before the main survey commenced, a soft launch was used to check applicants and students’ comprehension of each question and review sampling assumptions in relation to response rates.
Data preparation
2.28 Both surveys underwent a quality assurance process to determine any evidence of ‘speeding6’, acquiescence bias7 or lack of engagement. As a result of this process,
21 records were removed from the part one datafile, and 19 from part two (all sample size figures and survey results exclude these individuals).
2.29 The abilty to weight the research sample to match the full applicant profile was limited due to small sample sizes for some demographics. If the sample had been fully weighted, this would have introduced errors into the data which would have impacted on the key user-testing research objectives, whilst adding little analytic value.
2.30 Owing to the purposive sampling at subject level, the part one data were weighted to be representative of the subject spread in the applicant population at 1-digit JACS8. Weighting also re-balanced the age profile of respondents, after older
applicants were under-represented in the final file. On part two, because there was no purposive sampling by subject, and the sample profile was close to the applicant and student population profiles, no weighting was applied.
Structure of the report
2.31 The key findings are covered within three broad chapters:
• Chapter 3 explores applicants’ preferred subject-level classification, using the three key measures of accuracy, sufficiency and ease of use.
6 Evidence of respondents completing the survey in an unrealistically quick time (deemed as under two
minutes for these surveys).
7 A form of response bias whereby respondents agree with all or most questions, where relevant. 8 1-digit JACS refers to the letter at the start of each JACS code. See:
• Chapter 4 determines which teaching quality and student outcome factors are most important to applicants when deciding where to apply, which factors are most important to students when considering the quality of their HE experience, and which factors are most strongly tied to overall student satisfaction.
• Chapter 5 captures applicants’ awareness of provider-level TEF and explores how useful they would find subject-level TEF.
2.32 The final chapter (Conclusions) revisits the key findings from the different strands of the research, setting out recommendations where appropriate.
Reporting conventions
2.33 Throughout the report, unweighted base figures are shown on tables and charts to give an indication of the statistical reliability of the figures.
2.34 As a general convention throughout the report, figures with a base size of fewer than 30 applicants/students are not reported, although on charts and tables these figures have been retained for indicative purposes.
2.35 All differences noted are significant to a 95 per cent confidence level unless otherwise stated.
2.36 In some cases, figures in tables and charts may not always add to 100 percent due to rounding (i.e. 99 percent or 101 percent).
3 Subject-level classifications
Introduction
3.1 In order to administer the TEF at subject level, a subject classification system is needed to define what a ‘subject’ is for the purpose of assessment and ratings. One of the key aims of Subject-level TEF is to further inform student choice, allowing prospective students to look behind provider-level ratings and access information and ratings for a specific subject. To achieve this, the subject classification system needs to strike a balance between being meaningful for
students and, on a practical level, having a manageable level of aggregation for the assessment process.
3.2 Three classifications, based on the recently devised Higher Education of Classification of Subjects (HECoS), were proposed for testing in the research:
• Broad subject group, containing seven subject areas;
• Level 1 of the Common Aggregation Hierarchy (CAH1), containing 23 subject areas; and
• Level 2 of the Common Aggregation Hierarchy (CAH2), containing 35 subject areas
3.3 Table 3.1 overleaf contains a breakdown of these subject areas by each classification.
3.4 The research sought to test how the subject classification systems would work for students if they were used to define ratings in subject-level TEF. The suitability of each classification was tested in terms of accuracy, sufficiency and ease of use for applicants. The CAH2 offered the greatest level of granularity of the three, so was expected to be the preferred option of applicants. This part of the study was conducted with individuals applying in 2017/18 to an HE undergraduate course starting in the 2018/19 academic year.
3.5 The three measures used to assess suitability of each of the classification systems were: accuracy: whether applicants selected the correct subject area relating to their preferred course; sufficiency:, whether a TEF award given to the subject area they chose would be sufficient to be able to determine the quality of their preferred course; and ease of use: how easy or difficult they found the process of selecting a subject area. This chapter explores results to each measure, by all three
classifications.
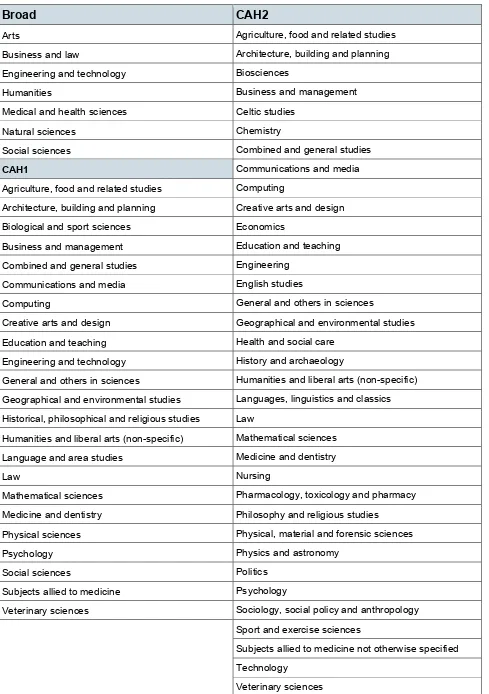
Table 3.1 List of subject areas within each classification
Broad CAH2
Arts Agriculture, food and related studies
Business and law Architecture, building and planning
Engineering and technology Biosciences
Humanities Business and management
Medical and health sciences Celtic studies
Natural sciences Chemistry
Social sciences Combined and general studies
CAH1 Communications and media
Agriculture, food and related studies Computing
Architecture, building and planning Creative arts and design
Biological and sport sciences Economics
Business and management Education and teaching
Combined and general studies Engineering
Communications and media English studies
Computing General and others in sciences
Creative arts and design Geographical and environmental studies
Education and teaching Health and social care
Engineering and technology History and archaeology
General and others in sciences Humanities and liberal arts (non-specific) Geographical and environmental studies Languages, linguistics and classics Historical, philosophical and religious studies Law
Humanities and liberal arts (non-specific) Mathematical sciences
Language and area studies Medicine and dentistry
Law Nursing
Mathematical sciences Pharmacology, toxicology and pharmacy
Medicine and dentistry Philosophy and religious studies
Physical sciences Physical, material and forensic sciences
Psychology Physics and astronomy
Social sciences Politics
Subjects allied to medicine Psychology
Veterinary sciences Sociology, social policy and anthropology
Sport and exercise sciences
Subjects allied to medicine not otherwise specified Technology
Accuracy of subject classifications
3.7 Applicants were asked which subject area they would first look to, to get an indication of the quality of their preferred undergraduate course. Applicants were asked to make these selections using each of the Broad, CAH1 and CAH2 subject-level classifications. The order that these classifications were presented to
applicants was rotated by respondent to mitigate against the possibility of sequencing effects.
3.8 After having selected their first-choice subject area, all applicants were informed that some courses can be categorised into more than one subject area and were then asked to make a second-choice selection.
3.9 For applicants whose preferred course could be classified into three subject areas, they were additionally asked whether there were any further subject areas that they would look to for an indication of course quality.
3.10 It should be noted that the question format as described above could have encouraged applicants to consider further subject areas after making their first choice, when this would not have been their approach in a non-survey setting. Therefore, the core measure for accuracy explored in this section is simply whether applicants were able to correctly classify their preferred course using each of the subject-level classifications on their first-choice selection.
3.11 This section was split by whether applicants’ courses were simple, i.e. their course could only be classified into one subject area, or complex, where it could be
classified into more than one subject area (such as “Politics, Philosophy and Economics”, or “English and Theatre”).
Accuracy: Simple courses
3.12 Across all subject-level classifications, most applicants’ preferred course was classified as ‘simple’ (Broad 93%, CAH1 92%, CAH2 91%).
Figure 3.1 Accuracy of subject classifications: simple courses
3.14 Following their first choice subject area selection, applicants were asked whether there were any other subject areas that they would look at for an indication of the quality of their preferred course. Applicants were given this opportunity in an
attempt to reflect real behaviour; applicants who are unsure might look into different subject areas, regardless of whether they identify (or think they have identified) the correct subject area the first time.
3.15 Around one-third of applicants to simple courses selected the correct subject area on their first choice selection, but then looked up another subject area on their second choice, rather than selecting the response that specified ‘I would not look for any other subject areas relating to my course’ (Broad 30%, CAH1 35%, CAH2 36%). Applicants were more likely to look at a second subject area when using CAH1 and CAH2 compared to Broad, most likely due to the number of alternative subject areas available in these classifications.
3.16 Of those applicants who selected a second subject area using CAH1 and / or CAH2, around two thirds said they would be very or fairly likely to do so (CAH1 66%, CAH2 63%). Fewer applicants who selected a second subject area using Broad said they would be very or fairly likely to look up multiple subject areas for their preferred simple course (Broad 57%).
10% 9% 8%
15% 16% 15%
9% 7%
6%
30% 35% 36%
36% 33% 35%
Broad CAH1 CAH2
First choice correct, second choice correct
First choice correct, second choice incorrect
First choice incorrect, second choice correct
First choice incorrect, second choice incorrect
Don't know
Net: First choice
correct 66% 68% 71%
3.17 A minority of applicants were only able to identify the correct subject area on their second-choice selection (Broad 9%, CAH1 7%, CAH2 6%). These applicants were asked how likely or unlikely they would be to look up information from multiple subject areas. Of the applicants who only identified the correct CAH2 subject area on their second choice, 65% said they would be either very or fairly likely to look up information from multiple subject areas to get an indication of course quality,
suggesting that a further four per cent of all applicants may have eventually located the correct CAH2 subject area. A similar proportion of applicants who selected the correct subject area on their second choice only said they would be either very or fairly likely to look up multiple information from the other classifications (67% across both Broad and CAH1).
Accuracy: complex courses
3.18 A minority of applicants had a preferred course that was ‘complex’; courses that could be classified into two or more subject areas (Broad 7%, CAH1 8%, CAH2 9%).910
3.19 Between one in four (28%) and one in three (36%) correctly classified their complex course to all relevant subject areas (see Figure 3.2).
3.20 Across all classifications, the majority of applicants were able to correctly identify at least one of the subject areas to which their complex course belonged (Broad 84%, CAH1 88%, CAH2 81%).
3.21 In contrast to simple courses, there were no significant differences in the proportion of (partial or fully) correct responses across each of the classifications.
9 Unweighted base sizes of those on complex courses: 138 Broad, 178 CAH1 and 201 CAH2.
Figure 3.2 Accuracy of subject classifications: complex courses
3.22 All applicants to complex courses were asked how likely they would be to look up information across multiple subject areas to gain an indication of the quality of their preferred course.
3.23 As shown in Figure 3.3, around two-thirds reported that they would be very or fairly likely to look at multiple subject areas (Broad 61%, CAH1 64%, CAH2 69%), with no significant difference across the classifications. This suggests that the majority of applicants to complex courses would explore the TEF award for more than one subject area, although it is worth noting that only one in five said they would be ‘very’ likely to do so (Broad 19%, CAH1 20%, CAH2 23%).
17% 13% 18%
53% 59% 46%
30% 28%
36%
Broad CAH1 CAH2
Correct subject classification
Part correct subject classification
Incorrect subject classification
Base: All applicants whose preferred course has at least two subject areas: Broad (138); CAH1 (178); CAH2 (201) Net: Correct / Partial
Figure 3.3 Likelihood to explore multiple subject areas for complex courses
Sufficiency of subject classifications
3.24 Applicants were asked whether a TEF subject award at each of the subject-level classifications would provide a sufficient amount of information to help them choose where to study. As Figure 3.4 shows, applicants were much more likely to find the CAH2 and CAH1 classifications sufficient (62% and 58% respectively), compared to Broad (46%), and were slightly (statistically significantly) more likely to find CAH2 sufficient compared to CAH1.
5% 7% 7%
13% 5% 6%
21%
24% 18%
42% 44%
46%
19% 20% 23%
Broad CAH1 CAH2
Very likely
Fairly likely
Not so likely
Not at all likely
Don't know
Net: Very/fairly likely 61% 64% 69%
Figure 3.4 Whether subject classifications provide a sufficient amount of information to help applicants choose where to study
Usability of subject classifications
3.25 Applicants were asked to rate on a scale of 0-10 how easy or difficult they found it to identify the subject area(s) for their preferred course, using each of the subject-level classifications. At the time of answering they were not aware whether they had correctly or incorrectly selected the subject area of their preferred course.
3.26 The majority of applicants considered making classifications to subject areas ‘easy’ across all classifications (giving a score of 6/10 or greater); applicants were more likely to find CAH1 (67%) and CAH2 (68%) easier to use than Broad (63%). There were no differences by course complexity.
Base: All applicants (1,806)
46%
29%
25%
Broad CAH1 CAH2
58% 16%
25%
Yes No Don't know
62%
12%
Figure 3.5 Ease of subject classification use
3.27 There were a few types or groups of applicants who were more likely to find certain or all classifications ‘difficult’ to use (rating 0-5 / 10):
• Female applicants were more likely to rate each of the classifications as ‘difficult’ to use compared to male applicants (Broad: females – 35%, males – 28%; CAH1: female – 29%, male – 24%; CAH2: female – 28%, male – 22%). • Applicants from a White background were more likely to find the Broad
classification difficult to use, compared to applicants from a BME background (White: 34%; BME: 28%).
• Younger applicants were more likely to find Broad more difficult to use, compared to older applicants (aged under 19 years: 34%; aged 19 years and above: 29%).
• UK-based applicants were more likely to find each of the Broad and CAH1 classifications difficult to use, compared to applicants based outside of the UK (Broad: UK-based – 34%, non-UK – 24%; CAH1: UK-based – 29%, non-UK – 21%).
• Applicants to a distance learning course were more likely to find CAH2 difficult to use (33%), compared to applicants to a non-distance learning course (25%).
15% 11% 12% 17%
17% 15%
22%
24%
19%
41% 43%
49%
Broad CAH1 CAH2
Net: 8-10 (very easy)
Net: 6-7
Net: 4-5
Net: 0-3 (very difficult)
Net: Easy (6-10) 63% 67% 68%
Net: Difficult (0-5) 32% 27% 26%
3.28 In addition to the accuracy of classification responses, the survey recorded how long applicants took to select the corresponding subject area for their preferred course, using each of the classification systems. The time taken to select subject areas also offers an indication of the usability of the classification systems. 3.29 Applicants were quickest in making their first-choice subject area classifications
using Broad (median: 14 seconds), followed by CAH2 (17 seconds) and then CAH1 (19 seconds).
3.30 It is unsurprising that applicants spent the shortest amount of time selecting their Broad subject area, given there are only seven options within this classification. However, the fact that applicants were slightly quicker using CAH2 than CAH1 despite the longer list of subject areas, suggests the additional granularity enables applicants to spot their relevant subject area more quickly.
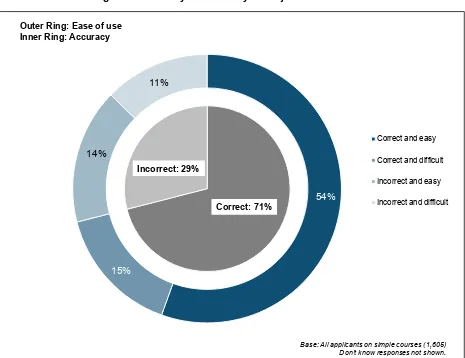
Usability vs. accuracy of CAH2 subject classifications
3.31 Based on the three measures outlined, CAH2 appears to be the most suitablesubject classification to take forward for use in subject-level TEF: applicants were most likely to classify their course accurately using this classification (if ‘simple’), the majority found it easy to use and they were also more likely to report that it gave them a sufficient amount of information to decide where to study compared to other classifications.
3.32 This section therefore explores the interaction between the accuracy of making subject area classifications for simple courses using CAH2 and the perceived ease of using this classification. Differences by applicant subgroup are also explored in this section.
Figure 3.6 Usability vs. accuracy of subject classifications
Correct and difficult
3.34 A small but notable proportion of applicants, 15%, identified the correct CAH2 subject area for their preferred course but rated doing so as ‘difficult’ (a score of 0-5 / 10).
3.35 Pre-applicants were more likely to respond in this way, compared to applicants (Pre-applicants 23%, applicants 14%).
3.36 Applicants who were aware of the TEF but not aware of their institution’s award were more likely to select the correct subject area but find it difficult (18%),
compared to applicants who were aware of the TEF and of their institution’s award (11%).
3.37 There were no other subgroup differences among those who selected the correct CAH2 subject area, but found it difficult.
Incorrect and easy
3.38 Around one in seven (14%) applicants incorrectly identified the CAH2 subject area for their preferred course, but rated CAH2 as ‘easy’ to use.
Correct and easy
Correct and difficult
Incorrect and easy
Incorrect and difficult
Base: All applicants on simple courses (1,605) Don’t know responses not shown. Incorrect: 29%
Correct: 71% 54%
14%
15%
11%
3.39 Applicants who applied to a Higher Education provider with a medium / low UCAS tariff were more likely to select the incorrect CAH2 subject area and rate the
process as easy, compared to applicants who applied to Higher Education provider with a high tariff (Medium/low 18%, high 10%).
3.40 Female applicants were more likely to select the incorrect CAH2 subject area and rate the process as easy, compared to male applicants (females 16%, males 11%). 3.41 Distance learners (20%) were also more likely to select the incorrect CAH2 subject
area and rate the process as easy, compared to non-distance learners (13%). 3.42 Applicants to HE providers in Wales, England and Northern Ireland were more likely
to select the incorrect CAH2 subject area but find it easy to do so, compared to applicants to Higher Education providers in Scotland (Wales 20%, England 15%, Northern Ireland 13%, Scotland 3%).
Subject-specific analysis: Broad classification system
3.43 The next few subsections explore differences in accuracy, ease of use, andperceived sufficiency, by subject area for simple courses, across each of the classification systems, starting with the Broad classification.
Accuracy by subject: Broad
3.44 Overall, two-thirds of applicants (66%) were able to select the correct Broad subject area on their first choice selection and a further nine per cent correctly identified on their second choice selection. A quarter of applicants (25%) were unable to select the correct Broad subject area on either their first or second choice.
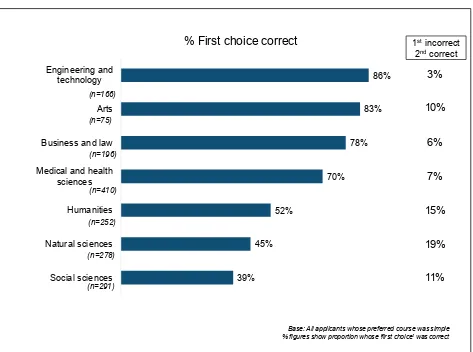
Figure 3.7 Proportion of applicants accurately classifying to correct Broad subject area
3.46 Exploring those subjects with poorer outcomes:
• Of those whose preferred course fit within the Humanities subject area, 52% classified this correctly.
o Around one in eight applicants (15%) to a Humanities course made the correct classification on their second choice only. Most of these applicants (75%) said they would either be very or fairly likely to look up information from multiple CAH2 subject areas.
o One-fifth (21%) of Humanities applicants incorrectly classified their preferred course as Arts, while a further 13% classified their course as Social sciences.
• Of those whose preferred course fit within the Natural sciences subject area, just under half (45%) selected the correct classification.
o Nearly one in five applicants (19%) to a Natural sciences course made the correct classification on their second choice only. Around half (54%) of these applicants said that they would be very or fairly likely to look up information from multiple CAH2 subject areas.
39% 45%
52%
70% 78%
83% 86%
Social sciences Natural sciences Humanities Medical and health
sciences Business and law
Arts Engineering and
technology
Base: All applicants whose preferred course was simple % figures show proportion whose ‘first choice’ was correct (n=166)
(n=75)
(n=196)
(n=410)
(n=252)
(n=278)
(n=291)
3%
10%
6%
7%
15%
19%
11%
1stincorrect
2ndcorrect
o Over a quarter (27%) of Natural sciences applicants incorrectly classified their course as Medical and health sciences, with a further nine per cent classifying their course as Engineering and technology.
• Around two-fifths (39%) of applicants whose preferred course fit within Social
sciences selected the correct subject area.
o Around one in nine (11%) applicants to a Social sciences course made the correct classification on their second choice only. Just over half of these applicants (58%) said they would be fairly or very likely to look up
information from multiple subject areas.
o A variety of incorrect subject areas was chosen among Social science applicants, with Humanities (17%) the most likely to be selected. A
relatively high proportion of applicants (17%) said they did not know how to classify their Social sciences course.
Incorrect classifications: Broad
3.47 This section looks at which types of courses applicants incorrectly placed in the Broad classification system. Table 3.2 shows each course categorised into CAH2, and how applicants placed the course in the Broad subject area classification (NB this table shows those on simple courses only). The ‘correct’ classification for each CAH2 is highlighted in blue. The table shows all CAH2 subject areas, but note there are low base sizes across some of these subject areas.
3.48 Particular areas of difficulty, highlighted in red in Table 3.2 included:
• Applicants to Architecture, building and planning courses; while this was a relatively low base (n=29), only a tiny minority (3%) were able to make the correct classification to Social sciences. The remainder of applicants selected Arts (45%) and Engineering and technology (47%).
• Applicants to a Biosciences course; one-third (32%) classified this correctly as Natural sciences, whereas a half (55%) incorrectly classified it as Medical and health sciences.
• Applicants to a Communications and media course; just 11% correctly
classified this to Humanities. Arts was incorrectly selected by 38% of applicants, while Social sciences was selected by 27% of applicants.
• Applicants to Economics courses; the majority (62%) correctly classified their course to Social sciences, however there was a sizeable minority (32%) who classified their course to Business and law.
• Applicants to an English studies course; the majority (60%) correctly classified their course to Social sciences, however there was a sizeable minority (25%) who classified their course to Arts.
• Applicants to Geographical and environmental studies; only nine per cent correctly classified their course to Social Sciences, with the majority selecting either Natural sciences (48%) or Humanities (37%).
• Applicants to Mathematical sciences; only a third (34%) correctly classified this to Natural Sciences. A further 28% incorrectly classified it as Engineering and technology.
• Applicants to Politics course; around half (51%) correctly classified their course to Social sciences, but a third (33%) incorrectly classified their course to
Humanities.
Table 3.2 Classification of each CAH2 subject area (simple courses) to Broad subject area
First correct CAH2
Showing row percentages
Cells in blue refer to the correct Broad subject; those in red refer to incorrect Broad subject areas selected by ≥20% of
applicants, where the unweighted sample size is ≥30.
Base Art s B usi ness an d l aw En gi ne er in g & te ch no lo gy H um an iti es M ed ical & h eal th sci en ce s N at ur al sci en ces So ci al sci en ces D on 't k no w
Agriculture, food and related studies 16 4% 4% 55% 22% 15%
Architecture, building and planning 29 45% 47% 3% 6%
Biosciences 82 3% 1% 55% 32% 1% 8%
Business and management 122 2% 81% 2% 2% 5% 8%
Chemistry 42 9% 18% 56% 17%
Combined and general studies 7 16% 32% 19% 32%
Communications and media 34 38% 8% 2% 11% 27% 14%
Computing 80 5% 5% 78% 1% 11%
Creative arts and design 75 83% 1% 8% 4% 5%
Economics 47 32% 3% 62% 2%
Education and teaching 51 7% 2% 16% 3% 24% 48%
Engineering 82 2% 92% 1% 1% 5%
English studies 48 25% 60% 8% 8%
Geographical & environmental studies 46 2% 37% 48% 9% 5%
Health and social care 14 8% 7% 43% 42%
History and archaeology 64 1 1% 81% 1% 4% 3%
Humanities & liberal arts (non-specific) 2 50% 50%
Languages, linguistics and classics 57 14% 2% 62% 10% 13%
Law 70 1% 70% 11% 7% 11%
Mathematical sciences 61 1% 7% 28% 34% 12% 18%
Medicine and dentistry 88 1% 3% 91% 5%
Nursing 61 1% 88% 1% 3% 7%
Pharmacology, toxicology & pharmacy 21 4% 85% 4% 7%
Philosophy and religious studies 23 6% 17% 77%
Physical, material & forensic sciences 19 5% 11% 5% 68% 5% 5%
Physics and astronomy 49 12% 81% 2% 5%
Politics 42 1% 11% 33% 51% 5%
Psychology 97 1% 1% 3% 20% 5% 60% 11%
Sociology, social policy & anthropology 34 7% 11% 78% 4%
Sport and exercise sciences 23 3% 3% 37% 8% 16% 33%
Subjects allied to medicine not
otherwise specified 78 1% 1% 1% 76% 2% 6% 14%
Technology 4 74% 26%
Veterinary sciences 37 75% 13% 12%
Ease of use and sufficiency by subject: Broad
3.49 In line with the accuracy outcomes, those applying to a Humanities (38%) or Natural sciences (36%) course were least likely to report that the Broad classification
provided them with a sufficient amount of information to help them choose where to study (compared with an overall figure of 46%).
3.50 In terms of ease of use, once again those applying to a Humanities course were least likely to report that the Broad classification was easy to use (54% compared with 63% overall). Table 3.3 presents the key measures by Broad subject.
Table 3.3 Summary of key measures by Broad subject (simple courses)
Preferred Broad Base Accuracy Easy to use (6-10/10) use (0-5/10) Sufficient Difficult to
Engineering and technology 166 % 86 74 16 45
Arts 75 % 83 67 29 47
Business and law 196 % 78 66 31 53
Medical and health sciences 410 % 70 63 33 48
Humanities 252 % 52 52 44 38
Natural sciences 278 % 45 61 33 36
Social sciences 291 % 39 60 36 48
Figures are based on simple courses only.
Subject-specific analysis: CAH1 classification system
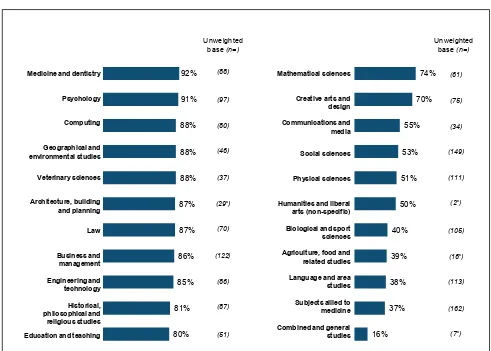
Accuracy by subject: CAH1
3.51 The majority of applicants were able to select the correct CAH1 classification for their preferred simple course, on the first selection (68%). A further seven per cent of applicants were able to identify the correct CAH1 on their second choice
selection, while one quarter (25%) were not able to select the correct classification on either their first or second choice selection.
3.52 Applicants were most accurate in selecting Medicine and dentistry courses (92%), followed by Psychology (91%), Computing, Geographical and environmental studies, and Veterinary sciences (88% each).
3.53 There were a handful of subject areas that were particularly difficult for applicants to identify. Among subject areas with a base of at least 30, less than half were able to correctly classify to the following subject areas: Biological and sports sciences course (40%), Language and area studies (38%), and Subjects allied to medicine (37%).
Figure 3.8 Proportion of applicants accurately classifying to correct CAH1 subject area
Ease of use and sufficiency by subject: CAH1
3.55 The proportion citing that CAH1 was a sufficient form of classification ranged from 43% to 78% by subject area (against an average of 58%). The two CAH1 subject areas lower than average were Language and area studies, and Physical sciences (both 49%)11.
3.56 Ease of use scores ranged more widely; of those with a base size of at least 30, applicants to Biological and sport sciences (58%), Social sciences (59%), Subjects allied to medicine (61%) courses all returned lower scores than average for CAH1 (67%). Table 3.4 presents the key measures by CAH1.
11 Agriculture, food and related studies returned a sufficiency measure of 43%, but as the base is 16 the
16% 37% 38% 39% 40% 50% 51% 53% 55% 70% 74% 80% 81% 85% 86% 87% 87% 88% 88% 88% 91% 92%
Base: All applicants on simple courses. Unweighted base size in brackets. *=very low base <30. No applicants among the survey sample had a preferred CAH1 course that fitted into ‘General and others in sciences’.
Unweighted base (n=) Unweighted
base (n=)
Medicine and dentistry
Psychology Computing Geographical and environmental studies Veterinary sciences Architecture, building and planning Law Business and management Engineering and technology Historical, philosophical and religious studies Education and teaching
Mathematical sciences
Creative arts and design
Communications and media
Social sciences
Physical sciences
Humanities and liberal arts (non-specific)
Biological and sport sciences
Agriculture, food and related studies
Language and area studies
Subjects allied to medicine
Table 3.4 Summary of key measures by CAH1 (simple courses)
Preferred CAH1 Base Accuracy Easy to use (6-10/10) use (0-5/10) Sufficient Difficult to
Medicine and dentistry 88 % 92 85 10 41
Psychology 97 % 91 72 26 47
Computing 80 % 88 78 12 36
Geographical and
environmental studies 46 % 88 85 13 42
Veterinary sciences 37 % 88 74 15 42
Architecture, building and
planning 29 % 87 83 14 54
Law 70 % 87 82 18 60
Business and management 122 % 86 64 28 50
Engineering and technology 86 % 85 75 17 51
Historical, philosophical and
religious studies 87 % 81 78 21 38
Education and teaching 51 % 80 71 24 44
Mathematical sciences 61 % 74 76 23 22
Creative arts and design 75 % 70 65 28 47
Communications and media 34 % 55 54 42 44
Social sciences 149 % 53 59 36 50
Physical sciences 111 % 51 70 24 33
Humanities and liberal arts
(non-specific) 2 % 50 0 50 50
Biological and sport sciences 105 % 40 58 35 41
Agriculture, food and related
studies 16 % 39 43 41 43
Language and area studies 113 % 38 65 32 35
Subjects allied to medicine 162 % 37 60 36 53
Combined and general studies 7 % 16 25 59 25
General and others in sciences - % - - - -
Figures are based on simple courses only.
Subject-specific analysis: CAH2 classification system
Accuracy by subject: CAH2
3.58 The majority of applicants were able to correctly identify the CAH2 subject area for their preferred course; for 21 of 33 subject areas, at least 70% of applicants were able to correctly classify their course12. Among subject areas with a base of at least 30, applicants to Communications and media (59%), Sociology, social policy and anthropology (55%) and Subjects allied to medicine not otherwise specified (14%) courses struggled most to classify to the correct CAH2, as Figure 3.9 shows.
3.59 Although at an overall level the majority of applicants were able to select the correct CAH2 subject area, around one third of applicants each to Biosciences (33%), Creative arts and design (37%) and Nursing (38%) courses were not able to select the correct CAH2 for their preferred course.
Figure 3.9 Proportion of applicants accurately classifying to correct CAH2 subject area
12 The sample of applicants had preferred courses that could be mapped onto 33 of the 35 CAH2 subject
areas. No applicants in the sample had a preferred course that mapped onto CAH2 subject area ‘Celtic 0% 0% 14% 15% 16% 42% 50% 55% 59% 62% 63% 67% 70% 75% 76% 76% 77% 79% 80% 80% 83% 83% 84% 85% 85% 86% 86% 86% 87% 87% 88% 88% 91%
Base: All applicants on simple courses. Unweighted base size in brackets. *=very low base <30. No applicants among the survey sample had a preferred CAH2 course that fitted into ‘Celtic studies’ or ‘General and others in sciences’. Veterinary sciences
Sport and exercise sciences Geographical and environmental studies Architecture, building and planning English studies
Computing
Economics
History and archaeology
Pharmacology, toxicology and pharmacy Chemistry
Medicine and dentistry
Psychology
Physics and astronomy
Business and management
Education and teaching
Law Mathematical sciences
Philosophy and religious studies Engineering Politics
Languages, linguistics and classics Biosciences Creative Arts and design
Nursing Communications and media Sociology, social policy and
anthropology Humanities and liberal arts (non-specific) Health and social care Physical, material and forensic
sciences Agriculture, food and related studies Subjects allied to medicine not
otherwise specified Technology Combined and general studies
Incorrect classifications: CAH2
3.60 Figure 3.10 shows the varied classification routes made by applicants to the following courses: Nursing; Communications and media; Sociology, social policy and anthropology; and Subjects allied to medicine not otherwise specified.
• Six in ten (62%) applicants to a Nursing course correctly selected this CAH2 subject area. Despite this, around a quarter (23%) incorrectly identified their course as belonging to Health and social care.
• Among applicants whose preferred course fitted into Communications and
media, around six in ten (59%) selected the correct CAH2 subject area. Despite
this, a range of other subject areas were chosen, with Creative arts and design (10%) and Combined and general studies (8%) most commonly selected. • Among applicants whose preferred course fitted into Sociology, social policy
and anthropology, just over half (55%) selected the correct CAH2 subject
area. A range of other subject areas were chosen; the most common incorrect subject area was Humanities and liberal arts (non-specific) (14%).
• Among applicants whose preferred course fitted into Subjects allied to
medicine, jus