A Priority-based Processor Sharing Model for TDM
Passive Optical Networks
Yan Wang, Moshe Zukerman,
Fellow, IEEE
, Ronald G. Addie,
Member, IEEE
, Sammy Chan,
Member, IEEE
and
Richard J. Harris,
Senior Member, IEEE
Abstract—The use of passive optical networks (PONs) enables access rates of multi-Gbit/sec bandwidth and provision of quality of service for high definition multimedia services. In this pa-per, we consider and analyse a generic multi-priority dynamic bandwidth allocation (DBA) algorithm for TDM PONs serving multimedia traffic in an upstream link. PON traffic is served strictly according to its priority. We consider this DBA algorithm using two approaches: (i) the algorithm assigns a fixed service quantum to each priority service and (ii) different service quanta are assigned to different priority services. The mean message delay is evaluated using a multiqueue processor sharing (MPS) model and an MPS with Heterogeneous Traffic (MPS-HT) model for the two approaches respectively. The MPS model is a classical processor sharing model limited by the critical assumption that there is egalitarian service sharing among all users, which is inefficient for multimedia applications in PONs. We extend the MPS model to a general MPS-HT model that enables the analysis of message delay performance in the case where the service quanta may be different for different services.
Index Terms—Passive optical network (PON), dynamic band-width allocation (DBA), multimedia traffic, performance evalua-tion, service quanta, delay.
I. INTRODUCTION
A passive optical network (PON) is a point-to-multipoint access network laid between a central office (CO) of the network provider and customer premises. It consists of an optical line terminal (OLT) located at the CO, multiple optical network units (ONUs) at customer premises, and the fibers and passive optical splitters between them, forming the optical distribution network in a tree topology [1].
With the proliferation of multimedia applications in the Internet and advanced broadband technologies, subscribers are willing to pay more for more bandwidth to obtain better quality of service (QoS) from network operators. Within the access network, this growth in traffic demand is well addressed by
Manuscript received 15 August 2009; revised 29 January 2010. This work was supported by a grant from the Research Grants Council of the Hong Kong Special Administrative Region, China [Project No. CityU 111208].
Y. Wang is with the School of Electrical and Computer Engineering, RMIT University, Victoria 3000, Australia (email: [email protected]).
M. Zukerman and S. Chan are with the Department of Electronic Engi-neering, City University of Hong Kong, Kowloon, Hong Kong (email:{m.zu, eeschan}@cityu.edu.hk).
R. G. Addie is with the Department of Mathematics and Computing, University of Southern Queensland, Queensland 4350, Australia (email: [email protected]).
R. J. Harris is with the School of Engineering and Advanced Technology, Massey University, Palmerston North 5301, New Zealand (email:[email protected]).
The corresponding author of this paper is S. Chan.
PONs. The use of optical fibre enables PONs to provide higher bandwidth than that of wireless technologies such as WiFi or WiMAX. Also, because of the shared passive optical network architecture and no active elements at public premises, its relatively low establishment and operating cost makes PONs economically viable.
The International Telecommunication Union - Telecommu-nication Standardization Sector (ITU-T) and the IEEE Ethernet in the First Mile Task Force (IEEE EFM TF) have worked in parallel to develop their standards for PONs. The ITU-T first released the G.983.x series of recommendations [2] to specify the asynchronous transfer mode (ATM)-based PON (APON) and its enhanced version, Broadband PON (BPON). Both APON and BPON employ ATM cells to encapsulate the data transmitted between the OLT and ONUs. Later on, BPON evolved to Gigabit PON (GPON) under recommendation series G.984.x [3]. Two major improvements in progressing from BPON to GPON are higher data rates and better support of layer 2 protocols. The maximum transmission speed over GPON is 2.448 Gb/s for both upstream and downstream flows. Other than ATM cells, GPON supports Ethernet frames by using the GPON-encapsulation-method (GEM) frames. From the IEEE 802.3 working group, they have completed the IEEE 802.3ah standard [4] for Ethernet PONs (EPONs), which carry Ethernet frames with a 1 Gb/s symmetric transmission speed. Currently, under different standards, EPON and GPON are the commonly adopted technologies. A summary and comparison of these two PON technologies can be found in [5], [6].
All these PON technologies fall under the category of time division multiplexed (TDM) PONs where access to the medium is shared based on allocation of different time-slots to different users [7]. Due to the point-to-multipoint architecture, the transmission modes of downstream and upstream traffic are different. In the downstream mode, a wavelength is used to transmit data from the OLT to different ONUs during different time-slots. Data is broadcast to each ONU and each ONU reads only the data destined for it according to the packet’s logical link ID (LLID). In the upstream direction, another wavelength is shared among all ONUs to send data to the OLT. Since only one ONU is permitted to transmit data during a time-slot, a medium access control (MAC) protocol is required to arbitrate the access to the shared upstream link by multiple ONUs. The OLT is responsible for this access control by assigning time-slots to individual ONUs for upstream transmission.
re-quirements and utilize the bandwidth efficiently, a dynamic bandwidth allocation (DBA) algorithm is needed in the MAC protocol [8], [9]. However, DBA algorithms are not specified in the standards to give vendors/network operators flexibility to implement their preferred algorithms.
In general, there are two forms of DBA: status-reporting (SR) and non-status reporting (NSR). As there is no infor-mation about the ONU queues in NSR DBA, the system performance can be very poor. In SR DBA, the OLT polls ONUs for the queue status of each ONU traffic class and allocates bandwidth based on the reporting messages received. In EPON, the multipoint control protocol (MPCP) was devel-oped for the MAC layer to enable the implementation of DBA algorithms [10]. MPCP is only a handshaking procedure with two messages:REPORTandGATE. The REPORT message is sent by the ONU with a request for the number of time-slots that the ONU needs. The GATE message is sent by the OLT with a grant of the transmission start time and duration to the corresponding ONU. For the status-reporting mechanism of GPONs, readers are referred to [11] for a detailed description. Due to control message formats and guard times are different for the EPON and GPON standards, research on DBA algo-rithms were mostly focus on either EPON or GPON.
For EPON, Kramer et al.[12], [13], [14] proposed a DBA algorithm, called Interleaved Polling with Adaptive Cycle Time (IPACT). The bandwidth is dynamically distributed based upon the results of interleaved polling. There is a difficulty in providing heterogeneous traffic QoS guarantees. To handle demands in a multi-service environment, a differen-tiation between services for QoS provision has been introduced in some DBA algorithms. Maet al.[15] proposed a bandwidth guaranteed polling (BGP) scheme by dividing ONUs into two groups, those with guaranteed service and those with best-effort service respectively. Zhang et al. [16] developed a deterministic effective bandwidth - generalized processor sharing (DEB-GPS) scheduler to manage ONU flows. Each flow owns either a QoS queue or a best effort queue. In order to guarantee an upper bound on the delay for high-priority traffic, Kamal et al. [17] proposed a scheme which provides separate GATE messages for different priority classes. A DBA algorithm was proposed for multimedia traffic by Choi and Huh [18]. Strict priority queueing and control message formats were introduced to handle classified bandwidth using MPCP. Bandwidth is allocated to each flow of the ONUs which is assigned one of three priorities (high, medium and low) and prioritized scheduling is performed at the OLT level. Pereira et al.[19] proposed a novel scheduling policy, called Proportional Sharing with Load Reservation, which provides bandwidth guarantees on a per-flow basis and redistributes the unused bandwidth among active flows according to their priority levels. Moreover, based on [20], the bounds for the backlog and delay on a per-flow basis have been derived, thus enabling a network to support multimedia traffic with absolute performance guarantees. When strict priority scheduling is deployed, low priority queues may be starved by high priority queues. To alleviate this problem, Krameret al.[21] proposed a two-stage queueing scheme in which packets are put in the second stage after a REPORT message is sent. Upon the
receipt of a GATE message, the second stage is served first. In [22], this technique is combined with a bandwidth guaranteed polling strategy to form a hierarchical scheduling scheme to support differentiated services. Dhaini et al. [23] proposed a DBA scheme based on the Deficit Weighted Round Robin service discipline to ensure fairness among different traffic classes. In the intra-ONU scheduling scheme proposed by Zhu
et al. [24], packets are scheduled according to their delay bound requirements. Whenever it is not urgent to transmit the delay-sensitive packets, packets of best-effort traffic are scheduled first. Assi et al.[25] suggested a fixed cycle time-based DBA for QoS and a prioritized scheduling that is per-formed at the ONU level. Xieet al.[26] proposed a two-layer DBA scheme with a weight-based priority implementation and service differentiation to handle bandwidth demands of all ONUs. A comprehensive survey of EPON DBA algorithms has been provided in [27].
Compared with the research work conducted on DBA over EPON, publications that report on GPON DBAs are few. In [28], a DBA scheme using a new procedure for bandwidth reporting and a novel balance transferring mechanism was proposed for the GPON upstream link resource sharing by differentiated services. In [29], candidate technologies for next-generation PONs were evaluated from the perspective of bandwidth allocation.
In this paper, we consider and analyse a generic multi-priority DBA algorithm for TDM PONs serving multimedia traffic in the upstream link. Our approach can be applied in EPONs or GPONs. The algorithm is only based on status reporting. An ONU assigns different traffic types to different priorities and queues packets on a per-connection basis. Based on the reported queue status rather than queue sizes of each queue, the DBA algorithm executed at the OLT schedules the transmission times of packets from different connections. Traffic is served strictly according to its priority. We consider this DBA algorithm using two approaches. In the first one, the algorithm assigns a fixed service quantum (i.e. a fixed number of time-slots) to each priority service. In the second one, a different service quantum is allocated to different priority services. We then analyse the delay performance using a multiqueue processor sharing (MPS) model [30] and an MPS with Heterogeneous Traffic (MPS-HT) model for the two approaches respectively. Our new MPS-HT model is an extension of the MPS model, where users of different priorities receive a different amount of service at a given time instead of a fixed service portion as in the MPS model. An accurate closed-form approximation for the mean message delay is provided. Given that our closed-form approximation is simple, easily computable and captures traffic heterogeneity, it can be incorporated as part of a connection admission function and can be useful for PON dimensioning. Note that the term
message refers to an application layer data-unit (e.g., http transaction or a video frame) which is broken down into a number of packets for transmission. In this way, we focus on user-perceived delay performance of admitted connections.
provide certain guarantees. The difference of these schemes is the way to determine the grant bandwidth for service classes. The performance analyses of these algorithms were based only on simulation studies. Such an approach normally requires a dynamic bandwidth allocation scheme that resembles a connection admission control (CAC) at the access. The benefit of such a scheme is that the access rate can be guaranteed for admitted calls. However, one drawback is that such a guarantee does not extend beyond the access point and calls may still suffer loss and delay elsewhere in the network. Furthermore, so far the Internet community has applied an approach that resembles processor sharing rather than that used in traditional telecommunication networks’CAC whereas our approach is essentially a compromise between these two approaches. For example, in [22], the guaranteeing bandwidth at the access does not always guarantee end-to-end QoS. However, since the bottleneck often occurs at the access, guaranteeing bandwidth at this point has its advantages. The scheme of [22] involves a cyclic scheduler whilst in our proposal we consider a processor sharing. Fundamentally, a processor sharing will provide better fairness over small time scales. However, if QoS is not compromised under the cyclic scheduler scheme, this may not be a significant advantage. The performance in [22] was studied via simulation. We aim here for an analytical solution and therefore our model is made simpler than the system of [22] for tractability.
The remainder of this paper is organized as follows. We describe a connection-oriented QoS architecture in the PON MAC layer involving service differentiation in Section II. Section III describes a generic priority-based DBA algorithm using a fixed service quantum. The MPS model is introduced to analyse the delay performance. In Section IV, we provide a range of numerical results of the DBA algorithm. In Section V, we improve on the DBA algorithm by using different service quanta and provide an analysis that leads to an accurate evaluation of the mean message delay, which is then validated using simulation. Conclusions are presented in Section VI.
II. QOSARCHITECTURE INPON MAC
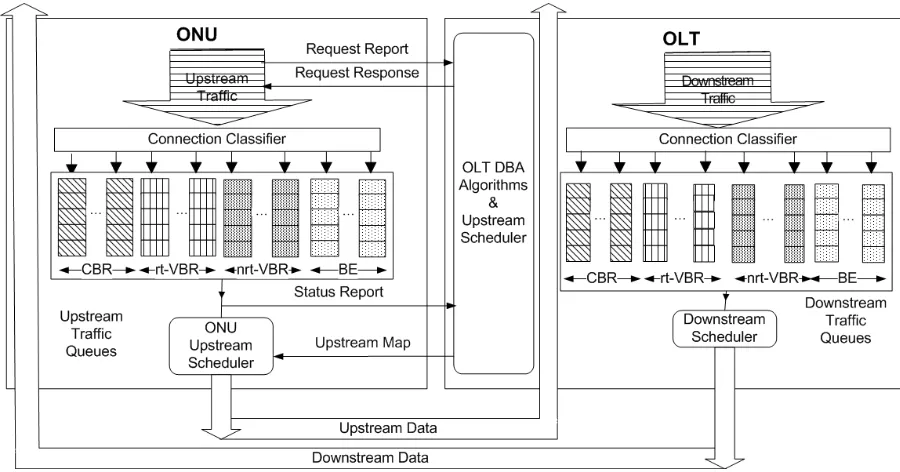
PONs provide QoS at the MAC layer. Fig. 1 depicts our proposed MAC QoS architecture in which a new connection needs to be policed based on the initialised request. Before a logical connection can be established between an ONU and an OLT, the ONU sends a connection request message to the OLT. The request includes the traffic characteristics and QoS-related information such as the requested bandwidth and the maximum tolerable delay. Each established connection will be assigned a unique LLID by the OLT, which will be used in status reports at the MAC layer and in the MAC proto-col data-unit (PDU) headers. Then, source policing enforces the incoming traffic to be compliant with the characteristics specified in the traffic contract.
For service differentiation, we define four PON traffic classes: constant-bit-rate (CBR) service, real-time variable-bit-rate (rt-VBR) service, non-real-time variable-variable-bit-rate (nrt-VBR) service, and best effort (BE) service. The main charac-teristics of these service classes are briefly reviewed below:
• CBRis designed to support real-time applications with a
constant bandwidth requirement, such as T1/E1 and VoIP without silence suppression.
• rt-VBRis designed to support real-time applications with
variable bit rates, such as Moving Pictures Expert Group (MPEG) video and VoIP with silence suppression.
• nrt-VBRis designed for applications without any specific
delay requirement but with the need for a minimum amount of bandwidth.
• BE is designed for applications that are delay-tolerant
and do not require a minimum bandwidth.
The four classes of traffic can be managed by means of the differentiated services (DiffServ) architecture [31] which allows traffic streams to be given different treatment from each other by a great variety of mechanisms. It allows our own defining mechanism. The term used to describe the DiffServ treatment at each ONU/OLT is ”Per Hop Behaviour” (PHB). This could be achieved by assigning DiffServ tags to IP packets in accordance with the four categories of traffic we refer to – CBR, rt-VBR, nrt-VBR and BE.
Since multiple ONUs share a single uplink, only one ONU is permitted to transmit at any given time. To achieve such an exclusive access at any time, each ONU needs to be granted time-slots before it can transmit. A polling mechanism is de-ployed to allow each ONU to report the traffic backlog of each connection. Based on the status report of each connection, the DBA algorithm in the OLT allocates the upstream grants and schedules the transmission time of each ONU. The ensuing grant allocation for the current polling cycle is conveyed to the ONUs. Although an upstream grant is allocated according to individual requests from each connection, the grants are aggregated and given to an ONU to be distributed among its connections at its discretion. Therefore, upon receiving a grant, the ONU upstream scheduler revises scheduled access for one or more of its connections.
III. PRIORITY-BASED BANDWIDTH ALLOCATION USING FIXED SERVICE QUANTUM
A. Algorithm
Fig. 1. PON upstream QoS architecture.
connections be served. Similarly, only if all rt-VBR and nrt-VBR connections have no packet waiting, will BE connections be served. Whenever there are multiple active connections of the same priority, the algorithm serves one packet from each connection in a round robin fashion. Since the lowest priority traffic is very tolerant and constitutes a large proportion of the traffic, a PON can be dimensioned to provide the required level of service to all traffic classes.
B. Analytical Model
The delay performances of different service classes under our proposed DBA algorithm can be analysed by the MPS model [30]. Here, we analyse the message delay of each service class, which is the time between the arrival and departure of a message at an ONU, excluding the propagation delay for the transmission to the OLT. Introducing priorities to Kleinrock’s round robin processor sharing model [32], the MPS model consists of a number of groups of distributed local queues (LQs) and a central server with a processor sharing (PS) queue. A LQ corresponds to a buffer queue of an ONU connection and the central server corresponds to an OLT upstream scheduler. Group-pLQs containMp LQs with priority p, p = 1,2, . . . , P, where 1 is the highest priority. The central server performs prioritized round robin processor sharing among LQs by allowing no more than one message from each LQ to be present in the PS queue. Only when the service of an entire message is completed, is its LQ allowed to transfer another message into the PS queue. Fig. 2 shows an example of the MPS model for a two-priority case. LQs 1 and 2 belong to the low priority and LQs 3 and 4 belong to the high priority. When the MPS model is applied to a PON, the PON traffic is modelled by different priorities.
MPS is a discrete-time model whereby time is divided into equal-length time-slots. It assumes that messages arriving
Fig. 2. The MPS model for the case of two priorities.
[image:4.612.80.530.52.288.2] [image:4.612.313.565.313.582.2]one slot, can be served at a time when a message is holding the service token. It further assumes the following:
1) All messages arrive at a time-slot boundary.
2) For each p, the number of prioritypmessages arriving at an LQ within each time-slot is independent and identically distributed (i.i.d.) and is also independent of arrivals to other LQs.
3) The number of packets contained in a message (the message length) are discrete i.i.d. for each priority. The distribution of message lengths may be different for different priorities.
4) The transmission of a message can only be interrupted by messages from higher priorities or from other con-nections of the same priority after the current packet is completely transmitted, i.e. until at the end of this time-slot.
The mean delayDp(n)(in units of time-slots) of a priority
pmessage of lengthn packets is simply given by
Dp(n) =Lp+Sp(n), (1) where Lp is the mean time spent by a priority pmessage in its LQ, and Sp(n)is the mean time of a priority pmessage, consisting of at least n packets, spends in the PS queue to complete the services ofnpackets. Note thatLp is not related to the message lengthn.
Let the random variableap represent the number of priority
p message arrivals within a time-slot to any priority-p LQ. We denote the mean of ap as ¯ap. Let the random variable
bp be the priority p message length with mean ¯bp. Since a packet transmission requires a time-slot,bp also represents the message transmission time in units of one time-slot. LetC2
a,p andC2
b,p represent the squared coefficients of variation forap andbp respectively. The total arrival rate for priority-ptraffic
λp=Mpa¯p; the total load of priority-ptrafficρp=λp¯bpand let εp=
Pp
i=1ρi. According to [30], we have:
Dp(n) =νp/ρp+
Pp
i=1νi/(1−εp)
2(1−εp−1) + n−[¯bp(1 +Cb,p2 ) + 1]/2
1−εp−1−MMp−p1ρp
+1
2, (2)
where νp = ρp¯bp(Cb,p2 +λpCa,p2 /Mp). The overall mean prioritypmessage delay is simply given by Dp(¯bp).
We assume a stable PON in the following discussion. Then, this MPS model can be used directly to calculate the mean message delay under our priority-based bandwidth allocation scheme. As CBR traffic receives a constant bandwidth, we do not need to consider it for dynamic bandwidth allocation. Con-nections belonging to rt-VBR, nrt-VBR and BE are assigned with priorities 1, 2 and 3, respectively. SoP = 3.
Using Eq. (2), we are able to examine the impact on the mean message delay due to multiple PON service classes. Clearly, even when the nrt-VBR or BE loads are changed, rt-VBR messages still receive the same service rate because of priority protection. In other words, the mean message delay of rt-VBR service is only affected by its traffic characteristics
such as arrival rate, message length and their variation. How-ever, for nrt-VBR and BE, their delay performance will also be affected by higher priority traffic.
IV. NUMERICAL RESULTS
In this section, the MPS model will be validated by simula-tion. We first present the traffic model of a typical application for each PON service class defined in Section II. We then describe the simulation environment used to validate the MPS model. Based on these traffic models, simulation and analytical results for different traffic loads are compared.
A. Traffic models
A considerable amount of research on traffic modelling has been carried out to investigate the characteristics of different traffic sources for various communication networks [33], [34], [35], [36]. Here, we refer to their results.
A typical application of an rt-VBR service is variable-bit rate video communication. With the large amount of bandwidth available in PONs, it is expected that high quality video communications will be commonly deployed. Therefore, we use MPEG-2 video trace files as video traffic sources in our simulation. For nrt-VBR, an example application is web access. A possible model for web access is to have the message arrivals modelled as a Poisson process and the message size following a Pareto cut-off distribution. Finally, the commonly used Poisson arrival process with exponentially distributed message sizes is chosen as a model for a BE traffic source. The parameters of each traffic source used in this paper are listed in Table I.
TABLE I
ARRIVAL PROCESSES AND MESSAGE SIZE DISTRIBUTIONS OF THE TRAFFIC SOURCES WITH A PRIORITY ARRANGEMENT
Traffic Arrival process Message size distribution Priority
sources level
MPEG-2 Deterministic: As per trace files [37]. 1 trace files 30 frames/s.
Web Poisson, Pareto-cutoff:α=1.1, 2 source mean inter-arrival
time: 0.2s. minimum message = 4.5kbytes, maximum message = 2M bytes.
BE traffic Poisson. Exponential, 3
mean = 5000 bytes.
B. Simulation model
We have developed a special-purpose discrete event simu-lation program using C++ to validate the MPS model. The traffic models described in Section IV-A are used to generate the input traffic. Packet traffic from different service classes is processed according to the QoS architecture as described in Section II. The class-based buffer sizes in the simulation are unlimited in accordance with the MPS model. The simulation has the following settings:
2) The bandwidth allocation in the simulation follows the algorithm described in Section III-A.
3) The overall utilisation is limited to be less than unity during the simulation in order to ensure that the system remains stable.
4) The packet/slot size is set at 100 bytes.
C. Simulation and numerical results
We consider three scenarios according to different traffic loads. Analytical results and simulation results are compared in each scenario and presented in Fig. 3 to Fig. 8, respectively. Confidence intervals of 95% based on a t-test are obtained for all of the simulation results. The range of the confidence interval of each point of the rt-VBR simulation curves is within 4.5% which is hardly noticeable on the figures.
Firstly, we fix the load of nrt-VBR and BE traffic, and investigate the effect of the load of rt-VBR on the mean message delay by increasing the number of video sources. Traffic of lower priorities contribute about 65% of the load by 250 nrt-VBR sources and 150 BE sources, respectively. We set the mean inter-arrival time of the BE traffic to be
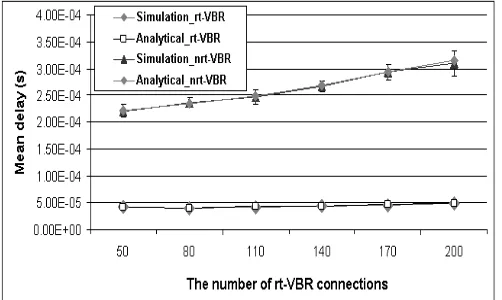
[image:6.612.315.561.55.203.2]0.01s. The mean and variance of message sizes for different service classes are measured in the simulation and fed into the MPS model. The number of video sources increases from 50 to 200 and each source uses the MPEG2 trace file [37] with a random start frame. Results obtained from the simulation and analytical models are shown in Fig. 3 and Fig. 4. It can be seen that the simulation and analytical results are in good agreement, particularly for the rt-VBR and nrt-VBR traffic.
Fig. 3. rt-VBR and nrt-VBR message delays under different rt-VBR traffic loads.
In the second scenario, rt-VBR and BE traffic are fixed but the nrt-VBR traffic is changed by increasing the number of connections. We have 150 video sources and 150 BE sources in this scenario. Parameters of the BE traffic are set to be the same as in the first scenario: the mean inter-arrival time is
0.01sand the mean message size is 5000 bytes. The number of web sources increases from 50 to 320. Fig. 5 and 6 show that the delay for rt-VBR traffic is not affected much by the change of nrt-VBR loads while the increase of nrt-VBR connections leads to a dramatic growth in the BE traffic delay.
In the third scenario, we fix the load of rt-VBR and nrt-VBR traffics, with 150 video sources and 160 web sources
Fig. 4. BE message delays under different rt-VBR traffic loads.
Fig. 5. rt-VBR and nrt-VBR message delays under different nrt-VBR traffic loads.
Fig. 6. BE message delays under different nrt-VBR traffic loads.
respectively. We vary the load of the 150 BE connections by varying their message inter-arrival times. Fig. 7 and 8 are plotted for this case. As expected, the loading of BE traffic does not affect the message delays of other higher priority traffic.
V. IMPROVEMENT BY USING DIFFERENT SERVICE QUANTA
[image:6.612.313.561.232.381.2] [image:6.612.313.560.416.565.2] [image:6.612.50.301.424.574.2]Fig. 7. rt-VBR and nrt-VBR message delays under different BE traffic loads.
Fig. 8. BE message delays under different BE traffic loads.
is normally set according to a relatively small size request. We can improve such an allocation scheme by using different service quanta for different services. In this scheme, when a message arrives, it will be broken down into a number of packets the size of which are priority related. Each packet fits into a variable number of time-slots. As in the above described priority-based DBA algorithm, rt-VBR connections are always served first and the scheduler serves one packet from each connection in a round robin fashion among multiple active connections of the same priority. Moreover, when the traffic arrivals follow a Poisson process, we can extend the MPS model to the MPS-HT model and derive an accurate approximation for the mean message delay.
A. MPS-HT model
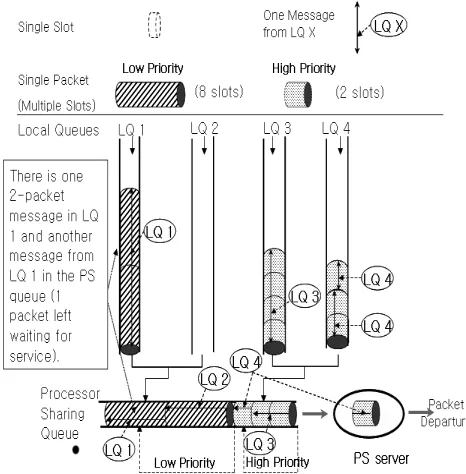
We illustrate our MPS-HT model by a two-priority (high and low) example depicted in Fig. 9. Consider a centralized processor shared by four LQs in a prioritized PS manner. LQs 1 and 2 are exclusively loaded with low priority messages and LQs 3 and 4 with high priority messages. Each LQ is assumed to have an associated infinite buffer.
Message lengths for each priority are discrete i.i.d.. Each message is assumed to consist of an integral number of packets; for example, the message in LQ 1 has two packets. As for the MPS model, a packet here still corresponds to a MAC layer data unit representing an uninterrupted quantum of service time received by the message from the MAC PS server
Fig. 9. The MPS-HT model for the case of two priorities.
and “slot” is still a MAC layer operating unit each of which consists of a fixed number of bytes. Slot sizes for packets may vary between priorities but, within a given priority, all packets consist of the same integral number of slots. For each priority p= 1,2, . . . , P (where a smaller number indicates a higher priority), the length of a priorityppacket is denoted by
Np [slots],1 ≤Np ≤N, where N represents the maximum possible packet size. In the example presented in Fig. 9, the size of the low priority packet is eight slots and the size of the high priority packet is two slots. At any time, at most one message from each LQ can be present in the PS queue, i.e. a message from an LQ cannot move into the PS queue till the previous message from the same LQ has been completely served.
As for the MPS, time is divided into consecutive equal-length time units called time-slots which are related to the service time ofslots. The service time of a packet is known as apacket-time. Let the time points at the beginning of each time-slot be designated by 1, 2, 3, . . . , so that thekth time-slot is the time interval[k, k+ 1). Messages arriving at a priority
p LQ within any time-slot follow a Poisson process with a mean arrival rate of¯ap[messages/time-slot]. Thus, the squared coefficient of variation for the number of arriving messages
C2
a,pis equal to1/¯ap. Let Mp still be the number of priority
pLQs, so the total arrival rate of priorityp messages is given byλp=Mp¯ap.
[image:7.612.317.550.57.294.2] [image:7.612.50.299.231.382.2]at the packet level, i.e., any new message arrival, even from a higher priority, cannot interrupt the current packet’s service.
Let bp be a discrete random variable representing the priority pmessage size in packets. The message size is i.i.d.. Denote ¯bp = E[bp] and Cb,p2 is the squared coefficient of variation of bp given byCb,p2 = Var[bp]/¯b2p. Thus, the mean size in slots of priority p messages is given by¯bpNp and the traffic load of priority pmessages is given by ρp=λp¯bpNp,
0< ρp<1.
B. Mean Message Delay
In the MPS model [30], the delay of an arriving message is obtained by summing up its waiting time in the LQ and the sojourn time in the PS queue. Notice that the method of [30] relies on the following two assumptions that we do not adopt here: (1) all messages arrive at a time-slot boundary; and (2) packets of different priorities are of the same size. Nevertheless, because each priority is considered separately, we can still develop an accurate approximation for the mean message delay by applying the results of [30] and then correcting the result using a compensation term. Accordingly, the mean delay of a prioritypmessage consisting ofnpackets, denoted byDp(n)(in units of priorityp packet-time), is given by
Dp(n) =Lp+Sp(n) + ∆p, (3) where Lp and Sp(n) are as defined in III-B, and ∆p is the compensation term defined as the difference between the delay for a prioritypmessage and the delay predicted by the MPS model. In the following, we derive these three components separately.
Since the transmission time of each packet in the MPS model is equal to one time-slot, to use that model in our approximation, it is convenient to consider the basic time unit to be a packet-time. In particular, when we evaluate the mean delay of a priority p message, we consider time to be measured in priority p packet-time units and the amount of traffic that arrives in units of priority p packet-time. It should be noted that packets of other priority messages may be neither the same size as priorityppackets nor even an integer multiple of the priority p packet size. Furthermore, these other priority messages arrive during the priority p packet-time (Nptime-slots) and not all at once as in the MPS model. For our approximation, we do not consider the actual arrival process but instead we simply fit the first two moments of our arrival process and this has been found to give a reasonable approximation in practice, since MPS is also only based on two moments. We re-describe the arrival process of priority i
messages in Table II.
The analysis in [32] (p.168) and Appendix I of [30] shows thatSp(n)is linearly increasing withn, which is based on the previous studies of the round robin processor sharing (RRPS) model [38], [39]. Moreover,Sp(0)in [30] was considered to be zero following the notation in the original round robin (RR) queue, representing the starting time that a customer enters the RR system. However, notice that the MPS model and our MPS-HT model, unlike round robin (RR) with a single
TABLE II
PRIORITYiTRAFFIC LOAD CONVERTED INTO UNITS OF PRIORITYp
PACKET AND PACKET-TIME
The mean length of messages in
units of priorityppackets E[biNi/Np] = ¯biNi/Np.
The mean number of message ar-rivals during a priorityp packet-time
λiNp.
The variance of the number of mes-sage arrivals during a priority p
packet-time
NpMiVar(ai) = NpMi¯a2iCa,i2 , as C2
a,i = 1/¯ai for Pois-son arrivals, NpMi¯a2iCa,i2 =
NpMia¯i=Npλi.
The second moment of the number of priorityimessages arriving dur-ing a priorityppacket-time
Npλi+Np2λ2i.
queue, is assumed to consist of LQs and a PS queue, where the propagation delay from an LQ to PS queue is assumed to be zero. A message arrives at LQ first, then enters the PS directly if there is no message belonging to the same LQ in the PS queue; otherwise, if such a message exists in the PS queue, the new arrival waits at the LQ, and then moves forward to the head of line (HOL) position of the LQ. For the second case, the HOL message is still waiting at its LQ when the last packet of the previous message belonging to the same LQ in the PS queue is moving out. However, following the consideration of the traditional RR, the PS queue was looked as the single queue [30]; the start time of the LQ HOL message moving into the PS queue was calculated from the start time that the last packet of the previous message belonging to the same LQ in the PS queue is served. For such a case the LQ HOL message was supposed to be in the PS queue already, but this is incompatible with the original assumption of the MPS model which requires that the HOL message should still be in the LQ. Therefore, Sp(n)is overestimated by (2) of [30]. This period should be taken into account inLp rather than in
Sp(n). Let δp denote the difference between the mean time that messages spend in PS queue for the MPS or the MPS-HT model and for the RRPS model. In the MPS or the MPS-HT model,
Sp(n) =n(Qp(0)
λp
)−δp, (4) where Qp(0) is the mean number of priority p messages in the PS queue which has not received any service. Note that the total delay Lp+Sp(n) in the MPS model has been proved correct [30]. In this paper, we demonstrate just the apportionments to LQ (Lp) and to PS queue (Sp(n)) are not quite accurate.
These arriving messages include the arrivals to priority p
LQs other than the one owning this test message (given by
(Sp(x)−1)ρp(Mp−1)/Mp), and the arrivals to all local queues of priorities higher thanp(given by(Sp(x)−1)
Pp−1
i=1 ρi). We
have
Sp(x)→x+ (Sp(x)−1)[Mp−1
Mp
ρp+ p−1
X
i=1
ρi], as x→ ∞. (5) Defining εp=
Pp
i=1ρi, we obtain:
lim
x→∞Sp(x) =
x
1−εp−1−MMp−p1ρp
. (6)
Whenx→ ∞, the slope of the mean PS delay is:
Qp(0)
λp
= 1
1−εp−1−MMp−p1ρp
, (7)
which is identical to that shown for the MPS model [30]. Substitution of the slope in (4), we obtain
Sp(n) =
n
1−εp−1−MMp−p1ρp
−δp. (8)
Thus,
Dp(n) =Lp+ n
1−εp−1−MMp−p1ρp
−δp+ ∆p. (9) In a similar fashion to [30], we can also derive Lp. We use a discrete-time non-preemptive priority queueing model [40] as the equivalence to the MPS-HT model in terms of the average packet delay. Both queueing systems follow a strict priority discipline and are work-conserving based on the service disciplines at the packet level. If the total packet arrival process into both systems are identical and knowing that the two systems have equal average queue sizes and equal average arrival rates, by Little’s formula, the mean delay of packet at each priority for both systems is equal. Notice that the packet delay distributions are different even though they have equal means, as the distribution of delay usually depends on the service order. SoLp can be obtained by equivalence in terms of the mean of priorityppacket delay for the MPS-HT model and for the discrete-time non-preemptive priority model.
According to Appendix II of [30], we have
Rp(k) = 1−Fb,p¯(k−1)
bp
for k= 1,2,3, . . . , bp, where Rp(k) for k = 1,2, . . . , bp is the probability that a randomly selected priority p packet is the kth in its own message. Then, the mean delay of priority p packets is obtained as
E[Dseg(p)] =
bp X
k=1
[Lp+Sp(k)]Rp(k). Substituting of (8) in the above equation yields
E[Dseg(p)] =Lp+
[¯bp(1 +Cb,p2 ) + 1]/2
1−εp−1−MMp−p1ρp
−δp. (10)
For the discrete-time non-preemptive priority queueing model, the packets arriving in message batches with higher
priority than those currently being served, are assumed to enter service in the next packet interval and preempting service of lower priority packets which might be partially completed. Therefore, it is equivalent to the MPS-HT model which is preemptive resume at the packet level. For these packet-sized batch arrivals to the packets queue, using (6.5) of [40], we obtain the following cumulants of the i.i.d. packet arrival processes with the first two moments from the results in Table III. For the arrival processes of priorityimessages on priority
ppacket level, we have
• mean = λi¯biNi = ρi [priority p packets / priority p packet-time],
• variance =ρi¯biNi(1 +Cb,i2 )/Np.
Letνi=ρi¯biNi(1+Cb,i2 )/Np. The total packet arrival process for priority pmessages or higher has
• mean =Ppi=1ρi=εp,
• variance =Ppi=1νi.
Using these mean and variance expressions with (6.17) of [40] and adding one packet transmission time, we obtain the mean delay of priority p packets in units of p packet-time, given by
E[Dseg(p)] =
νp/ρp+
Pp
i=1νi/(1−εp)
2(1−εp−1) . (11)
The corresponding parameters for our case using (6.17) are shown in Table III. Note thatB¯y in (6.17) of [40] is equal to 1 when we calculate the meanpacketwaiting time.
TABLE III
CORRESPONDING PARAMETER NOTATIONS USED IN(6.17)OF[40]
Parameters in (6.17) of [40] Parameters in MPS-HT model ρIy: the traffic load from those
priorities higher thany.
εp−1: the traffic load from those priorities higher thanp.
E( ˜N(Fy))and E([ ˜N(Fy)]2): the first two moments of the number of packets from prioritiesi≤y.
εpandPpi=1νi+ε2p: the first two moments of the number of packets from prioritiespor higher arriving during a priorityppacket-time, in the units of priorityppacket size.
¯
NiB¯i: the mean arrival rate of packets from the prioritiesi. ρi.
¯
By: the mean message/packet size depends on the equation used for calculating the mean mes-sage/packet waiting time.
1: as we calculate the meanpacket waiting time.
¯
Ny and N¯y2: the first two mo-ments of the arriving process for priorityymessages.
ρpandνp+ρ2p: the first two mo-ments of priorityppacketsarriving during a priorityppacket-time.
Equating (11) with (10), we obtain the following expression for Lp:
Lp=
νp/ρp+
Pp
i=1νi/(1−εp)
2(1−εp−1) −
¯bp(1 +C2
b,p) + 1]/2
1−εp−1−MMp−p1ρp
+δp+1
2. (12)
Then, summing (8) and (12), we obtain
Lp+Sp(n) =
νp/ρp+
Pp
i=1νi/(1−εp)
n−[¯bp(1 +Cb,p2 ) + 1]/2
1−εp−1−MMp−p1ρp
+1
2. (13)
For the first part of the compensation, henceforth denoted
∆p(1), when a prioritypmessage arrives, it has to wait until the packet in progress completes its transmission – regardless of its priority – because we do not allow preemptions. At the same time, due to this delay, there are higher priority messages which arrive during the time, so the total work required by all these packets should be taken into account using∆p(1). Thus, denoting the waiting time as Wp, we have
∆p(1)→Wp+ ∆p(1) p−1
X
i=1
ρi. (14)
We can evaluateWp for a prioritypmessage due to the trans-mission time of a priorityipacket currently found in service. Since the message arrival process follows a Poisson process, this occurs with probabilityρi (by the PASTA principle). The time that the priority pmessage has to wait until the priority
ipacket completes its service is estimated as half ofNi time-slots. We estimate
E[Wp] =
PP
i=1ρiNi
2Np . (15) Thus, we have
∆p(1) =
PP
i=1ρiNi
2Np(1−εp−1). (16)
The part ∆p(1) only considers compensation associated with the initial delay. It is important, however, to notice that for the same reason that the high priority message experiences additional delay relative to the MPS model (because it has to wait until a low priority packet completes its transmission), the low priority message experiences a reduction of delay (relative to the MPS model) if a high priority message arrives during the transmission of the last packet of a low priority message. Notice that this reduction of delay, which we henceforth denote by∆p(2), is only relevant to the last packet. If the high priority message arrives during transmission of an earlier packet, the reduction of delay gained by the low priority message will be offset by a later delay of transmission of subsequent packets as they can only be transmitted after the transmission of the high priority message is completed and since the latter incurred initial delay, it will also be delayed in completing its transmission. Let Jp(x) for anyp > 1 be a function defined by
Jp(x) =
½
1 ifx < cNp,
0 otherwise,
where the factor c, 0 < c ≤ 1, will allow us to disregard messages of priorities higher than p that their packet size is close to that of p. Letλ(p) =Ppi=1−1λiJp(Ni).The rateλ(p) is the arrival rate of messages that we would like to consider in evaluating ∆p(2). In particular, ∆p(2) is evaluated by the time elapsed from the moment of the first occurrence of a Poisson process with rate λ(p) within the last packet-time of our priority p message until the end of that packet-time. Since ∆1(2) is relevant to the arrival rate λ(p), if λ(p) = 0,
∆1(2) = 0. It is known that conditioning on the number
of Poisson arrivals within a packet-time, the arrival times have the same distribution as the order statistics of the same number of uniformly distributed random variables within that packet-time. Conditioning and unconditioning on the number of arrivals in an interval of the packet-time of a priority p
messageNp, we obtain,
∆p(2)∼= 1− 1
λ(p)Np
³
1−e−λ(p)Np ´
, (17)
wherep >1 and λ(p)6= 0. Since ∆p(2) is relevant only for
p >1, we set∆1(2) = 0. Overall, ∆p is estimated by
∆p∼= ∆p(1)−∆p(2), p≥1. (18) Due to possible large variations in packet size for the different priorities, the compensation term ∆p is key to an accurate evaluation of the overall mean message delay. Especially,
∆p(1) can have a major effect on the result, as ∆p(2)≤1. We can multiply the result ofDp(n)byNpto convert it back to the common “currency” of time-slots.
C. Model Evaluation
In this section, we validate our approximation for the mean message delay using the simulation program described in Section IV-B which also incorporates the variable service quanta. PON traffic is served by the DBA algorithm using different service quanta as described before. The bandwidth is allocated in the units of packet size for each priority. The packet sizes are 300, 3000 and 500 bytes for priority 1, 2 and 3, respectively. The other settings are the same as described in Section IV-B.
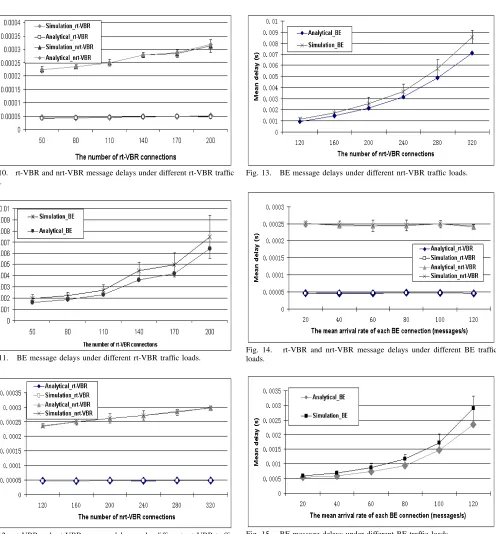
The same scenarios for the MPS model in Section IV-C are considered here. Using a 100 byte slot, we calculate the mean message delay for priority p traffic, Dp[¯bp], using (3), (13) and (18) with c = 0.8. Analytical and simulation results with 95% confidence intervals (which are too small to be noticed in many cases) based on a Student’s t-test are presented in Figs. 10 to 15. The analytical results are in good agreement with the simulation results, especially for rt-VBR and nrt-VBR traffic. Comparing with the results of the MPS model, the mean message delay of highest priority traffic is slightly increased and that of the lower priorities is decreased as we introduce a bigger service quantum for the lower priority traffic. The change in values depends on the selection of service quanta.
VI. CONCLUSIONS
Fig. 10. rt-VBR and nrt-VBR message delays under different rt-VBR traffic loads.
Fig. 11. BE message delays under different rt-VBR traffic loads.
Fig. 12. rt-VBR and nrt-VBR message delays under different nrt-VBR traffic loads.
REFERENCES
[1] C. H. Lee, W. V. Sorin and B. Y. Kim, “Fibre to the Home Using a PON Infrastructure”,Journal of Lightwave Technology, vol. 24, no. 12, pp.4568-4583, December 2006.
[2] ITU-T G.983.x Series of Recomendations, [Online]. Available:
<http://www.itu.int/rec/T-REC-G/e>.
[3] ITU-T Rec. G.984.1, ”Gigabit-Capable Passive Optical Networks (GPON): General Characteristics”, March 2003.
[4] IEEE 802.3ah Task Force, [Online]. Available:
<http://www.ieee802.org/3/efm>.
[5] F. Effenberger, D. Clearly, O. Haran, G. Kramer, R-D Li, M. Oron, and T. Pfeiffer, “An introduction to PON technologies”,IEEE Communica-tions Magazine, vol. 45, no. 3, pp. S17-S25, March 2007.
[6] B. Skubic, J. Chen, J. Ahmed, L. Wosinska, and B. Mukherjee, “A
Fig. 13. BE message delays under different nrt-VBR traffic loads.
Fig. 14. rt-VBR and nrt-VBR message delays under different BE traffic loads.
Fig. 15. BE message delays under different BE traffic loads.
Comparison of Dynamic Bandwidth Allocation for EPON, GPON, and Next-Generation TDM PON”,IEEE Communications Magazine, vol. 47, no. 3, pp. S40-S48, March 2009.
[7] K. Grobe and J. Elbers, ”PON in adolescence: from TDMA to WDM-PON”, IEEE Communications Magazine, vol. 46, no. 1, pp. 26-34, January 2008.
[8] C. H. Foh, L. L. H. Andrew, E. Wong, and M. Zukerman, “FULL-RCMA: A High Utilization EPON”,IEEE Journal of Selected Areas in Communications, vol. 22, no. 8, October 2004, pp. 1514-1524. [9] Y. Luo, S. Yin, N. Ansari, and T. Wang, “Resource management
[image:11.612.66.562.41.575.2] [image:11.612.311.562.56.203.2][12] G. Kramer, B. Mukherjee, and G. Pesavento, “IPACT: A dynamic pro-tocol for an Ethernet PON (EPON),”IEEE Communications Magazine, vol. 40, pp. 74–80, February 2002.
[13] G. Kramer, B. Mukherjee, and G. Pesavento, “Ethernet PON (ePON): Design and analysis of an optical access network,”Photonic Network Communications, vol. 3, pp. 307–319, July 2001.
[14] G. Kramer, B. Mukherjee, and G. Pesavento, “Interleaved polling with adaptive cycle time (IPACT): A dynamic bandwidth distribution scheme in an optical access network,” Photonic Network Communications, vol. 4, pp. 89–107, January 2002.
[15] M. Ma, Y. Zhu, and T. H. Cheng, “A bandwidth guaranteed polling MAC protocol for ethernet passive optical networks,”in Proceedings of IEEE INFOCOM, pp. 22–31, March 2003.
[16] L. Zhang, E.-S. An, C.-H. Youn, H.-G. Yeo, and S. Yang, “Dual DEB-GPS scheduler for delay-constraint applications in ethernet passive optical networks,”IEICE Transactions on Communications, vol. E86-B, no. 5, pp. 1575–1584, May 2003.
[17] A. E. Kamal and B. F. Blietz, “A priority mechanism for the IEEE 802.3ah EPON,”in Proceedings of IEEE ICC, 2005.
[18] S. Choi and J. Huh, “Dynamic bandwidth allocation algorithm for multimedia services over Ethernet PONs,”ETRI Journal, vol. 24, no. 6, pp. 465–468, December 2002.
[19] F. M. Pereira, N. L. S. Fonseca, and D. S. Arantes, “A fair scheduling discipline for Ethernet passive optical networks,”Computer Networks, vol. 53, no. 11, pp. 1859–1878, 2009.
[20] F. M. Pereira, N. L. S. Fonseca, and D. S. Arantes, “On the performance of generalized processor sharing servers under long-range dependent traffic,”Computer Networks, vol. 40, no. 3, pp. 413–431, 2002. [21] G. Kramer, B. Mukherjee, S. Dixit, Y. Ye, and R. Hirth, “Supporting
differentiated classes of service in Ethernet passive optical networks,” OSA Optical Networking Journal, vol. 1, no. 8, pp. 280-298, 2002. [22] Y. Zhu, M. Ma, and T. H. Cheng, “Hierarchical Scheduling to Support
Differentiated Services in Ethernet Passive Optical Networks,”Computer Networks, vol. 50, no. 3, pp. 350-366, February 2006.
[23] A. R. Dhaini, C. M. Assi, A. Shami, and N. Ghani, “Adaptive fairness through intra-ONU scheduling for Ethernet passive optical networks,” in Proceedings of IEEE ICC, 2006.
[24] Y. Zhu and M. Ma, “Supporting differentiated services with fairness by an urgent queuing scheduling scheme in EPONs,”Photonic Network Communications, vol. 12, no. 1, pp. 99–110, July 2006.
[25] C. M. Assi, Y.-H. Ye, S. Dixit, and M. A. Ali, “Dynamic bandwidth allocation for quality-of-service over Ethernet PONs,”IEEE Journal on Selected Areas in Communications, vol. 21, pp. 1467–1477, November 2003.
[26] J. Xie, S. Jiang, and Y. Jiang, “A dynamic bandwidth allocation scheme for differentiated services in EPONs,”IEEE Communications Magazine, vol. 42, pp. S32–S39, August 2004.
[27] M. McGarry, M. Reisslein, and M. Maier, “Ethernet passive optical network architectures and dynamic bandwidth allocation algorithms,” IEEE Communications Surveys Tutorials, vol. 10, no. 3, pp. 46-60, 2008. [28] J. Jiang, M. R. Handley, and J. M. Senior, “Dynamic bandwidth assign-ment MAC protocol for differentiated services over GPON,”Electronics Letters, vol. 42, no. 11, pp. 653–655, May 2006.
[29] J. Zhang, N. Ansari, Y. Juo and F. Effenberger, “Next-generation PONs: A Performance Investigation of Candidate Architectures for Next-generation Access Stage 1”,IEEE Communications Magazine, vol. 47, no. 8, pp. 49–57, August 2009.
[30] P. Potter and M. Zukerman, “Analysis of a discrete multi-priority queueing system involving a central shared processor serving many local queues,”IEEE Journal on Selected Areas in Communications, no. 2, pp. 194–202, February 1991.
[31] J. Kuri and M. Gagnaire, “A MAC Protocol for IP Differentiated Services in a WDM Metropolitan Area Network,” Photonic Network Communications,, vol. 3, no. 1-2, pp. 63–74, January 2001.
[32] L. Kleinrock, Queueing Systems Volume II: Computer Applications. John Wiley & Sons Inc., 1976.
[33] K. Sriram and W. Whitt, “Characterizing superposition arrival processes in packet multiplexers for voice and data,”IEEE Journal on Selected Areas in Communications, no. 6, pp. 833–846, September 1986. [34] A. Golaup and H. Aghvami, “A multimedia traffic modeling
frame-work for simulation-based performance evaluation studies,”Computer Networks, vol. 50, pp. 2071–2087, August 2006.
[35] Z. Sun, D. He, L. Liang, and H. Cruickshank, “Internet QoS and traffic modelling,”IEE Proceedings Software, Special Issue on Performance Engineering, vol. 151, no. 5, pp. 248–255, October 2004.
[36] M. Molina, P. Castelli, and G. Foodis, “Web traffic modelling exploiting TCP connections’ temporal clustering through HTML-REDUCE,”IEEE Network Magazine, vol. 14, no. 3, pp. 46–55, May 2000.
[37] The MPEG2 trace file. [Online]. Available: <http://trace.kom.aau.dk/ hd/sony/mpeg2/>.
[38] L. Kleinrock, “Analysis of a time-shared processor,” Naval Research Logistics Quarterly, vol. 11, pp. 59–73, 1964.
[39] L. Kleinrock, “Time-shared systems: a theoretical treatment,”Journal of the ACM, vol. 14, no. 2, pp. 242–261, 1967.
[40] I. Rubin and Z. Tsai, “Message delay analysis of multiclass priority TDMA, FDMA, and discrete-time queueing systems,”IEEE Transaction on Information Theory, vol. 35, no. 3, pp. 36–43, May 1989.
Yan Wang received her B.Eng. degree in China in 1994, M.Eng. in Telecommunications from The University of Melbourne, Australia, in 2003 and Ph.D. in Computer Systems from RMIT University, Australia, in 2009. Her research interests are in the areas of performance modeling of wireless and optical networks.
Moshe Zukerman (M’87–SM’91–F’07) received the B.Sc. degree in industrial engineering and man-agement and the M.Sc. degree in operations research from the Technion – Israel Institute of Technology, Haifa, Israel, and the Ph.D. degree in engineering from University of California, Los Angeles, in 1985. He was an independent Consultant with the IRI Corporation and a Postdoctoral Fellow with the Uni-versity of California, Los Angeles, in 1985–1986. In 1986–1997, he was with the Telstra Research Laboratories (TRL), first as a Research Engineer and, in 1988–1997, as a Project Leader. He also taught and supervised graduate students at Monash University in 1990–2001. During 1997–2008, he was with The University of Melbourne, Victoria, Australia. In 2008 he joined City University of Hong Kong as a Chair Professor of Information Engineering, and a team leader. He has over 250 publications in scientific journals and conference proceedings. He has served on various editorial boards such as Computer Networks, IEEE Communications Magazine, IEEE Journal of Selected Ares in Communications, IEEE/ACM Transactions on Networking and the International Journal of Communication Systems.
Sammy Chan(S’87–M’89) received his B.E. and M.Eng.Sc. degrees in electrical engineering from The University of Melbourne, Australia, in 1988 and 1990, respectively, and a Ph.D. degree in com-munication engineering from the Royal Melbourne Institute of Technology, Australia, in 1995. From 1989 to 1994, he was with Telecom Australia Re-search Laboratories, first as a reRe-search engineer, and between 1992 and 1994 as a senior research engineer and project leader. Since December 1994, he has been with the Department of Electronic Engineering, City University of Hong Kong, where he is currently an associate professor.