UK Employer Skills
Survey 2011: First
Findings
Briefing Paper
1
UK Employer Skills Survey 2011:
First Findings
David Vivian, Mark Winterbotham, Jan Shury, Ben Davies
IFF Research
Dr Susannah Constable
Project Manager
UK Commission for Employment and Skills
2
Foreword
The UK Commission for Employment and Skills is a social partnership, led by
Commissioners from large and small employers, trade unions and the voluntary sector.
Our mission is to raise skill levels to help drive enterprise, create more and better jobs
and promote economic growth.
The UK Employer Skills Survey 2011 (UK ESS 2011) is the key UK data source on
employer demand for and investment in skills. It is the first UK-wide employer skills survey and is also one of the largest employer skills surveys undertaken in the world with
over 87,500 achieved interviews covering large and small businesses in every sector.
This ambitious project has brought together the four surveys on skills deficiencies and
training that were previously carried out separately in each constituent nation of the UK
and represents a significant achievement technically. Compared to the previous surveys
run in the nations, this survey includes a wider population of establishments. This means
that the results included in this briefing paper are not directly comparable with previous
skills surveys undertaken in the constituent nations.
The First Findings provides an early snapshot of emerging findings at the UK-level using
2011 figures only and referencing no trends through time. This early glance at the data
will be followed in spring 2012 by a more detailed Evidence Report, which will delve
deeper into the rich data provided by the survey. This will be followed by a report for each
nation including time series analysis, so that over the next 6 months the survey will
provide:
Analysis across the entire UK on a comparable basis
Comparison of sectors and occupations within the UK
Re-creation of the data on a basis that allows time series analysis in the
constituent nations
Some of the key issues emerging from this briefing paper include that:
Total UK employer expenditure on training is estimated at £49bn over the 12
months before the survey. This is the first time that such a detailed estimate of
UK-wide training expenditure has been calculated. For the reasons given above, this figure is not comparable with figures generated by previous surveys in the
3
Just over a quarter of all establishments had trained staff towards nationally
recognised qualifications in the 12 months prior to the survey. This illustrates that
a minority of employers are currently engaged with the established qualifications
system and highlights the importance of engaging employers more actively in
driving the development of qualifications.
Whilst only pockets of the economy experience skills deficiencies, where they are
felt they have an impact on the ability of establishments to function (62 per cent
report some impact). Nearly half (48 per cent) of establishments with skill gaps
report that it leads to increased workload for other staff, whilst 83 per cent of
employers experiencing hard-to-fill vacancies found this to be a problem. Nearly a
half of businesses with hard-to-fill vacancies found it difficult to meet customer
service objectives; to develop products or services, or that it led to a loss of
business orders.
The UK Commission is also concerned with raising employer ambition and demand for
skills to a level akin to our international competitors. Thus, we need to understand why 64
per cent of non-training establishments say the reason for not training is that all their staff
are already fully proficient, and whether this reflects a lack of ambition. It is these sorts of
issues that we will explore further in the full UK Report, which will follow this briefing
paper.
The 2011 UK Employer Skills Survey is a key component of the UK Commission‟s
research programme, which provides a robust evidence base for our insights and actions.
The research programme is underpinned by a number of core principles including the
importance of: ensuring ‘relevance’ to our most pressing strategic priorities; ‘salience’ and effectively translating and sharing the key insights we find; international benchmarking and drawing insights from good practice abroad; high quality analysis which is leading edge, robust and action orientated; being responsive to immediate needs as well as taking a longer term perspective. We also work closely with key partners
to ensure a co-ordinated approach to research and are proud to have delivered this survey, which represents a significant step forward in co-ordinating research and unifying
services, on behalf of the four nations and our Commissioners.
We hope you find this paper useful and informative. Previous briefing papers produced by
the UK Commission can be accessed via www.ukces.org.uk.
4
Table of Contents
Introduction ... 1
Methodology ... 1
1
The market for labour ... 2
1.1 What is the level of demand for labour? ... 2
1.2 Is the market meeting demand? ... 3
1.3 What are the causes of hard-to-fill vacancies and what is their impact on employers? ... 5
2
Employer experiences of skill deficiencies ... 7
2.1 What is the unmet demand for skills? ... 7
2.2 How do skill deficiencies vary by occupation and what specific skills are lacking? ... 9
2.3 What are causes of skills gaps and how do they impact on the business? ... 10
2.4 Education leavers and their preparedness for work ... 10
3
Investment in skills and workforce development ... 12
3.1 How many establishments provide any training or development for their employees? ... 12
3.2 Which establishments are more likely to train? ... 13
3.3 What are the reasons for not providing training? ... 15
3.4 Planning and budgeting of training activity ... 15
3.5 What broad types of training have been provided? ... 16
3.6 How many staff have received training? ... 16
3.7 Who receives training? ... 17
3.8 How much training is provided? ... 18
3.9 Training to qualifications ... 18
3.10 Investment in training ... 19
3.11 Assessing the impact of training ... 23
Summary points ... 24
Next steps ... 24
i
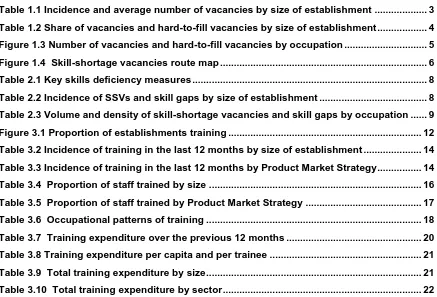
Table of Graphs and Charts
[image:6.595.81.518.134.431.2]Table 1.1 Incidence and average number of vacancies by size of establishment ... 3
Table 1.2 Share of vacancies and hard-to-fill vacancies by size of establishment ... 4
Figure 1.3 Number of vacancies and hard-to-fill vacancies by occupation ... 5
Figure 1.4 Skill-shortage vacancies route map ... 6
Table 2.1 Key skills deficiency measures ... 8
Table 2.2 Incidence of SSVs and skill gaps by size of establishment ... 8
Table 2.3 Volume and density of skill-shortage vacancies and skill gaps by occupation ... 9
Figure 3.1 Proportion of establishments training ... 12
Table 3.2 Incidence of training in the last 12 months by size of establishment ... 14
Table 3.3 Incidence of training in the last 12 months by Product Market Strategy ... 14
Table 3.4 Proportion of staff trained by size ... 16
Table 3.5 Proportion of staff trained by Product Market Strategy ... 17
Table 3.6 Occupational patterns of training ... 18
Table 3.7 Training expenditure over the previous 12 months ... 20
Table 3.8 Training expenditure per capita and per trainee ... 21
Table 3.9 Total training expenditure by size ... 21
1
Introduction
The 2011 UK Employer Skills Survey (UK ESS 11) is an ambitious project, providing
UK-wide data on skills deficiencies and workforce development across the UK on a
comparable basis for the first time. This briefing paper presents data on a wider
population (all establishments except sole traders) than has been used in the surveys
previously carried out in the constituent nations. As a result of this, the data included in
this briefing paper is for 2011 only and no comparisons through time are (or should be)
made. Later outputs in 2012 will provide a fuller picture of the UK situation, and provide
trends through time, reworking the data on a basis comparable to how it was generated in
each constituent nation previously.
Methodology
UK ESS 11 was one of the largest telephone-based skills surveys of employers in the
world. It was undertaken at the establishment level and involved over 87,500 interviews,
with a follow up survey of over 11,000 employers focusing on employers‟ expenditure on
training. Fieldwork took place from late March to July 2011.
Survey results have been grossed up to the full population of employers across the UK,
and are representative on a size, sector and geographic basis. It is worth noting that the
majority of establishments are small and employ fewer than five people (64 per cent).
Sites employing 100 or more staff represent only two per cent of all establishments but
account for two-fifths (41 per cent) of overall employment.
The UK Employer Skills Survey is one of a pair of surveys run by the UK Commission;
the other is the UK Employer Perspectives Survey (EPS). By exploring employer demand
for skills, skills challenges and investment in skills, UK ESS focuses on the challenges
being faced by employers within their establishments. EPS focuses on employer
2
1
The market for labour
Across the UK, 12 per cent of establishments report having vacancies at the time of
interview (636,000 vacancies in total). The labour market is generally able to meet
demand, with less than a quarter of all vacancies described as „hard to fill‟ (23 per cent).
While only a small proportion of establishments report hard-to-fill vacancies (four per
cent), where they do exist they can considerably restrict the size of an establishment‟s
workforce: for smaller establishments (with fewer than 25 employees) experiencing
hard-to-fill vacancies, these vacancies are equivalent to a quarter (25 per cent) of their
workforce. The problem is also acute for certain occupations; two in five vacancies for
Skilled Trade positions (41 per cent) are hard to fill. Where employers experience
hard-to-fill vacancies, these can have an impact both on the rest of the workforce and on the
business directly in terms of challenging employers‟ ability to meet customer demand. A
lack of skills, work experience and qualifications are the main causes of these recruitment
problems (accounting for 72 per cent of hard-to-fill vacancies).
1.1
What is the level of demand for labour?
One in eight establishments (12 per cent) had a vacancy at the time of the interview. As
this is the first time data has been collected this way across the UK, we cannot say at this
point how this compares to earlier surveys. However, we do know something of the
context with growth in GDP of just 0.4 per cent, and 0.1 per cent in the first two quarters
of 2011 (the period in which fieldwork was carried out), and latest unemployment figures
showing their highest rates for 17 years.
In total, there were around 636,000 vacancies across the UK at the time of the survey
(equivalent to 2.3 per cent of total employment). Amongst those with vacancies, this
equates to an average of 2.4 vacancies per establishment.
As Table 1.1 shows, there is great variation by size, and over half of establishments with
3
Table 1.1 Incidence and average number of vacancies by size of establishment
All 1-4 5-24 25-99 100-199 200-499 500+
Unweighted Base 87,572 18,955 47,770 15,951 2,707 1,625 564
% of employers with
vacancies 12% 7% 16% 32% 52% 56% 60%
Unweighted Base 17,166 1,462 7,869 5,213 1,396 876 350
Average number of vacancies
amongst those with vacancies 2.4 1.7 1.8 2.8 4.7 7.9 17.2
By sector, demand for labour was highest amongst employers in Public Administration
and Defence (22 per cent of employers reported vacancies), Education (22 per cent),
Mining and Quarrying (19 per cent) and Health and Social Work (18 per cent), in part also
reflecting their larger size profile.
1.2
Is the market meeting demand?
For the vast majority of employers, the labour market is able to meet their requirements.
Only four per cent of all establishments reported having a vacancy that was
proving hard to fill, rising to nine per cent of those with 25-99 employees and 14
per cent amongst those with at least 100 employees.
Across the UK there were around 144,000 vacancies that were hard to fill at the
time of the interview, representing less than a quarter of all vacancies (23 per
cent).
Although larger establishments are more likely to be active in the labour market and to
have experienced recruitment difficulties, the volume of vacancies and hard-to-fill
vacancies experienced by these establishments is low relative to their share of
employment. On the other hand, when smaller firms do experience a vacancy, they are
more likely than larger firms to struggle to fill it and the vacancy will account for a greater
proportion of their staff. Table 1.2 illustrates the share of vacancies and hard-to-fill
4
Table 1.2 Share of vacancies and hard-to-fill vacancies by size of establishment
All 1-4 5-24 25-99 100-199 200-499 500+
Unweighted Base 87,572 18,955 47,770 15,951 2,707 1,625 564
Share of total employment 11% 23% 25% 11% 14% 16%
Share of all vacancies 24% 28% 22% 9% 10% 7%
Share of all hard-to-fill
vacancies 37% 29% 20% 7% 4% 3%
% of vacancies that are
hard-to-fill 23% 34% 23% 21% 18% 10% 9%
By occupation, the market struggles most in terms of meeting demand for Skilled Trade
occupations: this occupational group accounts for eight per cent of all vacancies but 15
per cent of hard-to-fill vacancies; and 41 per cent of vacancies for Skilled Trade
occupations are hard to fill. Figure 1.3 illustrates the number of vacancies and hard-to-fill
5
Figure 1.3 Number of vacancies and hard-to-fill vacancies by occupation
1.3
What are the causes of hard-to-fill vacancies and what is their
impact on employers?
Overall, four per cent of establishments reported having a vacancy that was hard to fill.
Almost three quarters (72 per cent) of their hard-to-fill vacancies are the result of a lack of
skills, work experience or qualifications amongst applicants; these are referred to as
“skill-shortage vacancies” (SSVs; see Figure 1.4)1. The next section on skills deficiencies
explores SSVs in more detail, examining which employers and types of roles are affected
and the impact that this is having.
A significant number of vacancies are reported as hard to fill as a result of lack of interest
in the job and / or a lack of applicants generally (22 per cent and 15 per cent of all
hard-to-fill vacancies respectively)2.
1
Employers were first asked to give their reasons spontaneously (i.e. without being presented with a list of possible reasons). Any employers not reporting skills-related issues were then prompted as to whether any of their hard-to-fill vacancies were proving hard to fill due to a lack of skills, experience or qualifications among applicants.
2 These results are on an unprompted basis (i.e. employers were asked to give their reasons spontaneously, without being
read out a list of possible reasons) 0 10 20 30 40 50 60 70 80 90 100 110 Managers / Senior Officials Professionals Assoc Professionals
Admin Skilled Trades Caring, Leisure, Other services Sales & Customer service Machine Operatives Elementary Vacancies (000s)
Hard-to-fill vacancies (000s)
Unweighted
base (vacs) 1,495 8,251 7,884 4,498 4,047 6,556 7,000 2,951 7,698 Unweighted base
(employers with vacs)
999 3,032 3,186 2,661 2,222 2,560 2,291 1,134 2,854
Nu m b e r o f v a c a n c ie s ( 0 0 0 s ) 21%
Hard to fill vacancies / vacancies
6
Whilst hard-to-fill vacancies are only reported by a small minority of establishments, the
impact they have can be significant (and just six per cent of those experiencing
recruitment difficulties considered that this was having no impact on their workplace). The
most common impact of hard-to-fill vacancies is on existing staff; 83 per cent indicated
that they result in an increased workload for other staff. They also impact on business
performance directly:
45 per cent of establishments with hard-to-fill vacancies reported that they have
resulted in difficulties meeting customer services objectives;
42 per cent reported that they have led to loss of business or orders to
competitors;
41 per cent reported that they have resulted in delays developing new products
[image:12.595.54.521.388.740.2]or services.
Figure 1.4 Skill-shortage vacancies route map
Vacancies
Hard-to-fill vacancies
Vacancies which are hard-to-fill due to the quality of applicants
Vacancies which are hard-to-fill due to lack
of qualifications
Skill-shortage vacancies
Not hard-to-fill vacancies
Vacancies which are hard-to-fill due to insufficient number of
applicants Vacancies which are
hard-to-fill due to the quality and insufficient
number of applicants
Vacancies which are hard-to-fill due to poor
attitude, personality and motivation Vacancies which are
hard-to-fill due to lack of skills
Vacancies which are hard-to-fill due to lack
7
2
Employer experiences of skill deficiencies
Although the majority of establishments have the skills they require, almost 1.5 million
employees (five per cent of all employees) are deemed not fully proficient (have a skills
gap), and 103,000 vacancies are hard to fill as a result of skills shortages among
applicants (16 per cent of all vacancies). Skill-shortage vacancies are particularly
prevalent amongst Skilled Trade occupations as a proportion of the number of vacancies.
Skill gaps are most commonly experienced among Sales and Customer services staff,
and Elementary occupations both in absolute terms and as a proportion of all staff within
each occupation.
While skills challenges may not be common, where they do exist their impact can be
significant; three in five establishments with skill gaps (61 per cent) reported them as
impacting on performance. In almost all cases, proficiency problems and skills
deficiencies increase the workload of other (existing, more proficient) staff, and they also
commonly impact directly on meeting business objectives.
2.1
What is the unmet demand for skills?
For the vast majority of establishments, demand for skills is met through their current
workforce or through successful recruitment. Only three per cent of establishments report
having vacancies at the time of the survey that they have had difficulties filling because of
skills shortages (SSVs) and 13 per cent report having at least one member of staff that is
not fully proficient (a skills gap); 15 per cent have one or the other. Table 2.1 illustrates
8 Table 2.1 Key skills deficiency measures
Incidence Volume Density
Skill-shortage
vacancies (SSVs) 3% SSVs 103,000
SSVs as a % of
employment 0.4%
Skill gaps 13% Skill gaps 1,490,000 SSVs as a % of
all vacancies 16%
Either SSVs or
Gaps 15%
SSVs as a % of
HtF vacs 72%
Skill gaps /
[image:14.595.85.534.124.330.2]employment 5.4%
Figures rounded to nearest 1,000
The incidence of skill gaps and skill-shortage vacancies both increase with size of
establishment. This is illustrated in Table 2.2 below. Although the incidence of both
internal and external skills deficiencies is low, the volume of unmet demand for skills is
significant: almost 1.5 million employees are described as not fully proficient at their job
(five per cent of all employees) and just over 103,000 vacancies as hard to fill as a result
of a shortage of skills in the available labour market (72 per cent of all hard-to-fill
vacancies, 16 per cent of all vacancies). In establishments with fewer than five
employees just 2.7 per cent of the workforce are not proficient, compared to 5.4 per cent
[image:14.595.85.568.618.764.2]of the workforce in establishments with five or more staff.
Table 2.2 Incidence of SSVs and skill gaps by size of establishment
All 1-4 5-24 25-99 100-199 200-499 500+
Unweighted Base 87,572 18,955 47,770 15,951 2,707 1,625 564
% of establishments with
SSVs 3% 2% 4% 6% 11% 11% 13%
% of establishments with skill
9
2.2
How do skill deficiencies vary by occupation and what specific
skills are lacking?
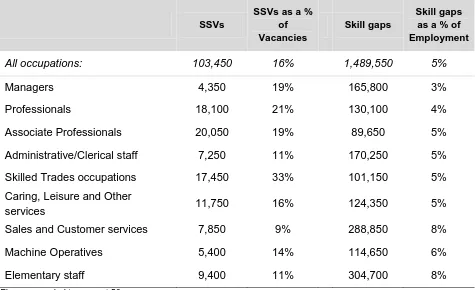
As Table 2.3 shows, the greatest volume of SSVs is for Associate Professionals,
Professionals and Skilled Trade occupations. In these occupations the proportion of
vacancies where skill shortages are encountered is higher than average; this is
particularly the case for Skilled Trades occupations, where the density of SSVs is 12
percentage points higher than any other occupational group. The picture is very different
when looking at where skill gaps lie within the existing workforce: skill gaps are most
commonly reported for Sales and Customer staff and Elementary staff.
Table 2.3 Volume and density of skill-shortage vacancies and skill gaps by occupation
SSVs
SSVs as a % of Vacancies
Skill gaps
Skill gaps as a % of Employment
All occupations: 103,450 16% 1,489,550 5%
Managers 4,350 19% 165,800 3%
Professionals 18,100 21% 130,100 4%
Associate Professionals 20,050 19% 89,650 5%
Administrative/Clerical staff 7,250 11% 170,250 5%
Skilled Trades occupations 17,450 33% 101,150 5%
Caring, Leisure and Other
services 11,750 16% 124,350 5%
Sales and Customer services 7,850 9% 288,850 8%
Machine Operatives 5,400 14% 114,650 6%
[image:15.595.80.555.355.645.2]Elementary staff 9,400 11% 304,700 8%
Figures rounded to nearest 50
The skills that were most commonly lacking among the existing workforce were
job-specific skills (48 per cent of those lacking proficiency) followed by a number of softer /
generic skills such as planning and organisation (39 per cent), customer handling (38 per
10
2.3
What are causes of skills gaps and how do they impact on the
business?
The two most common causes of skills gaps are that the employee(s) in question are new
to the role (47 per cent) and / or that any training being conducted is currently only
partially completed (46 per cent). Other reasons include staff lacking motivation (32 per
cent), staff having been on training but their performance not improving sufficiently (29
per cent), the introduction of new working practices (23 per cent) and staff not receiving
the appropriate training (also 23 per cent).
Over six in ten establishments (62 per cent) with skills gaps say it has an impact on
performance. The biggest impact of skills gaps, like recruitment difficulties, is on other
staff (48 per cent of establishments with skill gaps report that it leads to increased
workload for other staff). Other more direct or immediate performance impacts include:
increased operating costs (28 per cent), difficulties meeting quality standards (25 per
cent) and difficulties introducing new working practices (23 per cent).
2.4 Education leavers and their preparedness for work
Employers were asked for their views on the work readiness of those recruited straight
from education. Around a quarter of respondents (24 per cent) had recruited someone
straight from education in the two to three years prior to the survey. Most of them found
these recruits to be well prepared for work. However, their perceptions of the work
readiness of different sub-groups of labour market entrants varied quite considerably. In
England, Northern Ireland and Wales3 almost three in five recruiting 16 year school leavers found them to be well prepared (59 per cent), rising to 64 per cent of those
recruiting 17-18 year olds from school, 72 per cent of those recruiting from Further
Education and 82 per cent of those recruiting from Higher Education establishments
finding them well prepared.
3
11
Establishments who find recruits from education to be poorly prepared most commonly
attribute this to a lack of “experience” (maturity / experience of the working world). They
also commonly cite attitude / motivation. A lack of required skills / competencies is a third
12
3
Investment in skills and workforce
development
Most establishments provide training for their staff: 59 per cent had done so in the
previous 12 months; well over 90 per cent of those with 25 or more staff had provided
training, but this falls to just under half of those with fewer than five staff (47 per cent).
Overall 15 million staff have been trained in the last 12 months, equivalent to just over
half of the current workforce (54 per cent). The main reason establishments gave for not
providing training was that it was not needed as staff are already fully proficient, with just
a few pointing to failures of training supply.
3.1
How many establishments provide any training or development for
their employees?
Most establishments had funded or arranged on-the-job or off-the-job training or
development for at least one of their employees over the last 12 months (59 per cent).
These split almost evenly between those providing both off- and on-the-job training (29
per cent), and those providing either on-the-job only (17 per cent) or off-the-job only (13
[image:18.595.80.470.498.779.2]per cent). This is illustrated in Figure 3.1 below.
Figure 3.1 Proportion of establishments training
Off-the-job only 13%
Both on- and off-the-job
29%
On-the-job only 17% No training
13
In addition to measuring all on- and off-the-job training, the survey also captures wider
learning and development activities. The majority of establishments (76 per cent) had
provided one or more of the following broader development activities over the last 12
months:
supervision to ensure that employees are guided through their job role over time
(62 per cent);
opportunities for staff to spend time learning through watching others perform
their job (58 per cent);
allowing staff to perform tasks that go beyond their strict job role and providing
them with feedback (58 per cent).
The smallest establishments with fewer than five staff were the least likely to have
provided any of these broader development activities (66 per cent versus 92 per cent
among larger employers). Those providing off- or on-the-job training were more likely to
provide at least one of the broader development activities (88 per cent), although a
majority of non-trainers4 had also done so (58 per cent).
Overall, however, 17 per cent of all establishments reported that they had provided
neither training nor any of these broader development activities in the last 12 months.
The majority of these were in the 1-4 sizeband (25 per cent of 1-4s had provided no
development for staff); among those with 5 or more staff just four per cent had not
provided any training or broader development for their staff.
The following sections will now focus on off- and on-the-job training only, without
reference to the wider learning activities outlined here.
3.2
Which establishments are more likely to train?
Establishment size is a key factor influencing the likelihood that an employer provides on-
or off-the-job training for their staff. This is illustrated in Table 3.2 on the next page.
4 “non-trainers” are, for the purposes of this report, employers who have not arranged or funded any on- or off-the-job
14
Table 3.2 Incidence of training in the last 12 months by size of establishment
All 1-4 5-24 25-99 100-199 200-499 500+
Unweighted base 87,572 18,955 47,770 15,951 2,707 1,625 564
% of establishments who
train 59% 47% 77% 93% 96% 97% 97%
The establishment‟s position within their market, their „product market strategy‟5, is also
an influencing factor on the likelihood of them having trained, though to a lesser extent,
as Table 3.3 illustrates below.
Table 3.3 Incidence of training in the last 12 months by Product Market Strategy
All Very
low Low Medium High
Very high
Unweighted base 87,572 2,312 9,690 23,659 20,845 7,515
% of establishments who
train 59% 41% 50% 56% 63% 65%
Sector is also a factor:
Low proportion of establishments training: Construction (51 per cent), Agriculture,
Hunting, Forestry and Fishing (50 per cent), and Transport, Storage and
Communication (49 per cent)
High proportion of establishments training: Public Administration and Defence (89
per cent), Education (86 per cent), Health and Social Work (84 per cent), Mining
and Quarrying (75 per cent) and Financial services (70 per cent).
[image:20.595.80.522.362.449.2]
15
Those with skill gaps are far more likely to train than those without (83 per cent v. 56 per
cent). Although large establishments are more likely to have skill gaps, within each size
band those with skill gaps are more likely to train (e.g. among the smallest sites with
fewer than five staff, 68 per cent of those with skill gaps train compared with 46 per cent
of those without). This suggests that training is often a response to having staff lacking
proficiency, or that establishments that train are more aware of their business‟s need for
skills and their current skill levels.
3.3
What are the reasons for not providing training?
By far and away the main reason given by establishments for not training was that all
staff were already proficient (64 per cent). Having no money to train (10 per cent) or it not
being a priority (nine per cent) were the next most common reasons. Having no money to
train was particularly likely to be mentioned by medium sized establishments (mentioned
by 15 per cent of those with 25-99 staff and 24 per cent of those with 100-199 staff).
Among local government financed establishments, 27 per cent of non-trainers cited
having no money to train as a barrier. Non-training establishments with skills gaps were
more likely to cite money as a reason compared to non-trainers with no skills gaps (21
per cent v. 10 per cent).
Some supply-side issues were raised: six per cent of non-trainers said that at least part of
the reason for not training was that no training was available in the subject area they
wanted, and two per cent said it was because external courses were too expensive.
3.4
Planning and budgeting of training activity
Much training is being undertaken without planning or budgeting: although three-fifths of
sites train, only 38 per cent of all establishments have a training plan and 29 per cent
have a training budget. Approaching half of those with a training plan do not have a
training budget (44 per cent). The existence of a training plan or even of a training budget
does not guarantee that training takes place: 16 per cent of those with the former and 12
16
Overall 16 per cent of sites indicated that they were accredited with the Investors in
People Standard. The Investors in People standard encourages employers to plan any
training they provide for their people, ensuring that it is aligned with business needs. It is
therefore not surprising that a higher proportion of Investors in People accredited
establishments had a training plan compared to the general employer population (70 per
cent v. 38 per cent). This was also the case with a training budget (53 per cent v. 29 per
cent in the wider population).
3.5
What broad types of training have been provided?
Job-specific training has been provided by 84 per cent of establishments that train and
health and safety / first aid training by 71 per cent. Around half of trainers had provided
induction training (52 per cent) or training in new technology (47 per cent), and a third
had provided management or supervisory training (34 per cent and 32 per cent
respectively).
3.6
How many staff have received training?
Establishments reported that 15 million staff were trained in the 12 months prior to the
survey. Notwithstanding possible double counting (staff being trained by two different
firms in a 12 month period), this is equivalent to 54 per cent of the current workforce.
Generally, the proportion of employees trained tended to increase with the size of the
establishment, as Table 3.4 below shows.
Table 3.4 Proportion of staff trained by size
All 1-4 5-24 25-99 100-199 200-499 500+
Unweighted base 87,572 18,955 47,770 15,951 2,707 1,625 564
17
A higher proportion of staff are trained in the Health and Social Work (66 per cent) and
Education (65 per cent) sectors.
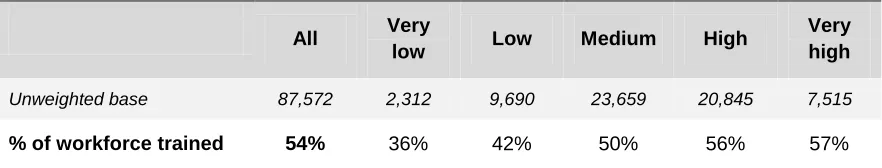
The proportion of staff trained increases with an establishment‟s product market strategy
[image:23.595.81.522.239.323.2](PMS) positioning as Table 3.5 shows below.
Table 3.5 Proportion of staff trained by Product Market Strategy
All Very
low Low Medium High
Very high
Unweighted base 87,572 2,312 9,690 23,659 20,845 7,515
% of workforce trained 54% 36% 42% 50% 56% 57%
Establishments with staff with skills gaps train a higher proportion of staff than those
without (58 per cent v 52 per cent).
3.7
Who receives training?
The proportion of Managers and Administrative/Clerical staff trained in the previous 12
months (45 per cent) was below the average for all occupations (54 per cent). Staff
employed in Caring, Leisure and Other services roles are the most likely to be trained (70
18 Table 3.6 Occupational patterns of training
% trained6
Managers 45%
Professionals 61%
Associate Professionals 56%
Administrative/Clerical staff 45%
Skilled Trades occupations 55%
Caring, Leisure and Other services staff 70%
Sales and Customer services staff 55%
Machine Operatives 47%
Elementary staff 48%
3.8
How much training is provided?
Establishments that train typically provide nine days training per person trained (though
nine per cent of trainers give more than 20). Results differ little by size of employer.
Among those providing only on-the-job training the average is 10 days per person
trained. This compares with seven days among those providing only off-the-job training.
3.9
Training to qualifications
Just over a quarter of all establishments (27 per cent) had trained staff towards nationally
recognised qualifications in the last 12 months (this was 43 per cent of establishments
that trained). There is a wide variation by sector, with the figure much higher among
trainers in Mining and Quarrying (68 per cent), Education (64 per cent), Health and Social
Work (60 per cent), Electricity, Gas and Water (55 per cent) and Public Administration (53
per cent).
19
3.10
Investment in training
Across the UK, total employer expenditure on training is estimated to have been £49bn
over the course of the 12 months prior to UK ESS 11. Please note that as with all data in
this paper, this figure has been collected across the entire UK for the first time in this
survey and cannot therefore be compared to the figures coming out of earlier surveys in
the constituent nations. Total expenditure splits relatively evenly between expenditure on
on-the-job training (£25.8bn) and off-the-job training (£23.2bn). The bulk of the outlay on
off-the-job training is course-related (£19.3bn), with other off-the-job training (such as
seminars, workshops, and open and distance learning) forming a far smaller component
(£3.9bn). Table 3.7 below illustrates how expenditure on training breaks down into its
20
Table 3.7 Training expenditure over the previous 12 months
Base: All trainers completing the Investment in Training survey (11,117). Note: ‘*’ denotes a figure greater than 0 per cent but less than 0.5 per cent.
The next table (Table 3.8) illustrates what this equates to per capita and per trainee.
Overall cost %
Total training spend: £49.0bn
Off-the-job training: Total: £23.2bn 47
Off-the-job training: course-related: £19.3bn 39
Trainee labour costs £5,417m 11
Fees to external providers £2,775m 6
On-site training centre £2,986m 6
Off-site training centre (in the same company) £653m 1
Training management £6,794m 14
Non-training centre equipment and materials £404m 1
Travel and subsistence £480m 1
Levies minus grants £-251m -*
Off-the-job training: other (seminars, workshops etc.): £3.9bn 8
Trainee labour costs £2,806m 6
Fees to external providers £1,128m 2
On-the-job training: Total: £25.8bn 53
Trainee labour costs £16,076m 33
21
Table 3.8 Training expenditure per capita and per trainee
Total training expenditure £49bn
Per capita training expenditure (total workforce) £1,775
Per capita training expenditure (training employers‟ workforce) £2,050
Per trainee training expenditure £3,375
Base: All trainers completing the Investment in Training survey (11,117).
Note: Per capita and per trainee figures are calculated using employment and trainee numbers from main UK ESS2011 data (unweighted base 87,572, weighted base 2,299,921). Per capita and per trainee expenditure rounded to the nearest £25.
Large establishments with 100 or more staff spend the most on training in absolute terms,
but spend less than average per trainee, as demonstrated by the data presented in the
final two columns of Table 3.9.
Table 3.9 Total training expenditure by size
Training expenditure
Unweighted
base Total
Per capita training expenditure (per trainee)
Per capita training expenditure
(whole workforce)
Overall 11,117 £49.0bn £3,375 £1,775
Employment
Fewer than 5 1,864 £7.5bn £6,325 £2,575
5 to 24 6,542 £12.7bn £3,750 £1,975
25 to 99 2,160 £12.0bn £3,000 £1,750
100 + 551 £16.8bn £2,625 £1,475
Base: All trainers completing the Investment in Training survey.
[image:27.595.80.496.449.684.2]22
The Real Estate and Business Activities sector spends the most on training in absolute
terms, and also spend more than average per trainee (see Table 3.10); the Education
sector also makes a large investment both overall and per trainee. Wholesale and Retail,
and Health and Social Work, on the other hand both account for a large proportion of UK
[image:28.595.82.521.235.639.2]trainees but their spend per trainee is lower.
Table 3.10 Total training expenditure by sector
Training expenditure
Unweighted
base Total
Per capita training expenditure (per trainee)
Per capita training expenditure
(whole workforce) Agriculture, Forestry & Fishing 88 £851m £5,725 £2,275
Mining and Quarrying 29 £82m £3,025 £1,425
Manufacturing 819 £3,472m £3,050 £1,425
Electricity, Gas, Water Supply 137 £320m £2,125 £1,150
Construction 660 £2,774m £3,975 £1,925
Wholesale and Retail Trade 1,827 £5,447m £2,350 £1,225
Hotels and Restaurants 1,060 £3,421m £3,625 £1,975
Transport and Communications 869 £3,524m £3,650 £1,575
Financial Services 220 £1,520m £2,450 £1,450
Real Estate / Business Activities 2,053 £9,482m £4,050 £2,075
Public Administration 236 £3,469m £3,650 £2,200
Education 560 £6,709m £4,075 £2,650
Health and Social Work 1,525 £5,431m £2,325 £1,550
Community, Social and
Personal Service Activities 1,034 £2,485m £3,600 £2,000
Base: All trainers completing the Investment in Training survey.
23
3.11
Assessing the impact of training
Two thirds of establishments that train assess the performance of employees following
their training (65 per cent). This increases:
by size of establishment (1-4: 59 per cent, 5-24: 70 per cent, 25+: 80 per cent);
in certain sectors: Health and Social Work (75 per cent), Financial Services (77
per cent), Education (78 per cent), and Public Administration (80 per cent);
In relation to product market strategy (from 49 per cent among those employers
with a very low PMS score to 72 per cent among those with a very high score).
Predictably those with a training plan (80 per cent) or budget (76 per cent) are much
24
Summary points
Whilst many employers do not experience skills deficiencies and problems
recruiting, in sectors and occupations where they are experienced they can have
an impact on the ability of establishments to function properly;
Three in five establishments fund or arrange training, and just over a half of the
workforce were trained over the 12 months prior to the survey;
The first ever UK-wide figure for employer training expenditure across the UK is
£49bn for the 12 months prior to the survey. This is not comparable with figures
previously calculated in the constituent nations.
Next steps
Further analysis of the 2011 UK Employer Skills Survey will follow in a full UK Report to
be published in March/April 2012. This will delve deeper into national, sectoral and
occupational comparisons, giving a full view of employer demand for skills in 2011.
Time series comparisons for each nation will be provided via a set of national reports,
which will follow the full UK Report. These will enable comparisons through time for each
nation, where the data is available to do so.
Access to data from the 2011 UK Employer Skills Survey is not publicly available at
present. We will release the data following the publication of our other outputs next year.
The questionnaire used for the 2011 UK Employer Survey is available, though, and can
25
Appendix A: Key Terms
This appendix gives a short guide to the key terms used in this report:
Hard-to-fill
vacancies
Vacancies which are proving difficult to fill, as
defined by the establishment (from question:
“Are any of these vacancies proving hard to fill?”)
Skill-shortage
Vacancies (SSVs)
Vacancies which are proving difficult to fill due
to the establishment not being able to find
applicants with the appropriate skills,
qualifications or experience.
Skills gaps A “skills gap” is where an employee is not fully proficient – i.e. is not able to do their job to the
required level.
Product Market
Strategy (PMS)
An establishment‟s PMS score is worked out
from the combined answers of four questions:
how customised their output is
how price dependent their offering is
how innovative the establishment is
whether outputs are premium or basic quality.
A high PMS score would indicate outputs are
customised, not price-dependent, premium
quality and the establishment often leads the
UKCES
Renaissance House Adwick Park
Wath upon Dearne Rotherham
S63 5NB
T +44 (0)1709 774 800
F +44 (0)1709 774 801
UKCES
28-30 Grosvenor Gardens London
SW1W 0TT
T +44 (0)20 7881 8900
F +44 (0)20 7881 8999
This document is available at
www.ukces.org.uk under
‘publications’
ISBN 978-1-906597-97-9