Academic
performance of
disadvantaged pupils
in and out of London:
an analysis
Research report
June 2018
2
Acknowledgements
The author would like to thank members of the analytical steering group for their guidance on the analysis: Dr Lindsey Macmillan, UCL IoE; Professor Pam Sammons, University of Oxford; Dave Thomson, FFT; Professor Anna Vignoles, University of Cambridge.
3
Contents
Acknowledgements 2
Contents 3
List of figures 4
Executive summary 6
Key findings 6
Introduction 8
Methodology 10
Propensity Score Matching 10
Attainment measures 11
Findings 13
Ethnicity 13
Attainment over time 14
Key stage 4 attainment 14
KS4 Attainment across the distribution 16
Key stage 2 attainment 19
Geography 20
Local Authority performance 20
Within London performance 22
Conclusion 28
References 30
Appendix A 31
4
List of figures
Figure 1: AY 2014/15 Capped Point Score distributions of FSM pupils in London and the
rest of England by ethnicity 14
Figure 2: The percentage of FSM pupils in London and the rest of England achieving five GCSEs with grades A*-C, including equivalent qualifications 15 Figure 3: The percentage of FSM pupils in London and the rest of England achieving five GCSEs with grades A*-C, excluding equivalent qualifications 16 Figure 4: Capped Point Scores for FSM pupils in London and the rest of England
including equivalent qualifications 18
Figure 5: The average GCSE only Capped Point Score for FSM pupils in London and the
rest of England 19
Figure 6: The percentle rank of FSM pupils in London and the rest of England for the
combined Key Stage 2 Reading and Maths mark 20
Figure 7: AY 2006/07 Distribution of Local Authority attainment using five A*-C excluding
eqivalent qualifications 21
Figure 8: AY 2014/15 Distribution of Local Authority attainment using five A*-C excluding
equivalent qualifications 22
Figure 9: AY 2006/07 Map of attainment of Local Authorities using five A*-C excluding
equiavlent qualifications 24
Figure 10: AY 2014/15 Map of attainment of Local Authorities using five A*-C excluding
equivalent qualifications 24
Figure 11: AY 2006/07 Map of attainment of London’s Local Authorities using five A*-C
excluding equivalent qualifications 25
Figure 12: AY 2014/15 Map of attainment of London’s Local Authorities using five A*-C
excluding equivalent qualifications 25
Figure 13: AY 2006/07 Map of attainment of Local Authorities using the average KS2
percentile rank of their FSM pupils 26
Figure 14: AY 2014/15 Map of attainment of Local Authorities using the average KS2
percentile rank of their FSM pupils 26
Figure 15: AY 2006/07 Map of attainment of London’s Local Authorities using the
5
Figure 16: AY 2014/15 Map of attainment of London’s Local Authorities using the
average KS2 percentile rank of their FSM pupils 27
Figure A.1: Balance diagnostics for the 2014/15 PSM – Pre- and Post-match Propensity
6
Executive summary
This report presents the findings of an analytical assessment of the London Effect – the observation that educational performance in London has been improving compared to the rest of England since the late 1990s, especially for economically deprived pupils. This analysis uses an alternative methodology to that seen in the current literature to investigate the London Effect, namely Propensity Score Matching. This technique is used to assess the attainment gap between London and the rest of England, which characterises the London Effect. The nature of the effect means that it is difficult to identify whether the London Effect is driven by demographic, socio-economic, geographical or other factors, and this analysis aims to shed new light on that. The analysis uses the National Pupil Database, covering Key Stage 2 and Key Stage 4 assessments over the academic years 2006/07 to 2014/15, looking at the educational performance of pupils in receipt of Free School Meals.
Key findings
Our Propensity Score Match effectively controls for socio-economic characteristics and demographic differences in pupil populations, inside and outside of London. In-line with existing literature, we continue to observe a London Effect with these controls,
confirming that factors beyond demography and socio-economic characteristics have a role in London’s improved performance over time.
In our analysis we find that amongst comparable pupils, the majority of ethnic groups, including White British pupils, perform better in London than in the rest of England in all academic years. As such it can be concluded that the London effect is not
explained by ethnicity alone.
The size of the attainment gap between London and the rest of England is dependent on the measure of attainment that is used – specifically, whether GCSE equivalent
qualifications are included in KS4 attainment measures. When equivalent
qualifications to GCSEs are excluded the performance of London’s pupils’ has improved over the last decade, compared to their peers in the rest of England.
When equivalent qualifications are included, the attainment gap between pupils in London and the rest of England has remained stable, but has not increased.
A further difference between educational performance in London and the rest of England involves pupils that have lower levels of attainment. London has a relatively small
7
8
Introduction
Economically disadvantaged children have relatively poor educational outcomes at every stage of their education. At the end of primary school, 66% of children eligible for Free School Meals (FSM) achieved the expected standard in 2015 compared to 83% of their non-FSM peers. Poor children then make less progress during secondary school. By age 16, the proportions attaining the expected level are 33% among FSM pupils compared to 61% for non-FSM pupils. These socio-economic gaps in attainment are enduring, having closed little over time, which reflects the complex and entrenched drivers of educational disadvantage.
However, it has been observed that children in London attain better than those in the rest of the country (e.g. Cook, 2013; Burgess, 2014; Baars et al, 2014; Blanden et al, 2015). This phenomenon is known as the ‘London Effect’. The differential attainment of
London’s pupils compared to those in the rest of England has been the subject of investigation by many. However, there is still no firm understanding of the actions or conditions that have driven it.
The attainment of London's disadvantaged pupils started to improve compared to the rest of the country in the late 1990s for both primary and secondary attainment (see e.g. Blanden et al, 2015). Prior to this, disadvantaged pupils in London performed similarly to, or worse than, other regions. In 1995, London’s disadvantaged pupils were about 4 percentage points lesslikely to achieve the headline GCSE measure relative to disadvantaged pupils elsewhere in England. London’s relative performance then improved steadily over time, particularly in Inner London, such that by 2013
disadvantaged pupils in Inner London were around 19 percentage points more likely to achieve on this measure.
Given the period over which the London Effect emerged and grew, Greaves et al. (2014) discuss the various interventions to which the London Effect might be attributed: e.g. the London Challenge, the Academies Programme, Teach First and differences in resources. However, these interventions, while they may have played a role in aiding and/or
sustaining the London Effect, were deployed too late to be primary drivers. Instead, the authors suggest that a more likely candidate for the cause of the improvements in attainment in London were the rollout of the National Literacy and Numeracy strategies. Although they note that more research is needed to understand if these strategies were driving factors of the London Effect, and if so, why they made such a differential impact in London.
9
disadvantaged pupils on the headline GCSE measure. However, it has a more limited role in explaining the very high levels of attainment seen in London. For example, accounting for pupil demographics does not fully explain the high numbers of pupils in London who achieve eight Grade Bs or better in Key Stage 4 qualifications (Burgess, 2014).
Ethnicity also cannot explain much of London's improvement over time (Greaves et al, 2014; Blanden et al, 2015). The performance of disadvantaged pupils in London has improved rapidly relative to other parts of the country. This is despite the gap in the share of non-White British pupils in Inner London schools, relative to those outside London, changing little over the decade to 2013. Nor does ethnicity explain the fact that disadvantaged White FSM pupils still perform better in London than in the rest of the country (House of Commons Education Select Committee, 2014).
10
Methodology
This report makes use of the National Pupil Database (NPD). This contains data on pupil characteristics and attainment records. Key Stage 2 (KS2) and Key Stage 4 (KS4) data from academic years 2005/06 through to 2014/15 are analysed, using data on
demographic and socio-economic characteristics to compare similar pupils within and outside of London using a Propensity Score Matching (PSM) methodology.
Propensity Score Matching
PSM is a non-experimental approach to evaluate the impact of an intervention or treatment. A benefit that Propensity Score Matching provides over alternatives is that it preserves the ‘granularity’ of the underlying data, thereby allowing a detailed analysis of the data after the matching controls have been applied. This is in contrast to, for
example, a regression analysis, where results are described by coefficients, and any underlying details in the data are often lost. By using the PSM method to control for differences in the London and rest of England pupil populations this report adds value to the current understanding of the London Effect, as there has been little investigation using this technique.
PSM attempts to balance the characteristics of two groups – one the “treatment group” and one the “control group” in an attempt to create a post-treatment sample from the control group that is comparable to the treatment group. This can then be used to assess the impact of the treatment. In this case, the “treatment” is attending a school located in London. The method involves using a set of characteristics to calculate a propensity score for each individual in the treatment and control groups. This score represents the likelihood of each individual being in the treatment group, based on characteristics used. This score is then used to select pupils from the treatment and control groups, such that the distribution of propensity scores, and thus the spread of characteristics, of the
subsequent “matched” treatment and control groups are similar.
The PSM model in this report calculates each pupil’s propensity score using Gender, Ethnicity, FSM eligibility, IDACI1 score and their school’s proportion of FSM pupils. These
factors were found through investigation to give the best quality matches, as well as being known descriptors of educational attainment. One-to-one matches between pupils in the treatment and control group are made using a non-replacement Nearest Neighbour matching algorithm2, which is valid as the number of pupils in the groups is large,
1 Income Deprivation Affecting Children Index is an area based measure of deprivation
2 PSM analysis attempts to create a control group with a similar propensity score distribution to the
11
however, a lack of pupils with high propensity scores in the control group, required the use of a caliper. The caliper limits available matches between pupils in the groups to a maximum difference between scores of a tenth of a standard deviation. This improves the quality of the resulting match, but does result in some London pupils being excluded from the analysis through not being matched. The final matched sample of London pupils has 4 percentage points fewer Black/Black British African pupils and 2 percentage points fewer Black/Black British Caribbean pupils compared to the unmatched population. This results in White British pupils being over-represented in the London Group matched sample by 4 percentage points, and other ethnicities by small amounts. A discussion of the model specification and goodness-of-fit analysis can be found in Appendix A.
The PSM model results in a loss rate of treatment (i.e. London) pupils of around 15%. As a representative example, in the AY 2014/15 for KS4, 469,037 pupils were in the pre-matched control group and 75,567 in the treatment group. After matching, 66,263 pupils in both the control and treatment groups were retained for analysis. The loss rate of around 15% is similar for all academic years and for both KS2 and 4.
Note that prior attainment is not included in the KS2 and KS4 PSM models. This is in contrast to most research in this area. Prior attainment is known to be an important factor to control for when assessing the impact of interventions, especially given London’s performance in Early Years and KS2 phases. However, excluding it from the PSM model allows an assessment of the whole London school system, rather than isolating
evaluations of impact to single phases. This allows an assessment at KS4 to explore the complete London Effect premium.
The R statistical language and MatchIt package were used to carry out our PSM analysis.
Attainment measures
The size of the London Effect is measured as the attainment gap between pupils in London and the rest of England. There are, however, several ways to measure
attainment. In this report the London Effect at KS4 is assessed using four measures of attainment:
• five ‘good’3 GCSEs including equivalent qualifications4,
control group based on the pairwise differences of their propensity scores. Matches are made starting with those pupils with the smallest pairwise differences, until the sample size of the control group equals that of the treatment group.
12
• five ‘good’ GCSEs excluding equivalent qualifications,
• Capped Point Score, and
• GCSE only average Capped Point Score.
Including and excluding qualifications equivalent to GCSEs gives an important view of the types of qualifications that pupils are taking in London and in the rest of England, and is especially interesting following the reforms to qualifications that occurred following the Wolf review in 2013/145.
Capped Point Scores allow us to overcome the binary nature of the five ‘good’ GCSE measures. A pupil’s Capped Point Score is calculated by converting their KS4 grades into points (e.g. A* = 58 points, A = 52, B = 46, etc), and taking the total of the points for their best eight grades. This allows us to take a more granular analysis of the distribution of attainment than using the five ‘good’ GCSE measure.
Investigating the London Effect at KS2 presents some technical challenges compared to KS4. The KS4 Capped Point Score and five ‘good’ GCSE measures have been relatively stable over the period, other than following the qualification reforms in 2013/14. At KS2 however, there have been several changes to the assessment tests, and only KS2 maths and reading remain relatively consistent over the period. As well as this, KS2 levels are not as granular as Capped Point Score, and exam marks are not directly comparable year to year. The ranking of pupils’ KS2 Maths and Reading marks is therefore used to evaluate the attainment of London and the rest of England over time. The performance of London and the rest of England can be compared by finding the difference in the overall ranking of the matched pupil in London and the rest of England at some point in the attainment distribution – for example the 15th (low attainment), 50th (average attainment)
and 85th (high attainment) percentiles of London FSM pupils and FSM pupils in the Rest
of England.
5 The relevant reforms following the Wolf review limited the equivalency of vocational qualifications so that
13
Findings
It is found that the London Effect is observable using the PSM methodology. Investigation of the London Effect annually since academic year 2006/07 shows that it has been
present over the period. Two stories of the London Effect emerge from this analysis: the role of GCSE equivalent qualifications, and the performance of pupils at the lower end of the attainment distribution.
Ethnicity
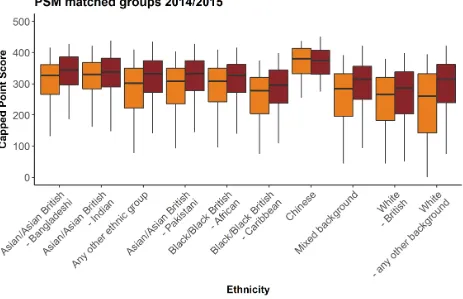
Previous investigations have discussed the role of ethnicity in the London Effect (e.g. Burgess 2014; Blanden, 2015), and find that Ethnicity plays an important role in the London Effect. After controlling for economic and demographic differences between London and the rest of England using the PSM model, FSM pupils in all major ethnic groups in London are found to outperform similar pupils in the rest of England, with the exception of Chinese pupils. This can be seen in Figure 1, which compares the Capped Point Score of London pupils to those in the rest of England that have been matched in the PSM model, grouped by ethnicity. The attainment of pupils in London is better, on average, than for those in the rest of England, and pupils in the upper and lower ends of the attainment distribution perform better in London than in the rest of England for these ethnic groups. Chinese pupils do not follow this trend. Instead, there is very little
difference between London and the rest of England, and that small difference is not statistically significant.
14
Figure 1: AY 2014/15 Capped Point Score distributions of FSM pupils in London (red) and the rest of England (orange) for the ten major ethnicity groups, using the PSM sample. The box-and-whiskers show the 5th, 25th, 50th, 75th and 95th percentiles from bottom to top.
Attainment over time
Key stage 4 attainment
As previously discussed, analysis by Blanden et al (2015) has shown that the size of the attainment gap between London and the rest of England has tended to increase since the early 2000s. Through investigation of the proportion of FSM pupils that achieve five ‘good’6 GCSEs it is found that the change in the size of the attainment gap over time is
dependent on whether attainment is measured with qualifications that are equivalent to GCSEs7 included or excluded.
15
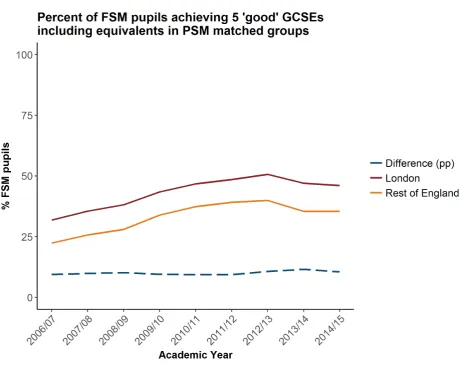
When attainment measures include GCSE equivalent qualifications, London’s FSM pupils have outperformed their peers by a fairly consistent 10 percentage points, from Academic Year 2006/07 to 2014/15 (Figure 2), but there is very little growth in the size of the attainment gap between London and the rest of England. When equivalent
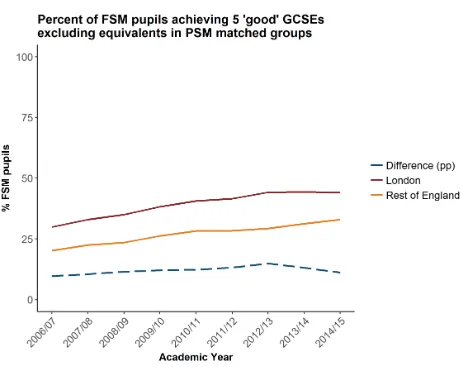
qualifications are excluded from the measure of attainment the performance of London’s FSM pupils has steadily improved compared to those in the rest of England. The
[image:15.595.60.521.227.595.2]attainment gap has grown from 10 percentage points in AY 2006/07 to 15 percentage points in AY 2012/13, before dropping back to 10 percentage points following the reforms following the Wolf review in 2013/14 that substantially reduced the value of equivalent qualifications (Figure 3).
16
Figure 3: The percentage of FSM pupils in London (red) and the rest of England (orange) that achieve five GCSEs with grades A*-C including English and Maths and excluding equivalent qualifications, using the PSM sample. The difference between London and the rest of England is shown by the blue dashed line.
KS4 Attainment across the distribution
Analysis of the Capped Point Score attainment distribution for all London and non-London FSM pupils (i.e. before we use PSM to take account of economic and
17
A strength of using the attainment distribution is that the attainment gap between London and the rest of England can be easily tested at various points – for example low, average and high attainment8.
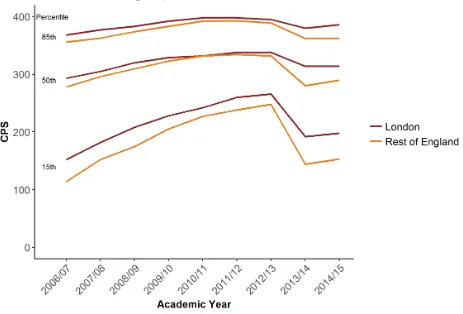
Figure 4 shows how attainment, measured by Capped Point Scores at low, average and high attainment levels changes over the period we have investigated. London pupils perform better across the whole of the attainment distribution, but the largest gap between the attainment of pupils in London and the rest of England is where pupils are achieving at a low level of attainment. FSM pupils in London that are ‘low attaining’ have been performing between 20 and 40 points better than their peers in the rest of England from AY 2006/07 to 2014/15. This is equivalent to the 15th percentile pupil in London
achieving almost seven GCSE grades9 more than their counterparts in the rest of
England. In 2014/15, at the 15th percentile in the attainment distribution, a pupil in London
is achieving the equivalent of five C grades at KS4, while the equivalent pupil in the rest of England achieves five D grades.
The impact the qualification reforms following the Wolf review had on pupil attainment in London and the rest of England can clearly be seen in Figure 4. In both areas, the attainment of lower attaining pupils was more heavily impacted than the attainment of high attaining pupils, as can be seen by the size of the drop between 2012/13 and 2013/14. Lower attaining pupils are more likely to take vocational subjects, which explains this, but the observation that across the whole attainment distribution pupils in London were less negatively affected by the reforms indicates that pupils in London were less likely to be taking non-GCSE qualifications before this reform.
8 Here we define low, middle and high as the 15th, 50th, and 85th percentiles in the attainment distribution 9 In the Capped Point Score measure, a single grade difference, e.g. the difference between a B and A
18
Figure 4: Capped Point Scores for FSM pupils in London (red) and the rest of England (orange), including equivalent qualifications, using the PSM sample, at the 15th, 50th and 85th percentiles in
the attainment distributions.
If Capped Point Scores are calculated for GCSE qualifications only (i.e. excluding equivalent qualifications), pupils in London achieve almost half a grade per GCSE10
higher than their counterparts in the rest of England on average (Figure 5).
19
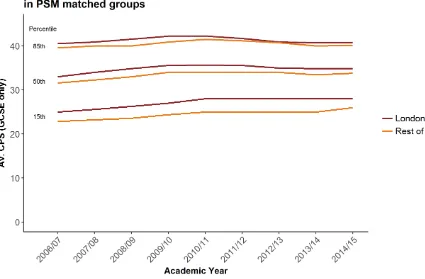
Figure 5: The average Capped Point Score (GCSE only) for FSM pupils in London (red) and the rest of England (orange), excluding equivalent qualifications, using the PSM sample, at the 15th, 50th and
85th percentiles in the attainment distributions.
The change in the gap between London and the rest of England for average and high attaining pupils follows similar trends to lower attaining pupils, although the gap is
smaller. When including GCSEs and equivalents (Figure 4) the average attaining London FSM pupil in AY 2006/07 scored 18 points (equivalent to three GCSE grades) more than their counterpart, but this gap dropped to almost zero in AY 2010/11 before rising to around 20 points in AY 2014/15. The high attaining London FSM pupil showed a fairly stable performance difference of 10 points from AY 2006/07 to 2012/13, but this rose to around 20 points in AY 2014/15. However, with GCSE only Capped Point Scores (Figure 5) both the average and high attaining London FSM pupil have had a fairly consistent performance difference of around a third and a sixth of a GCSE grade per GCSE, respectively.
Key stage 2 attainment
The attainment gaps between London and the rest of England at KS2 over the period can be seen in Figure 6. After taking into account economic and demographic differences, London’s FSM pupils at the 15th, 50th and 85th percentiles are consistently higher in the
20
been pulling away from their counterparts in the rest of England since AY 2006/07. While for high attainers London’s performance has been relatively stable since 2009/10
[image:20.595.62.502.123.420.2]compared to the rest of England.
Figure 6: The percentle rank of FSM pupils in London (red) and the rest of England (orange) for the combined Key Stage 2 Reading and Maths mark, using the PSM sample, at the 15th, 50th and 85th
percentiles in the attainment distributions.
Geography
Local Authority performance
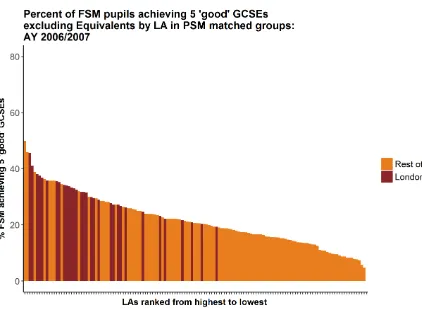
It has been demonstrated that London’s pupils perform better than their peers in the rest of England and that also applies at the level of most Local Authorities. London’s LAs are over-represented amongst the highest performing LAs in England. London’s overall high performance isn’t only being driven by a small number of LAs or high performing schools – Figure 7 (AY 2006/07) and Figure 8 (AY 2014/15) show, excluding equivalent
21
22
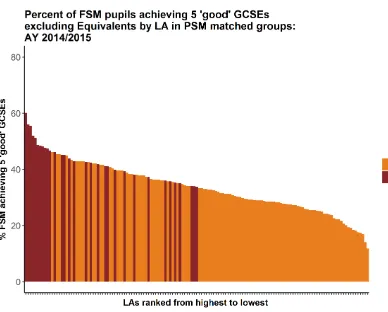
Figure 8: AY 2014/15: Distribution of Local Authority attainment (London = red; rest of England = orange) using five A*-C excluding equivalent qualifications, using the PSM sample. Local
Authorities with fewer than 10 FSM pupils in the PSM match are excluded.
Within London performance
Previous analysis (Greaves et al., 2014; Blanden et al., 2015) using the Youth Cohort Survey and NPD has shown that FSM pupils in London started to pull away from their peers elsewhere in the late 1990s. Their analysis also showed that Inner and Outer London had different attainment trajectories over the period. This suggests that there is variation in attainment across London’s geography. Investigation into how performance in LAs has changed over time could identify if certain areas of London were leaders in innovations that improved performance that were later picked up by other LAs; or if London’s performance improved as a whole or sporadically.
Visual inspection of year-by-year performance changes in Local Authorities and their geographical relationships over London suggests that there is some evidence of neighbourhood, or local, effects. Observation of the change in performance in Local Authorities over time suggests that in some instances an improvement in a Local
23
Focussing on London’s LAs, there is a more consistent level of high performance over time. There appears to be a “node” of high performance in the Central West area of the capital – Kensington and Chelsea consistently stands out as being a high performer, often appearing to “lead” the improvements in neighbouring LAs – although a causal relationship has not been established. Inspection of the time series performance of London’s LAs shows that, generally, East London trails the improvements on which Central and West London lead.
Comparison between the attainment at KS4 of FSM pupils in our controlled samples in London and the rest of England are shown in Figure 9 to Figure 12. Across the rest of England we see improvements in attainment over the period, but there remains in all years a wide variation in the performance of LAs.
Similar trends to those seen for KS4 attainment are seen in analysis of KS2 attainment. Figure 13 to Figure 16 show the average percentile rank of FSM pupils for the rest of England and London in AYs 2008/09 and 2014/15. Comparison of the figures shows that KS2 attainment in both London and the rest of England improves over time, but in
London we see more progress compared to the rest of England. In London, we again see that West and Central West areas of London appear to “lead” the improvement in
attainment in the capital in 2006/07, and similarly to KS4, Kensington and Chelsea is a clear high performer. This observation is only noted as a visual relationship, and has not been proven to be causal.
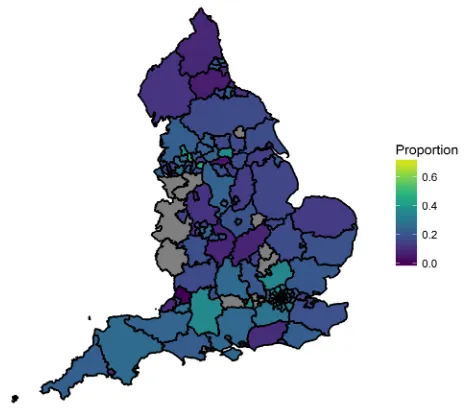
Figure 9: Attainment of Local Authorities using five A*-C including English and Maths, excluding equiavlent qualifications, using the PSM sample, for AY 2006/07. Local Authorities with fewer than 10 FSM pupils in the PSM match are excluded.
Figure 11: Attainment of London’s Local Authorities using five A*-C including English and Maths, excluding equivalent qualifications, using the PSM sample, for AY 2006/07. Local Authorities with fewer than 10 FSM pupils in the PSM match are excluded.
Figure 13: Attainment of Local Authorities using the average KS2 percentile rank of their FSM pupils, for the PSM sample, for AY 2006/07. Local Authorities with fewer than 10 FSM pupils in the PSM match are excluded.
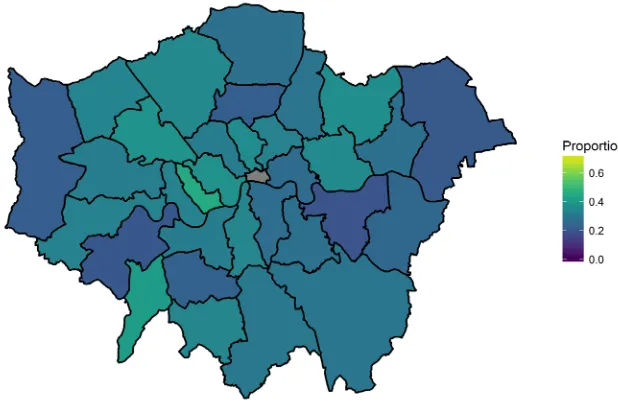
Figure 15: Attainment of London’s Local Authorities using the average KS2 percentile rank of their FSM pupils, for the PSM sample, for AY 2006/07. Local Authorities with fewer than 10 FSM pupils in the PSM match are excluded.
[image:27.842.94.429.94.304.2]Conclusion
Consistent with existing literature, the London Effect is observable as a gap between the attainment of economically disadvantaged pupils in and out of London. This remains after demographic and socio-economic controls have been applied.
This analysis uses a PSM model to account for demographic and socio-economic differences between pupils in London and the rest of England, using gender, ethnicity, FSM eligibility, IDACI score and school proportion of FSM pupils. This report shows that PSM is an effective means of investigating the London Effect, and provides the
opportunity to perform novel analysis on the problem.
It is found that the majority of ethnic groups perform better in London that in the rest of England in all academic years. Chinese pupils are the exception to this, but we find that there is not a statistically significant difference in the attainment Chinese pupils in London and the rest of England. That White British pupils in London schools significantly
outperform their peers in the rest of England, and represent the single biggest ethnic group in London, indicates that London’s more diverse ethnic make-up is not the sole explanation for the London Effect.
Including or excluding GCSE equivalent qualifications is found to effect the size of the London Effect. While the gap exists for both measures of attainment, the inclusion of equivalent qualifications acts to prevent the attainment gap increasing over the period AY 2006/07 to 2014/15. When equivalent qualifications are excluded, the size of the
attainment gap increases with time over the period AY 2006/07 to 2012/13, before reducing from 2013/14.
An area of difference between educational performance in London and the rest of England is found to be in pupils that have lower levels of attainment. The educational performance of these pupils is significantly better in London than those in the rest of England, and the performance of the lowest attaining pupils has been improving more in London than in the rest of England. This result is an indication that pupils in London, across all academic ability ranges were more likely to be taking a more ‘academic’ set of subjects at KS4 than in the rest of England. The size and growth of the London Effect may have been constrained by a larger take-up of vocational qualifications outside of London. However, that low attaining pupils in London are making continued progress is interesting, and invites questions to understand what has, and is, happening in London for this specific group. Investigation of the attainment of this group nearer the earlier stages of the London Effect, changes in the performance in specific subjects,
attendances rates could all provide valuable insight into the details and drivers of the London Effect.
29
Authorities have been in the top performing third of England’s Local Authorities over the period. However, while most of London’s Local Authorities are high performing compared to those in the rest of England, there has been significant variation in the attainment in Local Authorities across London over the period. While London is something of an island in terms of educational performance, it is the case that Central and Western Local
Authorities in London have been consistently better performers over the period compared to other Local Authorities in London. Visual analysis of the change in performance in neighbouring Local Authorities over the period suggests that there may be local
30
References
Baars, S., Bernardes, E., Elwick, A., Malortie, A., McAleavy, T., McInerney, L., Menzies, L. and Riggall, A., 2014, Lessons from London schools: Investigating the success, CfBT Education Trust
Blanden, J., Greaves, E., Gregg, P., Macmillan, L. and Sibieta, L., 2015, Understanding the improved performance of disadvantaged pupils in London, Social Policy in a Cold Climate, 2-47
Burgess, S., 2014, Understanding the success of London’s schools, Centre for Market and Public Organisation (CMPO) Working Paper, 14, 333
Cook, C., 2013, London Schoolchildren perform the best, Financial Times, 13/1/13 Greaves, E., Macmillan, L. and Sibieta, L., 2014, Lessons from London schools for attainment gaps and social mobility, SMCP Research Report SMCP-RR363
31
Appendix A
PSM model specification and goodness-of-fit
The PSM model specified uses pupil demographic (Gender, Ethnicity) and socio-economic (FSM, IDACI, proportion of FSM pupils in school) to identify comparable
groups of pupils from London (Treatment group) and the rest of England (Control group). We use the matchit package in R, and specify our model as:
matchit(formula = LondonPupil ~ Gender + Ethnicity + FSM + IDACI + schPropFSM, data = pupData.clean,
method = "nearest", ratio = 1,
caliper = 0.1)
We use a non-replacement nearest neighbour algorithm to create pairs of pupils with the smallest pair-wise difference in their propensity scores, from which the Treatment and Controls are created. A caliper of 0.1 SD is used to limit instances of poor quality pairings.
A PSM match is made for each academic year in our analysis, resulting in nine individual PSM analyses (2006/07 to 2014/15). The matches for the nine academic years have similar diagnostics, so for brevity we only discuss goodness-of-fit in detail for KS4 2014/15.
For 2014/15 the model specification results in a post-matching Treatment and Control group of 66,263 pupils each. This is from a pre-match dataset of 469,037 (Control) and 75,567 (Treatment). The use of a caliper resulted in 9,304 pupils being excluded from the post-match Treatment group.
32
All data Matched data
Means
Treated Means Control Mean Diff Means Treated Means Control Mean Diff
Distance 0.35 0.11 0.24 0.30 0.30 0.01
GenderF 0.50 0.49 0.00 0.50 0.50 0.00
GenderM 0.50 0.51 0.00 0.50 0.50 0.00
EthnicityAIND 0.05 0.02 0.04 0.06 0.06 0.00
EthnicityAOTH 0.05 0.01 0.03 0.05 0.05 0.00
EthnicityAPKN 0.04 0.03 0.01 0.05 0.05 0.00
EthnicityBAFR 0.13 0.01 0.12 0.10 0.09 0.00
EthnicityBCRB 0.06 0.01 0.05 0.04 0.04 0.01
EthnicityBOTH 0.02 0.00 0.02 0.02 0.02 0.00
EthnicityCHNE 0.01 0.00 0.00 0.01 0.01 0.00
EthnicityMOTH 0.03 0.01 0.02 0.04 0.03 0.00
EthnicityMWAS 0.01 0.01 0.00 0.01 0.01 0.00
EthnicityMWBA 0.01 0.00 0.01 0.01 0.01 0.00
EthnicityMWBC 0.02 0.01 0.01 0.03 0.03 0.00
EthnicityNOBT 0.01 0.00 0.00 0.01 0.01 0.00
EthnicityOOTH 0.06 0.01 0.05 0.05 0.05 0.00
EthnicityREFU 0.01 0.00 0.00 0.01 0.01 0.00
EthnicityWBRI 0.31 0.82 -0.51 0.35 0.37 -0.01
EthnicityWIRI 0.01 0.00 0.01 0.01 0.01 0.00
EthnicityWIRT 0.00 0.00 0.00 0.00 0.00 0.00
EthnicityWOTH 0.11 0.03 0.08 0.11 0.11 0.00
EthnicityWROM 0.00 0.00 0.00 0.00 0.00 0.00
KS4_FSM 0.20 0.12 0.07 0.18 0.18 0.01
KS4_IDACI 0.34 0.20 0.14 0.32 0.31 0.00
[image:32.595.60.528.56.582.2]schPropFSM 0.19 0.12 0.07 0.18 0.17 0.00
Table A.1: Balance diagnostics for the 2014/15 PSM – Factor checking
33 Academic
Year Pre-match D Post-match D
2006/07 0.47 0.03
2007/08 0.48 0.02
2008/09 0.49 0.02
2009/10 0.48 0.02
2010/11 0.50 0.02
2011/12 0.50 0.02
2012/13 0.50 0.02
2013/14 0.50 0.02
[image:33.595.56.295.56.295.2]2014/15 0.50 0.02
Table A.2: Balance diagnostics all years – KS-test D-statistic improvement
[image:33.595.63.469.358.654.2]34 © Department for Education 2018
Reference: DFE-RR785
ISBN: 978-1-78105-888-6
The views expressed in this report are the authors’ and do not necessarily reflect those of the Department for Education.
Any enquiries regarding this publication should be sent to us at:
richard.ALLISON@education.gov.uk or www.education.gov.uk/contactus