FERTILITY AND PROXIMATE DETERMINANTS IN RURAL TAMIL NADU
by
Annamalai C. Muthiah
A thesis submitted for the degree of Doctor of Philosophy
at the Department of Demography, Research School of Social Sciences, The Australian National University,
Canberra
This thesis is based upon original research carried out by the author as a research scholar in the Department of Demography of the Research School of Social Sciences at The Australian National University.
A c k n o w l e d g e m e n t s
Many individuals have helped me at various stages in many ways to finish this thesis. As it is impossible to achnowledge all, I would like to single out some of those who deserve special thanks.
Th e completion of this thesis was made possible by the Australian National University and the Popul ati on Council, which granted me the research scholarship.
I a m very f ort unate to have had as my supervisors. Professor J.C.Caldwell t h ro u g h o u t my thesis prep a ra ti on , Dr.V.Hull and Dr.Kr ishnamoort hy in the initial stages
(
of my thesis and D r . M. G. Sa nt ow in the later stages. All have been generous with their time and provided me with invaluable guidance t hro ugho u t this research endeavour. Professor Caldwell and P a t Caldwell were helpful in so many ways in addition to offering critical c omme nts on my chapters. In the later stages of my thesis preparation, Dr. M .G. Sa nt ow was of invaluable help in giving constructive suggestions and comments as well as helping me in formulat ing my analysis. 1 thank Ti m Dyson. Dr . Ba r ba ra Gross and Dr.Beverly Winikoff for reading individual chapters and offering useful comments, and my fellow student s, especially Raju. Mrs.Jenny Widdowson always assisted without hesitation with any problem relating to the comput er. I owe a debt of grat itude to Mrs Wendy Cosford who read my thesis more t h an once and made editorial changes; more t han this I a m thankful to her for being an invaluable friend t hro ug h ou t my stay in Can b er ra . Ms. Nola Mil thorp was always helpful, friendly and supportive.
ii
A b s t r a c t
This study analyses the reproductive behaviour of four cultural groups who live in t he s ame rural social environment in Tamil Nadu. India. More specifically, the levels and differentials in fertility and its proximate dete rmi na nt s, with cultural group as a study unit, form the focus of this thesis. A t t e m p t s are also made, within the constraints of d a t a availability, to clarify certain relations between proximate d e te rmi na nts and fertility. The d a t a come from a four year longitudinal study with several revisits to the study women. Th e four cultural groups are three Hindu caste groups, namely Vellalas. Scheduled Castes and O t he r Hindus, and Muslims.
The cultural groups are clearly different from each other in their levels of fertility as well as in the levels of proximate deter mi nants. Muslims have the highest fertility followed by Scheduled Caste Hindus, Ot her Hindus and Vellalas. Even in more homogeneous socio-demographic subgroups the cultural group differentials persist. The wi t hin-group differentials, in contr ast, are generally weaker. Caste or religious group a pp e ar s to be a very a ppropr iat e unit to study the fertility in view of their homogeneity,which is likely to have arisen from their social norms on proximate d e t e r m i n a n t s being different. It appears t hat the explanations for the cultural group differentials may lie in age at marriage and certain family regulation practices t h at could only be indirectly esti mat ed such as the age at which women stop childbearing. The repor ted contraceptive use does not a ppe ar to reflect the extent of family limitation e s ti ma ted using age pa tt ern s of fertility. Length of breastfeeding a ppear to exhibit interesting differentials in maternal literacy and mat ernal occupation.
T a b le o f C o n te n ts
I i i i
1. I n t r o d u c t i o n 0
1.1 T h e S e t t i n g : R e c e n t P o p u l a t i o n T r e n d s in I n d i a 0
1 .1 .1 F e r t i l i t y 2
1 .1 .2 R e g i o n a l D i f f e r e n t i a l s 6
1 .2 I n t e r m e d i a t e F e r t i l i t y V a r i a b l e s F r a m e W o r k 7
1 .2 .1 D a v i s a n d B l a k e F r a m e w o r k 7
1 .2 .2 C r i t i q u e b y T i e n 9
1.2 .3 E l a b o r a t i o n s b y Y a u k e y 11
1 .2 .4 D i s c u s s i o n 12
1.3 C a s t e a n d R e l i g i o n a s A c t i v e S o c ia l F o r c e s 15
1.4 A i m s o f t h e s t u d y 22
2. S t u d y D e s i g n , S t u d y A r e a a n d C h a r a c t e r i s t i c s o f S t u d y P o p u l a t i o n 25
2.1 S t u d y D e s i g n 25
2 .2 S t u d y A r e a 29
2 .3 C a s t e a n d R e l i g i o u s B a c k g r o u n d o f S t u d y G r o u p s 32
2 .3 .1 S c h e d u l e d C a s t e s 33
2 .3 .2 V e l l a l a s 35
2 .3 .3 M u s l i m s 36
2 .3 .4 O t h e r H i n d u s 38
2.4 C h a r a c t e r i s t i c s o f t h e S t u d y G r o u p s a s O b t a i n e d f r o m S u r v e y 38
2 .4 .1 S o c i o - e c o n o m i c c h a r a c t e r i s t i c s 38
2 .4 .2 D e m o g r a p h i c c h a r a c t e r i s t i c s 43
3. L e v e ls a n d C o r r e l a t e s o f F e r t i l i t y 48
3 .1 I n t r o d u c t i o n 48
3 .2 R e v i e w o f L i t e r a t u r e o n R e l i g i o u s a n d C a s t e D i f f e r e n t i a l s in 52 F e r t i l i t y
3.3 L e v e ls o f f e r t i l i t y 56
3 .3 .1 C h i l d r e n E v e r B o r n 56
3 .3 .2 C u r r e n t F e r t i l i t y 59
3 .3 .3 S p e e d o f R e p r o d u c t i o n 60
3 .3 .4 C u r r e n t M e n s t r u a l S t a t u s 63
3 .4 P r i m a r y S t e r i l i t y 64
3 .5 E x t e n t o f F a m i l y L i m i t a t i o n 65
3 .6 D i f f e r e n t i a l s in F e r t i l i t y 71
3 .6 .1 C h i l d r e n E v e r B o r n 71
3 .6 .2 C u r r e n t F e r t i l i t y 75
3 .6 .3 E x t e n t o f F a m i l y L i m i t a t i o n 77
3 .6 .4 C u l t u r a l G r o u p D i f f e r e n t i a l s in F e r t i l i t y a n d F a m i l y 78 L i m i t a t i o n in H o m o g e n e o u s S u b g r o u p s
3 .6 .5 S p e e d o f r e p r o d u c t i o n 79
4. E x t e n t o f C o n t r a c e p t i v e P r a c t i c e 118
i v
4 . 0 . 2 L i v in g C h i l d r e n A m o n g C o n t r a c e p t o r s 1 24
4 . 0 . 3 A g e a t l a s t b i r t h 124
4 .1 D i f f e r e n t i a l s in R e p o r t e d F e r t i l i t y R e g u l a t i o n 127 5. A g e a t F i r s t M a r r i a g e : T r e n d s a n d D i f f e r e n t i a l s 13 6
5 .1 I n t r o d u c t i o n 136
5 .2 L e v e ls a n d T r e n d s in A g e a t M a r r i a g e 139 5 .3 D i f f e r e n t i a l s in A g e a t F i r s t M a r r i a g e 145
5 .4 E x t e n t o f M a r i t a l D i s r u p t i o n 147
6. A g e a t F i r s t M a r r i a g e a n d F e r t i l i t y 155
6 .1 I n t r o d u c t i o n 155
6 .2 A g e a t M a r r i a g e a n d F a m i l y S ize 15 6
6 .3 T h e I n t e r v a l b e t w e e n M a r r i a g e a n d F i r s t B i r t h 161 6 .4 A g e a t m a r r i a g e a n d A g e - S p e c if ic M a r i t a l F e r t i l i t y R a t e s 16 9 6 .5 H o w m u c h d o e s f e c u n d i t y d e c li n e w i t h a g e ? : A r e v i e w o f 181
b i o m e d i c a l e v i d e n c e
7. B r e a s t f e e d i n g a n d L a c t a t i o n a l A m e n o r r h o e a 2 0 5
7.1 I n t r o d u c t i o n 205
7 .2 R e v i e w o f I n d i a n S t u d i e s 207
7 .3 O b j e c t i v e s o f t h e c h a p t e r 21 3
7 .4 D a t a 21 3
7 .5 A n a l y s i s o f D a t a 215
7 .6 R e s u l t s : F o r E a c h C u l t u r a l G r o u p 2 1 7
7 .6 .1 B r e a s t f e e d i n g 2 1 7
7 .6 .1 .1 M a t e r n a l A g e 21 8
7 .6 .1 .2 M a t e r n a l L i t e r a c y 2 1 9
7 .6 .1 .3 S o c i o e c o n o m i c S t a t u s 2 2 0
7 .6 .1 .4 O t h e r C h a r a c t e r i s t i c s 2 2 0
7 .6 .2 L a c t a t i o n a l A m e n o r r h o e a 2 2 0
7 .6 .3 D i s c u s s i o n 22 2
7.7 R e s u l t s : F o r P o o l e d S a m p l e 223
7 .7 .1 M a t e r n a l L i t e r a c y S t a t u s 225
7 .7 .2 M a t e r n a l E m p l o y m e n t 232
8. C o n t r a c e p t i v e E f f e c t o f B r e a s t f e e d i n g B e y o n d R e s u m p t i o n o f 263 M e n s t r u a t i o n - D e m o g r a p h i c E v i d e n c e
8.1 B r e a s t f e e d i n g A n d C o n c e p t i o n D u r i n g M e n s t r u a t i n g i n t e r v a l s 263 8.2 C h i l d D e a t h a n d S u b s e q u e n t F e r t i l i t y - R o l e o f B r e a s t f e e d i n g 2 70 9. C o n t r a c e p t i v e E f f e c t o f B r e a s t f e e d i n g B e y o n d R e s u m p t i o n o f 286
M e n s t r u a t i o n : B i o m e d i c a l E v i d e n c e
9.1 I n t r o d u c t i o n 2 86
9 .2 E n d o c r i n o l o g y o f l a c t a t i o n a l a m e n o r r h o e a 288 9 .3 O v u l a t o r y i n a d e q u a c i e s in p o s t p a r t u m c y c le s 290 9.4 P R L c o n c e n t r a t i o n s d u r i n g t h e p o s t p a r t u m p e r i o d 297 9.5 O v u l a t o r y i n a d e q u a c y in p a t h o l o g i c a l h y p e r p r o l a c t i n e m i a 298 9 .6 P h a r m a c o l o g i c a l h y p e r p r o l a c t i n e m i a 305 9 .7 S e r u m P R L L e v e ls in L o n g - T e r m B r e a s t f e e d i n g 306 9 .8 S i m i l a r i t i e s b e t w e e n t h e t h r e e k i n d s o f h y p e r p r o l a c t i n e m i a 310
9 .9 C o n c l u s i o n s 311
V
LIST OF TABLES
Table 2.1. CHARACTERISTICS OF THE STUDY POPULATION BY
CULTURAL GROUP - 1 JUNE 1971 40-44
Table.2.2. AGE DISTRIBUTION OF CURRENTLY MARRIED STUDY WOMEN
BY CULTURAL GROUP - 1 JUNE 1971 44
Table.2.3. LIFE TABLE ESTIMATES OF CHILD MORTALITY BY
CULTURAL GROUP; PROSPECTIVE DATA 46
Table 3.1. MEAN NUMBER OF CHILDREN EVER BORN BY AGE OF WOMAN
AND CULTURAL GROUP AS ON 1 JUNE 1971 80
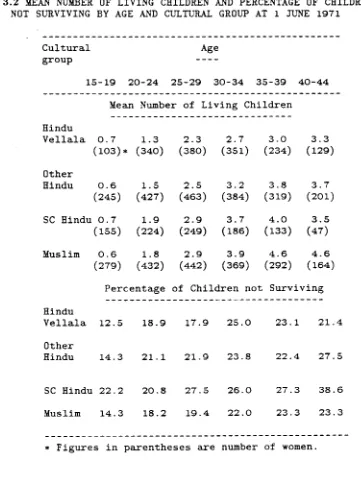
Table 3.2. MEAN NUMBER OF LIVING CHILDREN AND PERCENTAGE OF
CHILDREN NOT SURVIVING BY AGE AND CULTURAL GROUP AS ON
1 JUNE 1971 81
Table 3.3. AGE SPECIFIC MARITAL FERTILITY RATES (ASMFR*) AND
TOTAL MARITAL FERTILITY RATE (TMFR) BY CULTURAL GROUP
-PROSPECTIVE DATA 1971-73 82
Table 3.4. RELATIVE CONTRIBUTION OF FERTILITY IN EACH AGE GROUP TO TOTAL MARITAL FERTILITY BY CULTURAL GROUP
-PROSPECTIVE DATA 1971-73 83
Table 3.5. LIFE TABLE ESTIMATES OF PERCENTAGE CONCEIVING AT THE
END OF SPECIFIED MONTHS SINCE LAST LIVE BIRTH BY CHILDREN
EVER BORN AND CULTURAL GROUP - PROSPECTIVE DATA 84
Table 3.6. AGE STANDARDIZED- PERCENTAGES OF WOMEN BY MENSTRUAL
STATUS AND CULTURAL GROUP AS ON 1 JUNE 1971 85
Table 3.7. PERCENTAGE OF WOMEN WHO HAVE NOT EXPERIENCED A
PREGNANCY WHO HAVE NOT EXPERIENCED A LIVE BIRTH AND WHO HAVE NO LIVING CHILD BY AGE 40-44 BY CULTURAL GROUP
- AS ON 1 JUNE 1971 86
Table 3.8. PARITY DISTRIBUTION OF BIRTHS BY CULTURAL GROUP
-PROSPECTIVE DATA 87
Table 3.9. TOTAL MARITAL FERTILITY AFTER AGE 30 (TMFR 30+) AND AS PERCENTAGE OF TOTAL MARITAL FERTILITY (TMFR 15+) AND
INDICES OF FERTILITY CONTROL BY CULTURAL GROUP - 88
PROSPECTIVE DATA 1971-73
Table 3.10. MEAN CHILDREN EVER BORN BY AGE AND EDUCATION OF WOMAN
AND CULTURAL GROUP - 1 JUNE 1971 89
Table 3.11. MEAN CHILDREN EVER BORN BY AGE OF WOMAN, EDUCATION
OF HUSBAND AND CULTURAL GROUP - 1 JUNE 1971 90 Table 3.12. MEAN CHILDREN EVER BORN BY AGE OF WOMAN, OCCUPATION
OF HUSBAND AND CULTURAL GROUP - 1 JUNE 1971 91 Table 3.13. MEAN CHILDREN EVER BORN BY AGE OF WOMAN, TYPE OF
vi
T a b l e 3.14. TOTAL MARITAL FERTILITY (TMFR 15 + ) ,TOTAL MARITAL FERTILITY AFTER AGE 30 AND AS PERCENTAGE OF TMFR
(15+) AND AGE STANDARDIZED MARITAL FERTILITY (I’g)
BY SOCIO-ECONOMIC CHARACTERISTICS 93
T a b l e 3.15. TOTAL MARITAL FERTILITY (TMFR 15 +), TOTAL MARITAL FERTILITY AFTER AGE 30 AND AS PERCENTAGE OF TMFR
(15 +) AND AGE STANDARDIZED MARITAL FERTILITY (I’g)
BY SOCIO-ECONOMIC CHARACTERISTICS 94
Table 3.16. TOTAL MARITAL FERTILITY (TMFR 15 +), TOTAL MARITAL FERTILITY AFTER AGE 30 AND AS PERCENTAGE OF TMFR
(15 +) AND AGE STANDARDIZED MARITAL FERTILITY (I’g)
BY SOCIO-ECONOMIC CHARACTERISTICS 95
Table 3.17. TOTAL MARITAL FERTILITY (TMFR 15 +), TOTAL MARITAL FERTILITY AFTER AGE 30 AND AS PERCENTAGE OF TMFR
(15 +) AND AGE STANDARDIZED MARITAL FERTILITY (I’g)
BY SOCIO-ECONOMIC CHARACTERISTICS 96
Table 3.18. TOTAL MARITAL FERTILITY (TMFR 15 +), TOTAL MARITAL FERTILITY AFTER AGE 30 AND AS PERCENTAGE OF TMFR
(15 +) AND AGE STANDARDIZED MARITAL FERTILITY (I’g)
BY SOCIO-ECONOMIC CHARACTERISTICS 97
Table 3.19. TOTAL MARITAL FERTILITY (TMFR 15 +), TOTAL MARITAL FERTILITY AFTER AGE 30 AND AS PERCENTAGE OF TMFR
(15 +) AND AGE STANDARDIZED MARITAL FERTILITY (I’g)
BY SOCIO-ECONOMIC CHARACTERISTICS 98
Table 4.1. CURRENT USERS OF TEMPORARY AND PERMANENT CONTRACEPTION PER 100 CURRENTLY MARRIED WOMEN AT DIFFERENT TIME POINTS BY NUMBER OF LIVING CHILDREN AND CULTURAL GROUP -
PROSPECTIVE DATA 130
Table 4.2. CURRENT USE OF CONTRACEPTION BY CONTRACEPTIVE METHODS
PROSPECTIVE DATA - 1971-72 131
Table.4.4. INDUCED ABORTIONS AS PERCENTAGE OF ALL PREGNANCIES
BY CULTURAL GROUP - PROSPECTIVE DATA 123 Table.4.5. MEAN AGE AT LAST BIRTH AND MEAN INTERVAL FROM LAST
LIVE BIRTH TO 1 JUNE 1971 FOR NON CONTRACEPTING WOMEN AND FOR ALL FERTILE WOMEN OF AGE 40-44 BY
CULTURAL GROUP 126
Table 4.6. PERCENTAGE PRACTISING FERTILITY REGULATION AMONG WOMEN WITH AT LEAST TWO LIVING CHILDREN BY SOCIO
ECONOMIC CHARACTERISTICS - 1971-72 132-133 Table 4.7. PERCENTAGE PRACTISING FERTILITY REGUALTION AMONG
WOMEN WITH AT LEAST TWO LIVING CHILDREN BY SOCIO
ECONOMIC CHARACTERISTICS - 1973-74 134-135 Table.5.1. MEAN AND MEDIAN AGE AT MARRIAGE BY AGE COHORTS
(EXCLUDING THOSE MARRYING ABOVE 24). 149
Table.5.2. MEAN AND MEDIAN AGE AT EFFECTIVE MARRIAGE BY
vii
Table.5.3. MEAN AGE AT EFFECTIVE MARRIAGE BY EDUCATION OF
WIFE, CULTURAL GROUP AND YEARS OF MARRIAGE. 151-152 Table.5.4. MEAN AGE AT EFFECTIVE MARRIAGE FOR THE MARRIAGE
THAT OCCURRED IN THE FIVE YEARS PRECEDING THE SURVEY
(1966-71) BY TYPE OF FAMILY AND TYPE OF HOUSE. 153 Table.5.5. RATE OF MARITAL DISRUPTIONS PER 100 PERSON-YEARS
OF MARRIAGE BY REASON FOR DISRUPTION AND CULTURAL
GROUP - PROSPECTIVE DATA 1971-73 154
Table.6.1. MEAN NUMBER OF CHILDREN EVER BORN BY AGE AND AGE AT
MARRIAGE.. 191
Table.6.2. MEAN NUMBER OF LIVING CHILDREN BY AGE AND AGE AT
MARRIAGE. 192
Table.6.3. CHILD SURVIVAL RATIOS BY AGE AND AGE AT MARRIAGE 193 Table.6.4. ZERO ORDER CORRELATION COEFFICIENTS AND REGRESSION
*
COEFFICIENTS FOR THE EFFECT OF WIFE’S AGE AT MARRIAGE ON THE NUMBER OF CHILDREN EVER BORN AND ON NUMBER OF
LIVING CHILDREN BY CULTURAL GROUP. 194
Table.6.5. ZERO ORDER CORRELATION COEFFICIENTS AND REGRESSION
COEFFICIENTS FOR THE EFFECT OF WIFE’S AGE AT MARRIAGE ON THE NUMBER OF CHILDREN EVER BORN AND ON LIVING
CHILDREN BY EDUCATION OF WIFE -- ALL CULTURES COMBINED. 195 Table.6.6. MEDIAN INTERVAL BETWEEN MARRIAGE AND FIRST LIVE BIRTH
BY AGE AT EFFECTIVE MARRIAGE AND CULTURE FOR WOMEN WHO
MARRIED IN THE FIVE YEARS PRECEDING SURVEY. 196 Table.6.7. MEDIAN INTERVAL BETWEEN MARRIAGE AND FIRST LIVE BIRTH
BY AGE AT EFFECTIVE MARRIAGE, CULTURE AND TYPE OF
FAMILY. 197
Table.6.8. MEDIAN INTERVAL BETWEEN MARRIAGE AND FIRST LIVE BIRTH BY EDUCATION OF WIFE AND AGE AT EFFECTIVE MARRIAGE
(EXCLUDING WOMEN OF JOINT FAMILIES IN VELLALAS AND
SCHEDULED CASTES). 198
Table.6.9. MEDIAN INTERVAL BETWEEN MARRIAGE AND FIRST LIVE BIRTH BY EDUCATION OF HUSBAND AND AGE AT EFFECTIVE MARRIAGE
(EXCLUDING WOMEN OF JOINT FAMILIES IN VELLALAS AND
SCHEDULED CASTES). 199
Table.6.10. MEDIAN INTERVAL BETWEEN MARRIAGE AND FIRST LIVE BIRTH BY TYPE OF HOUSE AND AGE AT EFFECTIVE MARRIAGE
(EXCLUDING WOMEN OF JOINT FAMILIES IN VELLALAS AND
SCHEDULED CASTES). 200
Table.6.11. AGE-SPECIFIC MARITAL FERTILITY RATES BY AGE AT
T a b l e . 6 . 1 2 . PERCENTAGE CURRENTLY CONTRACEPTING AMONG WOMEN WITH AT LEAST 3 LIVING CHILDREN BY CULTURAL GROUP AND BY AGE AT MARRIAGE.
T a b l e . 6 . 1 3 . MEAN NUMBER OF LIVING CHILDREN AMONG WOMEN CURRENTLY CONTRACEPTING BY CULTURE AND AGE AT MARRIAGE.
T a b l e . 6 . 1 4 . AGE AND MARITAL DURATION S P E C I F I C FE R T IL IT Y RATES BY AGE AT MARRIAGE; THREE CULTURAL GROUPS OTHER THAN MUSLIMS.
T a b l e . 7 . 1 . MEDIAN DURATION OF BREAST FEEDING BY AGE OF WOMAN AT CONCEPTION; PROSPECTIVE DATA.
T a b l e . 7 . 2 . MEDIAN DURATION OF BREAST FEEDING BY AGE AT CONCEPTION AND LITERACY STATUS OF WOMAN; PROSPECTIVE DATA.
T a b l e . 7 . 3 . MEDIAN DURATION OF BREAST FEEDING BY AGE OF WOMAN AT CONCEPTION AND TYPE OF HOUSE; PROSPECTIVE DATA.
T a b l e . 7 . 4 . MEDIAN DURATION OF BREAST FEEDING BY AGE OF WOMAN AND TYPE OF FAMILY; PROSPECTIVE DATA.
T a b l e . 7 . 5 . MEDIAN DURATION OF BREAST FEEDING BY AGE OF WOMAN AT CONCEPTION AND SEX OF CHILD; PROSPECTIVE DATA.
T a b l e . 7 . 5 ( a . ) MEDIAN DURATION OF BREAST FEEDING BY AGE AT CONCEPTION AND OCCUPATION OF WOMAN; PROSPECTIVE DATA
T a b l e . 7 . 6 . MEDIAN DURATION OF PPA BY AGE OF WOMAN AT CONCEPTION; PROSPECTIVE DATA*.
T a b l e . 7 . 7 . MEDIAN DURATION OF PPA BY TYPE OF PREGNANCY TERMINATION AND BREASTFEEDING; PROSPECTIVE DATA.
T a b l e . 7 . 8 . MEDIAN DURATION OF LACTATIONAL AMENORRHOEA BY
VARIOUS MATERNAL CHARACTERISTICS; PROSPECTIVE DATA.
T a b l e . 7 . 9 . MEDIAN DURATION OF BREAST FEEDING BY TYPE OF HOUSE, BY WORK STATUS OF WOMAN, BY TYPE OF FAMILY AND BY SEX OF CHILD; PROSPECTIVE DATA; ALL CULTURAL GROUPS
COMBINED.
T a b l e . 7 . 1 0 . MEDIAN LENGTH OF POSTPARTUM AMENORRHOEA BY VARIOUS MATERNAL CHARACTERISTICS; PROSPECTIVE DATA; ALL CULTURAL GROUPS COMBINED.
T a b l e . 7 . 1 1 . MEDIAN DURATION OF BREAST FEEDING BY LITERACY STATUS OF WOMAN AND COUPLE; PROSPECTIVE DATA; ALL CULTURAL GROUPS COMBINED.
T a b l e . 7 . 1 2 . MEDIAN DURATION OF BREAST FEEDING BY AGE AND LITERACY STATUS OF WOMAN; PROSPECTIVE DATA; ALL CULTURAL GROUPS COMBINED.
T a b l e . 7 . 1 3 . MEDIAN DURATION OF BREAST FEEDING BY TYPE OF HOUSE, LITERACY STATUS AND AGE OF WOMAN; PROSPECTIVE DATA; ALL CULTURAL GROUPS COMBINED; CHILD MORTALITY ABSENT
202
2 0 3
2 0 4
2 4 4
2 4 5
2 4 6
2 4 7
2 4 8
2 4 9
2 5 0
2 5 1
2 5 2
2 5 3
2 5 4 - 2 5 5
2 5 6
2 5 7
2 5 8
I X
T a b l e . 7 . 1 4 .
T a b l e . 7 . 1 5 .
T a b l e . 7 . 1 6 .
T a b l e . 7. 17 .
T a b l e . 8. 1.
T a b l e . 8. 2.
T a b l e . 8. 3.
T a b l e . 8. 4.
T a b l e . 8. 5.
MEDIAN DURATION OF BREAST FEEDING BY TYPE OF FAMILY, LITERACY STATUS AND AGE OF WOMAN; PROSPECTIVE DATA; ALL CULTURAL GROUPS COMBINED; CHILD MORTALITY ABSENT.
MEDIAN DURATION OF BREAST FEEDING BY SEX OF CHILD, LITERACY STATUS AND AGE OF WOMAN; PROSPECTIVE DATA; ALL CULTURAL GROUPS COMBINED; CHILD MORTALITY ABSENT.
MEDIAN LENGTH OF LACTATIONAL AMENORRHOEA AND BREAST FEEDING BY AGE AND OCCUPATION OF WOMAN; PROSPECTIVE DATA; ALL CULTURAL GROUPS COMBINED.
MEDIAN LENGTH OF LACTATIONAL AMENORRHOEA BY AGE AND OCCUPATION OF WOMAN AND THE LENGTH OF BREAST FEEDING; PROSPECTIVE DATA; ALL CULTURAL GROUPS COMBINED.
PRO B A B IL IT IE S OF REMAINING NON PREGNANT DURING
MENSTRUATING INTERVALS BY AGE OF WOMAN AND EXTENT OF BREASTFEEDING BEYOND RESUMPTION OF MENSTRUATION- CONTRACEPTORS EXCLUDED - PROSPECTIVE DATA
ALL CULTURAL GROUPS COMBINED
P R O B A B IL IT IE S OF REMAINING NON PREGNANT DURING MENSTRUATING INTERVALS BY AGE OF WOMEN, LENGTH OF LACTATIONAL AMENORRHOEA AND EXTENT OF
BREASTFEEDING BEYOND RESUMPTION OF MENSTRUATION CONTRACEPTORS EXCLUDED - PROSPECTIVE DATA
ALL CULTURAL GROUPS COMBINED
P R O B A B IL IT IE S OF REMAINING NON PREGNANT SINCE TERMINATION OF PREGNANCY BY AGE OF WOMAN AND SURVIVAL STATUS OF INDEX CHILD - CONTRACEPTORS EXCLUDED - PROSPECTIVE DATA
ALL CULTURAL GROUPS COMBINED
P R O B A B IL IT IE S OF REMAINING NON PREGNANT DURING
MENSTRUATING INTERVALS BY AGE OF WOMAN AND SURVIVAL STATUS OF INDEX CHILD - CONTRACEPTORS EXCLUDED PROSPECTIVE DATA - ALL CULTURAL GROUPS COMBINED
P R O B A B IL IT IE S OF REMAINING NON PREGNANT DURING
MENSTRUATING INTERVALS BY AGE OF WOMAN AND SURVIVAL STATUS OF INDEX CHILD - BREASTFEEDING STOPPED BEFORE OR AT TIME OF RESUMPTION OF MENSTRUATION -
CONTRACEPTORS EXCLUDED - PROSPECTIVE DATA ALL CULTURAL GROUPS COMBINED
C H A P T E R 1
In trod u ction
1.1 T h e S e t t i n g : R e c e n t P o p u l a t i o n T r e n d s in I n d ia
The title of a monogra ph by Pravin and Leela Visaria, 'India's Population: Second
and Growi ng' seems almost an a dequat e s u mm ar y of the population s ituation in India
Visaria and Visaria 81:. In population, India ranks second only to China, with a 1981
population of 684 millions. The annual growth rate was a bou t 2.2 per cent for the last
two decades 1961-81 Gov e rn me nt of India 72. Gove rn me nt of India 81 . Compared to
many other developing countries the growth rate of India may not be the highest, but the
growt h implications of this rate operating on 684 millions, with a sizable pr oportion in
young ages, can hardly escape att enti on. India's growth rate itself has been increasing.
Because of the high de ath rate the rate of growuh before 1921 was lower t han one per cent
and s ometimes even negative Davis 51 j. For the decade 1921-31 the annual rate was
slightly more t han one per cent and this gradually increased to a bout tw’O per cent during
1951-61 to reach 2.23 per cent for 1971-81 Go ve rnme nt of India 72. Go v e rn me nt of India
81 .Most of this increase is due to the decline in mort ali ty. The death r ate declined from
well over 40 during the early p art of this century to a bout 13 in 1979 Premi 821, while
the birth rat e declined at a much slower pace t han the death rate. The effects of the
cont in ua ti on of this imbalance on a population which even currently has a large
proportion wi thout access to certain basic needs, do not need elaboration. It is not
implied t h a t population growth is the sole culprit in leading to this situation. However it
is not hard to see t h a t continuing growth of this sort will nullify the effects of
developmental efforts.
T he decline in de ath rates slowed in the seventies. Initial declines were mainly due
1
and pr obably due to better di stribution of food grains especially during acute shortages in
certain areas. But future declines may depend on the i mprovement of general living
conditions requiring enormous i nvest ment s on public health measures such as water
supply and basic health care Visaria and Visaria 81 . In fact the question whether the
impressive declines in mort ali ty mean an appreciable i mprovement in the health s ta tu s of
the popul at ion is a difficult one to answer and the answer may well border on the
negative.
Infant mo rt ali ty levels, which are sensitive indicators of public health conditions, do
not seem to have declined as much as general mortality rates. The rate in 1978 wras 125
per 1000 live births, with rural areas having a rate of 136 compared to 70 for urban
G o v e r n m e n t of India 80]. Th e rate was a round 180 in the decade 1941-51 Agarw'ala
77 . implying a decline of a bo u t 30 percent to 1978. For the same period the crude death
r ate declined from a round 27-31 Agarwala 77 to about 14 in 1978 Premi 82 , a decline
of a b o u t 50 per cent.(See Ruzicka 84 )
This relative constancy in infant mort ali ty levels and the decline in general
mort al it y levels with no other s ubs tant ial i mprovement or even some worsening of the
general conditions of life of the ordinary man (Cassen 1978:20) are not unique to India. It
h appened in 19th century Europe, but there are differences. Cassen notes t h a t in the
developing countries
. .death rates have gone down much faster t h an in Europe but with a more m ar ke d divorce of mo rt ali ty decline from the other conditions of life of ordinary people. Ni neteenth century Europe needed both material progress and the appli cat ion of new knowledge which was simultaneously being acquired. In developing countries the knowledge began to be applied while material conditions were often still at the level of mediaeval Europe. Indeed it is a rguabl e t h a t in some countries and India is probably one of them, the economic effects of population pressure have been disguised by the decline in mortality b r ou gh t a bout largely by public health measures (Cassen 1978:20-21).
So f urt her decline in mo rt ali ty may be harder to achieve as it would need very
f u n d am e nt a l and capital intensive efforts. It should also be pointed out t h a t further
decline in mort ali ty may have progressively less effect on population growth for the
following reason: as life expectancy increases, there will be a shift towards older age
enabling middle-aged or old people to live a little longer t han by saving infants. In other
words.
When life expectancy is low and a large proportion of those who die are young, an increase in the life span generally means t h a t a large proportion of those saved are young. Because their child bearing years lie ahead, the effect on population growt h is great. By the time higher levels of life expectancy are reached not many young people are dying. If life expectancy is to be increased further, it will be increased by extending the lives of older people, who are not likely to have children Gwa tki n and Brandel 82 .
This is not exactly the current situation in India as a considerable proportion of
children do still die. But mortality decline is now becoming increasingly less significant in
population grow'th. Also migration plays almost no role in India's population growth. So
in the coming years wh a t is going to happen to fertility is going to be the prime
d e t e r m i n a n t of population growth. Lower fertility, in addition to having a direct effect
on population growth, ' contributes to the upward shift in the average age of death. If
fewer infants are born, fewer die, and so a greater proportion of deaths are those of older
people' Gwa tki n and Brandel 82'. This will further help to dampe n the effect of decline in
m or ta li ty on population growth.
1 . 1 . 1 F e r t i l i t y
Ther e seems to be a consensus t h a t fertility has declined, but the extent of such
decline is very speculative. Registration of births and deaths, though required bv law for
over a hundred years, is s ubstantially incomplete, sometimes esti mat ed to be less t han 50
per cent Agarwal a 77!. Fr om 1963-64, a Sample Registration System has been in
operat ion. This slowly evolved to cover the whole country with a sample population of
a bout six million, t hough initially it covered only the rural areas. This is an active
registration system where two sets of essentially independent d a t a on vital events are
collected and compar ed to arrive at the actual number of events. There is a lack of hard
d a t a on the reliability of SRS estimates. However some localized studies suggest under
es ti ma ti on of a bo u t 4 to 13 per cent [Agarwal 79. Lingner and Wells 73!. There are
speculations t h a t the r ate of under-estimation may be more in recent years t h an before,
because of certain changes in the a dmi nis trat ion of SRS Visaria and Visaria 81 .
3
maj or source of demographic estimates until the late sixties. But uncertainties concerning
the quality of census d a t a leading to a variety of assumptions and correction procedures,
in addition to the use of a variety of techniques of estimation with their inbuilt
a ssumpt ions , result in considerably varying estimates for the same periods Cassen
78, Premi 82, M ut hi a h and Jones 83:.
Finally there were national surveys in 1972 and 1979. covering 25 per cent of SRS
s ampl e households. Th e 1972 survey results are possibly under-estimates as they are
available from advance t ab u la ti on s which have not been adjusted to include births
recorded by resident e n u me r at o rs but missed by supervisors in follow-up retrospective
s u r v e y s . 1 An exercise, basically mechanical in nature, using different sets of estimates of
fertility for two points in time, resulted in a considerably different extent of decline, for
various stat es of India, sometimes even changing from decline to increase Mu t hi ah and
Jones 83 . However the following is an a t t e m p t to arrive at a rough esti mat e of the
extent of decline.
For the period 1951-61, the Registrar General' s es timate using indirect techniques
applied to census d a t a produced a crude birth r at e (C BR ) of 41.7. Most other
independent es timates indicated a higher rate, namely, around 43-45 Saxena 65, United
Nations 67. Visaria 69, Rele and Sinha 70. Sr ikant an and Ra ychaudhuri 73 .“ For the
decade 1961-71, the e st ima t e provided by the Registrar General is 41.2 Srinivasan 81 ,
which compares well wi th i ndependent es timates by Adl akha and Kirk (1974) and Rele
and Sinha (1973) of 40- 41 Ad l ak h a and Kirk 74, Rele and Sinha 731. However there are
reasons to suspect t h a t this is a slight u nde re st imat e Cassen 78 .
For the year 1978. Sample Registration System (SRS) e sti mat e of C B R is 33.3 (and
33 for 1979) Premi 82!. Assuming an und ere st imat e of 5-10 per cent Visaria and Visaria
8 1 , the CBR varies between 35 and 37. So the C B R seems to have declined from about
44 in 1956 to a bou t 36 in 1978, a decline of a bout 8 points over a period of a bout 22
^This may not be as damaging as it sounds for the independence between enumerators and supervisors was not above suspicion.
1
years. However V i s a r i a and Visaria( 1981), after an e xa mi nat ion of various estimates
available, conclude t h a t the C B R might have declined by a b o u t two or t hree points in a
decade, during the period 1956-76. or slightly less t han the 8 points suggested earlier. So a
decline of a bo u t 6-8 points over a period of two decades - a decline of 15-18 per cent -
seems to be well within reason. Jain and Adlakha using the Bonga ar ts model for
pr oximate d et er mi na nt s of fertility, es ti mat e the trend in fertility from trends in
pr oximate d e te r mi n an ts Jain and Adl akh a 82'. They conclude t h a t the C B R has declined
by a bout 8-14 per cent during 1972-78. Their estimate of C B R in 1972 is 40.6 and in 1978
is 35-37. SRS provides C B R es timates for the years 1970 and 78, of 36.8 and 33.2
respectively, which suggest a decline of 10 per cent or an average annual decline of about
1.5 percent, based on the as sumpt ion of unchanging coverage at these two points. These
recent figures, in spite of their limitations, give rise to speculations t h a t the declines
9
might be slightly accelerating in the recent period.u
How much of this decline can be accounted for by changes in the composition of the
population and how much by changes in marital fertility? In view of the speculative
na tu re of the extent of decline, the answer to this is necessarily speculative. The major systemat ic work on the subject is by Adl ak ha and Kirk (1974), who e sti ma te a CBR
decline of about 3-4 points between the decades 1951-61 and 1961-71 and a t t r i b u t e one
third of this decline to changes in age and mari tal st at us , leaving about two thirds (2-3
C B R points) to declines in mar ital fertility. If these are reasonable and applicable to the
period 1951-61 to 1978, t hen a 4-6 C B R point decline may be a t t r i bu t ed to the decline in
marital fertility.
A decline in a comparatively more sensitive and robust indicator of fertility like
total fertility rate ( T F R ) will certainly be more reassuring as indication of decline in
mari tal fertility. The d a t a on T F R are available from two special surveys done on 25 per
9
5
cent of SRS sample households, one done in 1972 and an o ther in 1979. These d a ta
suggest t h a t the T F R has come down from 5.5 in 1972 to 4.3 in 1978 Visaria and Visaria
81 , a decline of 21.8 per cent or an average annual decline of 3.4 per cent..4 However
these Figures may exaggerate the decline considerably for various reasons. As noted
earlier the 1978 rates did not include the events t h a t the supervisors m ight have missed
but th e en um e rato rs might have picked up. However this may not result in big
differences as the possibility of collusion betw een these sources is probably considerable.
Both the 1972 and 1979 rates are suspected to be underestim ates, and Visaria and Visaria
(1981) suspect t h a t the 1978 rate is more soT
The decline in fertility seems to be m arginal. It is probably more a precursor of
w h at is hoped should follow. However this picture of fertility decline may not tell the
whole story, as Nag (1980,1982,1983) has reminded us in his d o c u m e n tatio n of the
fertility- enhancing effect of ’modernization". In wrhat-ever way m odernization is defined,
the point is th at at the initial stages of such a process, certain trad ition al practices th a t
would have had fertility-inhibiting effects might decline and. if there were no
co m pensation by increased fertility regulation, this would result in increased fertility. Also it is suggested t h a t certain aspects of developm ent such as improved n u tritio n and
control of diseases may increase fecundity Nag 80. Nag 82, Nag 83 .
Leaving alone certain controversial aspects of this process, like the nutrition-
fecundity relation, there are probably changes in other aspects of Indian society t h a t may
enhance fertility: decline in breast-feeding, abstinence and widowhood as a result of
im pro ve m e nts in education and health service systems in addition to others Nag 8 2 !. It
is not unlikely, then, t h a t the fertility decline noted above is u n d e rsta te d as some of the
decline m ight have been com pensated by increase in fertility.
4The 1978 survey covered a period of one year up to July 1972 while the 1979 survey covered the 1978 calendar year, about 6.5 years between surveys.
6
I . 1.2 R e g i o n a l D i f f e r e n t i a ls
India is a diverse country. There are considerable regional variations in
demographic behaviour. For example Kerala S ta te had a birth rate based on SRS of 25.2
in 1978 com pared to 33.2 for the whole country and a range of 26.9 to 40.4 for the states
oth er th an Kerala. Though most s ta te s have registered some declines in the recent years
in birth rates, they greatly vary across states. Kerala has the lowest d eath rate of around
7 per 1000 (also based on SRS d a ta ) , which is slightly less th an half of the national rate
and ju st over one third of U t t a r P ra d esh 's rate of 20.2. Kerala also had an infant
m o rtality rate of 55 per 1000 live births in 1978, a bout 30 points below the nearest state
K a rn a ta k a , while 11 out of 15 s ta te s reported had rates of more th an 100, ranging from
101 to 182.
There were also considerable v ariations in other social characteristics, such as
literacy in general and female literacy in particular. In 1981 female literacy ranged from
I I . 4 per cent in R a ja sth a n to 64.5 in Kerala. Only about 30-35 per cent of the women of
the three s ta te s th at are close to Kerala, namely G u ja ra t, M a h a r a s h tr a and Tam il Nadu,
are literate. Even though the female literacy rate appears to be low, it is a considerable im provem ent from 1951, when the general literacy rate w'as only 17 per cent of the total
population and the female literacy rate was 8 percent.
The s ta te s also vary in the extent of urbanization and in many o th er aspects.
However there are some similarities. In all sta te s other th an Kerala female m o rtality is
higher than that of males and the female literacy rate is far below t h a t of males. There
does not a pp ear to be much room for contesting the view t h a t there is ‘discrim ination
against women and a tra d itio n of self-effacement t h a t is inculcated in women from their
early childhood' Visaria and Visaria 81!.
The diversities in dem ographic phenom ena are not confined to States as a unit.
Urban com m unities seem to differ from rural communities; religious and caste groups
differ among themselves; ed ucational differentials begin to ap pear and so on. In the initial
stages of dem ographic tra n sitio n , evolution of definite differentials by socio-economic
variables is probably a good index of changes in demographic p aram eters t h a t are to
fertility of urbanites is a recent phenomenon. Crude birth rates were always lower than
in rural areas but most of t he difference until recently was due to mechanical reasons such
as t he differences in sex di stribution. Even in the early sixties the mar ital fertility of
u r ban areas in most stat es was comparabl e to t h at of their surrounding rural areas
Cassen 78:Cass68, United Nations 61. Rele 74 . However, recent urban fertility is
definitely lower t han rural. The T F R in 1978 was 4.6 for rural and 3.1 for urban areas,
and the decline in T F R over the period of 6 years from 1972 was 21 per cent in rural areas
c ompar ed to 28 in ur ban areas Visaria and Visaria 81 .
Wit h this brief i ntroduction to the demographic profile of India, wre proceed to
discuss the following m a t t e r s t h a t lay the foundation for developing the t heme for this
thesis, namely fertility in a rural area of South India. More specifically the interest is in
the prox ima te de te r mi na nt s of fertility and the variation in such d e te r mi n an ts across
caste and religious groups t h a t live in the same area. The following two sections present
discussions on the proximate d e t e r mi n an ts framework as a tool in fertility analysis and
the suitability of caste religion as a study unit for the analysis of fertility and proximate
de te r mi na nt s.
1.2 I n t e r m e d i a t e F e r t i l i t y V a r i a b l e s F r a m e W o r k
The inter mediat e variables framework t h a t was initially proposed by Davis and
Blake (1956) and later elabor at ed by Tien (1968) and Yaukey (1969) came into much use
when it was given a q ua n ti t a t i ve reformulation by Bongaarts(1978,1980). This section
review's and elaborates on certain dimensions of this framework, thus indicating in broad
t er ms the na tur e of inquiry t h a t will be undert aken Davis and Blake 56. Tien 68. Yaukey
69. Bo ng aa rt s 73, Bongaar ts 80 .
1 .2 .1 D a v i s a n d B l a k e F r a m e w o r k
The analytic framework for the analysis of fertility proposed by Davis and Blake
more t h an a quart er of a century ago listed 11 intermediat e variables t hrough which any
social factors influencing the level of fertility must operate. They asserted t h a t ’it is clear
t h a t any cultural factor t h a t affects fertility must do so in some way classifiable under
one or a not he r of our eleven i nte rme dia te variables' Fertility, in fact, is a final outcome of
8
These i nter mediat e variables are grouped into three categories namely intercourse
variables, conception variables and gestation variables. The intercourse variables are
further divided into two groups: variables governing the formation and dissolution of
unions.namely age of entry, perma nent celibacy and a mo u n t of reproductive period spent
after or between unions: and variables governing the exposure to intercourse namely
vol untary abstinence, involuntary abstinence and coital frequency. The conception
variables which concern the sexual unions leading to conception, include fecundity as
affected by vol untar y and i nvoluntary causes and contraception. Finally the gestation
variables include foetal mort ali ty from vol untar y and involuntary causes. In such a
classification the a u th or s indicate t h a t they were concerned only with ’socially recognised
and utilised' steps in reproduction.
There are various paths to a part icul ar level of fertility. Similar levels of fertility or
fertility change can be arrived at by quite different combinations of the intermediate
variables, and conversely two societies t h a t have different levels of fertility might have
surprisingly similar values on many i nter mediat e variables. The n it follows t h a t if the
interest is in s tudyi ng the socio-cultural factors leading to a level of fertility, the
reproductive process itself needs to be broken down into its components, since the set of
inter mediat e variables through which the socio-cultural factors operate to regulate
fertility may vary across as well as wdthin societies. This basically clarifies the sequence
of relationships in addition to facilitating the focus on relatively more relevant
component s of the r eproductive process.
Davis and Blake also discuss the rationality of fertility decisions as follows:
It should, of course, be mentioned t h a t cultural influences affecting our eleven variables do not necessarily represent r ational a t t e m p t s to govern fertility. Many fertility consequences stemmi ng from socio- cultural conditions (especially in under developed regions) are by-products, being unanti cipat ed and unrealised by members of the society. Surely by now social scientists know t h at they cannot confine their a tt e nt io n only to r ational actions or t re a t non-rational actions as somehow' defying s ystematic analysis.
It is to be noted t h a t the rationality as discussed above is in specific reference to
fertility consequences. The rationality, while realized in one sphere of behaviour, may be
9
such a consequence is in contradiction with the fertility values, there are other
i nt er me di at e variables t h a t may be regulated to counteract some of these unintended by
product s. We shall ret urn to this point later. A fertility analyst cannot restrict
himself herself to only those i ntermediate variables t h a t are governed by socio- cultural
factors with the explicit function of regulating fertility, unless t h a t is his specific purpose.
The i nter mediat e variables may be regulated for non-fertility related purposes but such a
regulation may result in considerably influencing fertility.
Finally. Davis and Blake clearly recognize t h a t i ntermediate variables ’offer a means
of a p pr oa c h' to the analysis of fertility. Caldwell (1981) emphasizes this point a bout the
analysis of i ntermediate variables being not an end in itself in slightly stronger terms:
They must also app ro a ch causation with a more sophisticated a p p a r a t u s than t he largely tautological one of ' i nter mediat e variables’, originally an intriguing concept and one which still serves gr ad ua t e s tudent s well as check-list, but one which also convinces many of the same s tudent s t h a t they have done all the explaining that needs to be done.
One may disagree, however, t hat intermediat e variables are just a check-list but
view t hem as a definite move towards a potentially powerful explanatory scheme
concerning fertility change or differentials. This is essentially because an analysis of the
c ompone nt s of fertility should yield better perspectives a bout fertility t han the analysis of
fertility itself as this is a net effect of the interplay of the intermediat e variables: even
more so because the existing levels of inter mediat e variables, in societies where fertility
regulation is not yet widespread, could be partly socially prescribed and i nvoluntary and
partly voluntary. The breakdown of fertility into its i mmediate de te r mi na nt s greatly aids
un de rs ta nd in g of this aspect.
1 . 2. 2 C r i t i q u e b y T i e n
In his critique of the inter mediat e variables framework, Tien (1968) makes some
i m p o r t a n t observations which clarify certain aspects of this framework as well as help to
operationalize certain dimensions.
Under the premises t h a t in societies levels of fertility are always above zero and the
10
is biologically rather t h a n culturally defined0. Tien proposes t hat
Cul tural factors affect fertility only negatively in concrete instances, bringing a b o u t levels of fertility always below the theoretical m a x i m u m (p.145).
This is in contrast to the Davis- Blake formulation of every variable being present
in every society, with even the absence of a specific practice being t reated as a form of
influence. Each i nter mediat e variable will have a negative (minus) or positive (plus)
effect on fertility. Defined this way, they suggest t h a t ’the position of any society, if
s ta t ed at all. must be s ta t ed on all eleven variables’.
Tien' s proposal leads to testable relational propositions about fertility and
i nt er me di at e variables. In addition there is an a d va nt ag e in this scheme namely
the relative position of a few or of many different societies with respect to any and all variables can be established wi thout complete knowledge a bout all societies.
In fact the later use of the phrase ‘fertility inhibiting effects’ of i ntermediate
variables as well as the basis for the formulation can be traced back to T i en ’s proposal.
Relational propositions connect intermediat e variables to fertility in relational
t erms. For example the lower the age of entry into sexual unions the higher the fertility. It is immediately a p pa r e n t that this proposition is conditional on other intermediate
variables remaining constant (although in reality this may not be true). It is easy to
visualize changes in, say. intercourse variables consequent to changes in age of entry into
sexual unions. Similarly, to use one of T i e n ’s examples, in societies where contraception
is nearly universal and greatly successful, it is difficult to determine wh at effect early
mar riage or the absence of 'late' marriage can have on fertility. These inter relations
between intermediat e variables bring up Tien's second observation:
...while the i nter mediat e variables are separately listed and dealt with in fertility studies it would be perilous to regard t hem as having no effect on each ot her in actuality.
^l.It must be noted that it is the maximum that is biologically defined. Observed natural fertility could be and is much lower than the biological maximum which is largely determined by social norms concerning factors affecting fertility with or without fertility intentions.
1 1
Taki ng the example of decline in age at marriage and the decline in fertility in USA.
Tien makes the third observation:
...conditions t h a t make for lower (or zero) fertility are not invariably the reverse of the conditions t h a t produce higher (or m axi mum) fertility.
In a way this reiterates the point t hat different societies may follow different paths
to a t t a i n a particular level of fertility. If the effect of one inter mediat e variable is
conducive to high (or low) fertility, it can be counteracted by regulating another
i nte rme dia te variable in the opposite direction. Such a regulation, if present in a
volitional sense, necessarily implies a desired level of ul ti mat e fertility.
Tien also raises the question a bout the possibility of unequal weights of the various
i nte rme dia te variables in the r eproductive affairs of a society. Using empirical data, he
contends t ha t a few relatively i m po r t a nt i ntermediate variables may be identified. This
mea ns t hat there may be a subset among the eleven variables listed which may capture
most of the changes in fertility. The interesting possibility implied and hinted at by Tien
was t h a t such a subset may be stable across cultures. This possibility was later examined
by Bongaar ts and found to be true. This will be detailed later.
Finally Tien draws a t t e nt i o n to the need to bring in non- i nstitutional factors in
any study of fertility det er mi na nt s. Though the institutional framework of Davis-Blake is
a useful tool for analysing fertility phenomena. Tien points out t h a t only some of the
explanator y variables are located within such a framework.
1 .2 .3 E l a b o r a t i o n s b y Y a u k e y
Yaukev (1969) argues t h a t fertility itself is not a social behaviour but only a
res ul ta nt of other social behaviours like marriage, intercourse, contraception, etc. which
are essentially covered in the list of intermediat e variables. He proposes t h a t the
'i nter mediat e variables' no longer be cast in the role of i nter mediat e variables, t h a t we differentiate two bodies of theory and research, one is to cast the former intermediat e variables in the role of independent variables, the other is to cast the former i nte rme dia te variables in the role of dependent variables.
He argues t h a t focusing on component s of fertility facilitates the explicit recognition
t h a t the different part s of the causal sequence may have different kinds of relations. Such
recognition in t ur n will facilitate application of different bodies of existing or potential
12
1 . 2 . 4 D i s c u s s i o n
Th e preceding review leads to the following which highlights the need for examining
i nt er me di at e variables in underst anding fertility behaviour.
Henry (1961) defined natur al fertility in populations wi thout deliberate control of
bi rt hs where control was considered as existing 'when the behaviour of the couple is
bound to the number of children already born and is modified when this n umber reaches
the m a x i mu m which the couple does not want to exceed'. Absence of any parity-
dep en den t practice to regulate fertility was considered a n a tur al fertility situation.
Defined this way. even though variations in na tur al fertility may be primarily determined
by biological processes, it may also be affected by socio-cultural factors Henry 61a,.
Nat ural fertility in fact is characterized more by typical age p a t t e r n s of fertility
within marriage t han by typical levels of fertility. For example Henry found a wide
vari ati on in levels of natural fertility across societies, ranging from a mean n umber of 6.2
children per completed family among Hindus in Bengal to 10.9 a mong Hutterites.
Ohadi ke (1979) similarly notes a range of 40 to 60 births per thou sa nd population in
’na tu ra l fertility’ populations Ohadike 79 . An analysis of reproductive histories of
couples in 14 Ge rma n villages married between 1750 and 1899 using Coale's index of
n at ur a l fertility M reveals t h a t though the conditions of ’n a tur al fertility', in terms of
pari ty -d ep en dent fertility regulation, remained more or less the same, the value of M
increased significantly between the end of the eighteenth century and the beginning of the
t w en ti e th Knodel and Wilson 81 j. It appears t h a t a reduction in the non-susceptible
period following birth might partly be responsible for this increase in n a tu r al fertility.
This observed range in natur al fertility levels cautions the i mmedi ate impulse to
explain any fertility differentials or fertility changes in terms of differentials changes in
fertility regulation. McNicoll (p. 4) succinctly notes as follows:
...the pure biology of the s ituation must be disposed of, to ensure t h a t one is not caught explaining in economical or social terms more t h an in fact remains to be explained in these terms - an e mb a rr as s me n t by no means unknown to analys ts in this area McNicoll 8 0 i.
It is not j ust the biology of the s ituation t h a t needs to be clarified but also the socio
13
t h a t decomposing fertility into its component s will greatly aid this disaggregation. It is
certainly not implied t h a t such a breakdown will automatically result in disaggregating
volitional from non- volitional efforts, but it is clearly a step t owards it.
Such a breakdown need not always result in smaller t han the observed extent of
fertility change or differential remaining to be explained in terms of ' regulation'. It may
sometimes be the other way. Nag (1980) discusses the fertility increasing effects of
'moder ni zat ion' (mostly in the initial phases of such modernization) through reduction of
l actational lengths, abstinence practices etc. If such a process is operative, any a t t e m p t
at regulation will not show in s u mm ar y indices of fertility until after the fertility
inhibiting effects of regulation exceeds the fertility increasing effects of these processes.
Lesthaeghe et al. (1981:20), while discussing child-spacing in Africa, c omme nt on this
aspect:
Opposite but mutually compensati ng changes in several i ntermediate fertility variables may occur simultaneously producing on balance wh at may seem to be a horizontal fertility trend...In reality lack of change or differentials in aggregate fertility could cover up very different fertility strategies among the various population segments and bring the casual observer to the conclusion t h at no behavioural changes are taking place Lesthaeghe et al. 81].
In an early article. Fr eedman (1967) elaborates the Davis-Blake framework by
introducing two variables: norms about family size and norms a bout intermediate
variables, through which socio-cultural and demographic factors would operate to
influence the inter mediat e variables which in t u r n would affect fertility Fr eedman 67:.
Yaukey' s (1969) c o mm en ts on this extended framework are interesting. He points out
t h a t the list of i nter mediat e variables immediately preceding fertility are very much
detailed while the nor ma ti ve and socio- economic variables are vague and t entative. This
he rightly a t t r i b u t e s to the fact t h a t Davis and Blake had a specific dependent variable,
fertility, while Fr eed ma n was trying to inventory the det er mi na nt s for not one but many
variables, namely all of the Davis-Blake i nter mediat e variables. Th u s the decomposing of
fertility into its c ompone nt s will lead to complete and clearer specification of the
i ndependent variables involved. This will lead to the framework being able to
a c co mmo da te different kinds of relations between variables, depending on which
i ndependent and which d e pe ndent variables are being investigated. However, as Y aukey
14
If the ul ti ma te goal is to explain fertility, and to predict it. t h a t goal is not given up by subdividing the parts of the sequence for study.
Goldberg (1975) discusses the fertility differentials using socio- cultural variables
such as education. Even while there are significant differentials by education ’There is
too much undefined space between i ndependent and dependent variables’. It is a pp a re n t
t h a t t he use of intermediat e variables helps fill this undefined space Goldberg 75!.
Fr om the foregoing sections it follows t h a t the use of the intermediate variables
would aid any a t t e m p t at explaining fertility changes or differentials. Clearly however,
all i nter mediat e variables may not be of equal i mportance in this context. Tien (1969)
speculates t hat contraception, abortion, late marriage and non- marriage may be all the
key variables t hat ‘m a t t e r separately, collectively or in succession' in any study of
fertility. He adds t hat this question needs an empirical answer. Later Bongaarts in a
series of papers had a t t e m p t e d to empirically address this question. As a first step, he
collapsed the 11 inter mediat e variables of Davis-Blake into seven. He then ranked the
seven intermediat e variables (hereafter called proximate d et er mi na nt s following
Bongaar ts ) on two criteria: (i) the sensitivity of fertility to variations in the proximate
d e t e r m i n a n t s and (ii) the e xtent of variability of proximate d e t e r mi n an ts over time or
a mo n g populations. Based mostly on results of studies involving fertility models the
following conclusions were arrived at:
1. Fertility seems to be least sensitive to variations in spontaneous intrauterine mort ali ty and sterility and the former seems also to have the least variability.
2. Th e most i m p o r t a n t p r oxima te d et er mi na nt s, based both on sensitivity and variability, are proportion married, p o s t p a r t u m infecundabilitv. contraception and induced abortion.
It is to be noted t h a t p os t p a r t u m infecundabilitv has higher rating, in both the criteria
used, t h an sterility and s pontaneous i ntr auteri ne mortality. This conclusion a bout the
i mp or ta nc e of these four pr oximate d e te r mi n an ts was further validated, using the simple
model he proposed earlier Bongaar ts 78, Bonga ar ts 80, Bongaarts 82!.
As Bongaar ts points out, there may be situations in which other proximate
d e t e r m i n a n t s are i m po r ta n t , as in the case wrhere widespread venereal disease causes high
15
reduce fecundability. Fecundability here refers to variations in frequency of intercourse
including those due to t emp or ar y separation or illness. The effect of voluntary abstinence
- total or periodic - to avoid pregnancy is excluded. This definition of fecundability poses
some problems in the case of terminal abstinence. It has been argued t ha t such terminal
abstinence may not depend on parity but may depend on factors such as age of woman or
g r a n d m o t h e r st at us or even the presence of a daughter-in-law in the house. So here is a
practice t h at is not pari ty-dependent but t h a t is used to avoid pregnancy. This practice,
t hen, cannot be included in contraception for the former reason and cannot be included in
fecundability for the l at te r reason. Also in Bongaar t' s rating, fecundability has an
i nt er me di at e position, in t er ms of both sensitivity and variability, which means t h a t in
some popul at ions it may easily turn out to be an i mp o r ta n t de ter mi nant.
1.3 C a s t e a n d R e l ig i o n as A c t i v e S o c ia l F o r c e s
Cast e among Hindus is an ancient t radi ti on in India and probably a unique
p henomenon in terms of its form and content. The word ’caste' derives from the
Po rtugue se word c a s ta, meaning breed or race (Hut ton. 1961, 47) and the Tamil
equivalent of this word is Jaati. Beteille (1965, p. 46) defines caste as:'
a small and named group of persons characterised by endogamy, hereditary membershi p, and a specific style of life which sometimes includes by tradi ti on of a p art icul ar occupation and is usually associated with more or less distinct ritual s t a t u s in a hierarchical system Beteille 65 .
Of the various aspects indicated above, caste membership being an ascription by
Q
birth and caste endogamy^ are the least debatable. However, even within a caste, there
can be sub-units or sub-castes which do not i nter marr y. Djurfeldt and Lindberg (1975),
in fact, define caste as 'an e ndogamous unit with exogamous sub un i ts ’.
As noted earlier, caste prescriptions cover a large area of life style aspects. Within
t he limit ati on of variability a mong castes in the extent of adherence to such prescriptions,
it is likely t h a t members of a caste pursue a more or less common style of life. Hutton
(1961) notes:
‘For other definitions of caste, see Hutton, pp. 47-50 and Srinivas, p. 3 Hutton 61, Srinivas 62
O