■ ■
■ JROPAEISKl MUNITIES STATISTISCHES OF THE EUROPEAN t I E F A E L L E S H - ABI ■
EK DF" :
m
lUE DES COMMU Ieurostat
AEL.LESSKABER - Oi ■ STATISTISCHES AMI ■' ■
ATISTIEK DER EUHOP< ■ ■ ■
■HAPPEN - DET STATISTISKE DEPARTEMENT FOR DE I ■ STICAL OFFICE OF THE EUROPEAN C O M | ■ ' Ft EUROPÄISCHEN GEMEINSCHAFTE\ j K DER EUROPESE GEMEENS!
'OJE DES C '
Γ STATISTISKE DEPARTE« I Í T I C A L OFFICE O F - Γ Η Ε Ι 'ÈLLE COMUNITÀ EUROFI E E U R O P A ^ - I OMMUNITIES - STATISTI (QUE DES COMMUNAUTES EUROPEENNES - STATISTICAL OFFICE OF THE EUROPE
CHEN GEMEINSCHAFTEN - ISTITUTO STATISTICO DELLE COMUNITÀ EUROPEE - BUREAU VOOR DE STATISTIEK HAPPEN - DET STATISTISKE DEPARTEMENT FOR DE !UROt'AF.i:¿Kt F A E L L E S S K A H E ^ ■ ::> ■
STATISTISK TELEGRAM
STATISTISCHES TELEGRAMM
STATISTICAL TELEGRAM
TELEGRAMME STATISTIQUE
TELEGRAMMA STATISTICO
STATISTISCH TELEGRAM
LABOUR COSTS IN INDUSTRY
I972 1975
Surveys on labour costs in industry have been carried out at three yearly intervals in the member states of the European Community (1966,
1969, 1972, 1975). The 1972 survey was confined to the six original member countries; however, in the United Kingdom and Denmark a similar survey was carried out after their accession to the Communities, in respect of the year 1973.
Pending the appearance of the results of the 1975 survey, which are at present being processed, the Statistical Office of the European Commu nities has, with the collaboration of the national statistics services, calculated updated results for the years 19731975 from the returns of the 1972 survey (1).
Table 1 shows, in the different countries, the trend of hourly costs for the total of persons employed in industry. In order to compare the level of costs between countries, the data have been converted into com mon accounting units, viz. Eur (2).
Prom table 1 it can be seen that during the three years in question the comparative position of P.R. Germany improved in relation to the other five original Community member states, except for Italy, where the lowering of the exchange rate of the lira resulted in an appreciable diminution of relative export prices. In fact, the hourly cost in
(1) The detailed results of this survey are published in Eurostat, Social Statistics, no. 6/1975 "Labour costs in industry 19721975"
(2) The rates of exchange, national currencies into Eur, are published in Eurostat, General Statistics, table 853·
LUXEMBOURG TEL. 47941
BEFOLKNINGSSTATISTIK OG SOCIOLOGISK STATISTIK BEVÖLKERUNGS- UND SOZIALSTATISTIK DEMOGRAPHIC AND SOCIAL STATISTICS STATISTIQUES DEMOGRAPHIQUES ET SOCIALES STATISTICHE DEMOGRAFICHE E SOCIALI SOCIALE EN BEVOLKINGSSTATISTIEK
- 2
P.R. Germany, which remained the highest up to 1972 and 1973, was over-taken in April 1974 by the cost in the Netherlands, and in April 1975 by that in Belgium, Luxembourg and Denmark. The position of Prance also improved relative to several countries, notably the Benelux states.
In 1972, labour costs in the four of the six countries with the highest costs viere close to each other (the greatest difference being 10 %) ; these differed, considerably from Prance and Italy, where the costs were about 3/4 of those in P.R. Germany ond the Netherlands. This situation was little changed in 1975: a fifth country (Denmark) joined those with "high" costs, and the greatest difference between them was still about
10 )o. Prance and Italy still had costs appreciably lower, and in the United Kingdom the costs amounted to only 50 %» or even less, of those in P.R. Germany, the Netherlands and Belgium.
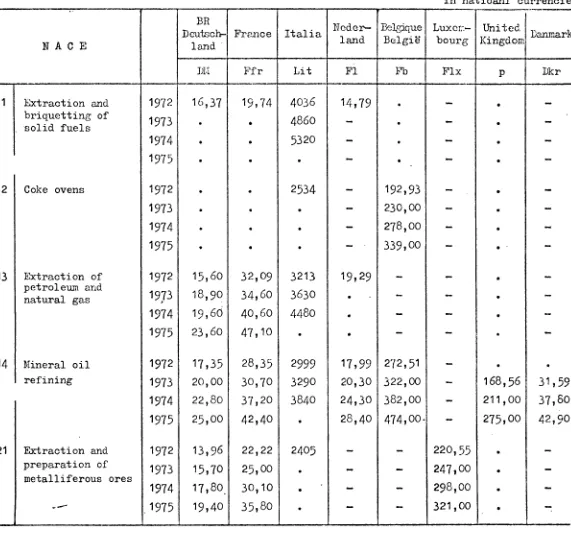
Table 2 shows the trend of costs in different industries for each
country separately fron; 1972 (1973 for the United Kingdom and Denmark). Looking at the situation of the six original member countries between
1972 and 1975» it vías in Belgium that the costs, in general, increased the irost (75 /u for all industries together) - i.e. an annual rate of increase of 21 f. compared with I7 jo in Prance and Luxembourg, 16 Ja in the Netherlands and 11 cf, in F.R. Germany. In 1974 the rate of increase in all the countries was comparatively greater except in P.R. Germany, where it was slightly leas: in 1975 the rate of increase tended to slow down or to become stabilised except in the United Kingdom, where it continued to increase.
Table 3 comoares the level of labour costs between countries, for dif-ferent industries. Precuently this shows, for various industrial acti-vities, the same relation as has been seen for all industries together
(table 1).
Arranging countries in decending order of labour costs, in 1975 Belgium and the Netherlands took the highest place for about 2/3 of the
industrial sectors, whereas in 1972 and 1973 this position was most frequently taken by P.R. Germany. Moreover, in every industrial sector the relative position of P.R. Germany underwent a net improvement; in
1975» German labour costs were the highest in only two industrial sec-tors (mechanical engineering and motor vehicle manufacture), while in many important sectors (notably chemicals, manufacture of metal articles, other transport material manufacture, processing of rubber and plastics, and building) P.R. Germany was in third or fourth place, below Belgium, the Netherlands and Denmark; for all industries together the German costs fell to fifth place within the Community.
In 1974 the position of Prance in relation to all its Community part-ners improved for each industrial sector, although its position in 1975 worsened comparatively, especially in relation with P.R. Germany.
Taking the position of Prance sector by sector, the level of costs was generally in 5th or 6th place, coming after those of the Benelux
3
-In the case of Italy, for which the up-dated results for 1975 as well as in a certain number of industries for 1973 and 1974 are not avail-able, it is not possible to establish the country's position exactly. However, it can be seen that since 1972, resulting from the fall in the exchange rate of the lira, the labour costs for Italy rose appre-ciably less, relatively, than those in the other countries.
Denmark is a country where the labour costs were classed as "high"; in four industrial sectors they were in fact the highest of the whole Community (food, shoes and clothing, paper and printing, miscellaneous).
_ 4
-Table 1
LABOUR COSTS IN INDUSTRY 1966 - 1975 (ï)
1966
1969
1972
i v . 1 9 7 3 X.1973 1973
i v . 1 9 7 4 X.1974 1974
i v . 1 9 7 5
X.1975 1975
BR
Deutsch-1 and
1,76
2,26
3,51
4 , 0 0
4 , 4 0 4,10
4 , 7 0 4 , 8 0 4 , 8 0
5,10 5,20 5,20
Prance
1,68
2 , 1 0
2 , 6 5
3,00 3 , 1 0 3 , 1 0
3 , 2 0
3 , 5 0 3 , 3 0
4 , 0 0 4 , 4 0 4 , 1 0
I t a l i a
1,46
1,84
2,66
2,70 2,70 2,70
2,90 3,00 3,00
• » •
l i e d e r -land
1,70
2,30
3,47
3,90 4 , 3 0 4 , 0 0
4 , 8 0 5,10 5,00
5,60
5,90 5,70
Belgioue B e l g i ë
1,66
2 , 1 8
3 , 1 6
3 , 6 0 3 , 8 0
3 , 7 0
4 , 3 0 4 , 8 0
4 , 5 0
5,40 5,70 . 5,50
Luxem-bourg
1,94
2,34
3,29
3,70 3 , 8 0
3,70
4 , 4 0 4,70 4,60
5,20 5,30 5,20
United Kingdom
(2)
2 , 0 8
• 2 , 6 0 2,40
• 3 , 1 0 2 , 7 0
i n Eur
Danmark (2)
3 , 7 2
4 , 4 0 4 , 7 0 4 , 6 0
5,20 5,40 5,30
(1) The hourly cost is obtained 'by dividing the total labour costs (for
manual and non—manual workers torether) by the sum of the hours of work
offered by F anual workers and the contractual cr actual hours of v;ork
of non-mæiual workers.
5
Table 2
LABOUR COSTS IN INDUSTRY 1972 1 9 7 5 (1)
in natioanl currencies
11
12
13
14
21
N A C E
d e t r a c t i o n and b r i q u e t t i n g of . s o l i d f u e l s
Coke ovens
E x t r a c t i o n of p e t r o l e u m and n a t u r a l gas
Mineral o i l r e f i n i n g
E x t r a c t i o n and p r e p a r a t i o n of m e t a l l i f e r o u s o r e s
— 1972 1973 1974 1975 1972 1973 1974 1975 1972 1973 1974 1975 1972 1973 1974 1975 1972 1973 1974
. 1 9 7 5
BR Deutsch
l a n d
DM
16,37
1 5 , 6 0
1 8 , 9 0
1 9 , 6 0
2 3 , 6 0
1 7 , 3 5
2 0 , 0 0
2 2 , 8 0
2 5 , 0 0
13,96
1 5 , 7 0
17,80_
1 9 , 4 0
P r a n c e
F f r
1 9 , 7 4
3 2 , 0 9
3 4 , 6 0
4 0 , 6 0
4 7 , 1 0
2 8 , 3 5
3 0 , 7 0
3 7 , 2 0
4 2 , 4 0
2 2 , 2 2
2 5 , 0 0
3 0 , 1 0
3 5 , 8 0
I t a l i a
L i t
4036 4860 5320 • 2534 • • • 3213 3630 4480 • 2999 3290 3840 • 2405 . • .
N e d e r l a n d
P I
1 4 , 7 9
1 9 , 2 9
•
•
•
1 7 , 9 9
2 0 , 3 0
2 4 , 3 0
2 8 , 4 0
—
_
—
—
Belgique B e l g i ë
Pb • • • • 192,93 230,00
2 7 8 , 0 0
3 3 9 , 0 0
_
272,51 3 2 2 , 0 0
3 8 2 , 0 0
4 7 4 , 0 0
—
—
—
Luxem b o u r g
P i x
>M — «.
2 2 0 , 5 5
2 4 7 , 0 0
2 9 8 , 0 0
3 2 1 , 0 0
U n i t e d Kingdom
Ρ
1 6 8 , 5 6
2 1 1 , 0 0
2 7 5 , 0 0
• • • • Danmark Dkr ·_ •
3 1 , 5 9
3 7 , 8 0
4 2 , 9 0
—
—
—
.
(1) The hourly cost is obtained by dividing the total labour costs (for manual and nonmanual workers together) by the sum of the hours of work offered by manual workers and the
6
Table 2 (continued) in national currencies
N A C E
22 23 24 25 26 31 32 1 Production and preliminary pro cessing of metals
Extraction of
minerals other than metalliferous and energyproducing minerals ; peat extraction
Manufacture of non metallic mineral products
Chemical industry
Manmade fibres
industry
Manufacture of metal articles (except for mechanical, electrio al and instrument engineering and vehicles) Mechanical engineering 197?. 1973 1974 I975 1972 I973 1974 1975 1972 1973 1974 1975 1972 1973 1974 1975 1972 1973 1974 1975 1972 1973 1974 1975 1972 1973 1974 1975 BR Deutsch land DM 13,40 14,90 16,80 17,90 11,69 13,20 14,70 15,60 11,63 13,00 14,40 15,50 ¡4,64 16,40 18,50 20,30 13,03 14,80 16,60 18,20 11,98 13,70 15,20 16,60 13,04 15,00 16,80 18,20 France Ffr 16,91 19,10 22,90 27,50 14,75 16,90 19,80 23,00 14,69 16,90 20,10 23,50 19,43 22,00 25,90 30,00 19,03 21,30 25,40 29,30 14,08 16,10 19,00 22,30 15,85 17,80 21,00 24,50 Italia Lit 2065 • • β 1632 2000 2410 • 1504 • • • 2216 2570 3100 • 1981 2430 2980 • 1622 • • • 1793 • • ■ Neder land Fl • • • • 14,63 • • • 11,87 13,40 15,90 18,30 14,68 17,20 20,20 23,40 • • • • 11,14 12,70 15,50 17,60 11,64 13,30 16,00 18,60 Belgique België PID 191,52 227,00 277,00 323,00 156,36 181,00 221,00 267,00 153,37 179,00 218,00 266,00 197,03 234,00 286,00 344,00 188,50 212,00 261,00 315,00 153,32 182,00 220,00 266,00 162,39 190,00 228,00 274,CO Luxem bourg Fix 195,34 223,00 274,00 298,00 142,55 155,00 191,00 245,00 123,89 140,00 169,00 204,00 1.50,09 166,00 199.00 241,00 United Kingdom
Ρ
• 122,83 146,00 191,00 104,29 124,00 160,00 • 124,03 149,00 193,00 • 124,63 149,00 195,00 • 96,97 117,00 151,00 * 106,05 127,001 ie.;, 00
ι' Danmark Dkr • 30,88 38,50 45,80 • 26,69 32,70 38,40 . 28,91 33,90 38,70 • 32,09 38,80 44,70 • 27,24 33,60 38,60 « 29,13* 35,50* 41,60»7
-Table 2 (continued)
N A C E
33
34
Manufacture of office machinery and data processing machinery Electrical engineering 35 36 3" 41 42 43 Manufacture of motor vehicles and of motor vehicle parts and
accessories
Manufacture of other means of transport
Instrument engineering
Pood, drink and tobacco industry 4 Textile industry 1972 1973 1974 1975 1972 1973 1974 1975 1972 1973 1974 1975 1972 1973 1974 1975 1972 1973 1974 I975 1972 1973 1974 1975 1972 I973 1974 1875 BR Deutsch land. DM 15,18 16,70 18,60 20,30 12,61 14,60 16,30 18,00 14,22 16,00 17,80 19,70 12,88 14,80 16,70 18,10 10,96 12,60 14,00 15,40 10,52 12,00 13,30 14,60 9,63 10,90 12,10 13,20 I France Ffr 29,29 34,40 38,00 44,70 15,33 17,10 20,10 23,80 16,35 18,70 22,30 25,80 18,41 20,80 24,80 29,40 14,18 16,30 19,30 22,40 13,54 15,40 18,40 21,80 11,46 13,20 15,70 18,30 Italia Lit 2229 • • • 1793 « • • 2027 • • • 1904 • • • 1623 • * • 1680 I85O 2300 • 1356 I64O 2040 • Neder land Fl 12,97 14,00 16,70 20,20 13,34 15,00 17,60 20,40 11,84 13,90 16,90 19,10 12,79 15,20 18,10 20,40 12,26 14,20 16,70 19,10 11,79 13,40 15,70 18,40 10,18 11,80 13,50 16,20 Belgique België
. Fb
132,26 155,00 194,00 231,00 159,54 187,00 227,00 273,00 171,53 201,00 238,00 291,00 175,01 205,00 250,00 305,00 154,78 182,00 220,00 264,00 139,52 162,00 199,00 245,00 123,38 145,00 176,0c 214,00
in national currencies
Table 2 (continued)
N A C E
44
45
46
47
ι49
50
Leather and leather goods industry
(except footwear and clothing)
Footwear and clothing industry
Timber and wooden furniture industries
Manufacture of paper and paper products;
printing and
publishing
Processing of
rubber and plastics
Other manufacturing industries Building and civil engineering 1972 1973 1974 1975 1972 1973 1974 1975 1972 1973 1974 1975 1972 1973 1974 1975 1972 1973 1974 1975 1972 1973 1974 1975 1972 1973 1974 1975 BR Deutsch land
DM
8,87 9,70 10,60 11,50 8,75 9,80 10,80 11,80 10,79 12,30 13,70 14,70 11,56 13,oo 14,50 15,50 11,42 12,90 14,30 15,60 9,69 10,90 10,80 11,80 12,42 14,40 15,50 16,50 FranceFfr
10,77 12,30 14,60 17,40 10,29 11,80 13,90 16,60 11,03 12,90 15,20 17,90 16,73 19,00 22,50 26,20 13,72 15,70 18,70 22,00 12,50 14,30 16,90 19,90 13,29 15,20 17,80 20,80 ItaliaLit
1302 1540 I98O • II70 1390 1700 * 1232 1520 1880 • 2OO9 2320 272O • 1749 • • • 1323 • • • 1457 1750 215O • Neder landPI
9,59 11,20 13,50 14,80 7,71 8,70 10,60 12,80 10,22 11,70 13,80 15,80 12,81 14,60 17,20 19,60 11,60 12,90 15,20 17,50 10,55 12,30 14,20 16,80 12,43 14,20 16,90 19,60 Belgique België FP 122,93 147,00 175,00 208,00 96,43 114,00 140,00 174,00 125,85 146,00 183,00 227,00 154,07 183,00 224,00 280,00 148,89 175,00 216,00 259,00 99,84 119,00 143,00 176,00 154,33 188,00 Luxem bourgFix
M 76,81 85,00 99,00 119,00 . • • • • • • • 157,03 175,00 211,00 257,00 . • • * 113,51 131,00 — United KingdomΡ
• 81,72 98,00 122,00 • 70,14 86,00 109,00 • 98,56 116,00 151,00 * 114,23 136,00 171,00 • 105,46 128,00 163,00 • 86,86 108,00 134,00 * 106,79229,00 164,00 124,00
j !
280,00 ! 195,00 160,00
9
-Tabi« 3 2 (continued)
N A C E
A
Β
Mining and quarrying
Total manufacturing
industries
C
All industries (A+B + 50)1972
1973
1974
1975
1972
1973
1974
1975
1972
1973
1974
1975
BR Deutsch
land
DM
15,27
•
•
•
12,16
13,70
15,30
16,70
12,29
13,80
15,30
16,70
France
Ffr
19,32
22,00
26,10
32,20
14,96
17,30
20,40
23,90
14,73
16,90
20,00
23,50
Italia
Lit
1971
229Ο
2820
•
1702
2020
248Ο
•
1680
I98O
24OO
•
Neder land
Fl
•
•
•
*
12,12
13,80
16,50
19,00
12,23
14,00
16,60
19,20
Belgique België
• Pb
188,39
223,00
270,00
336,00
155,63
179,00
219,00
265,00
153,62
181,00
221,00
269,00
in national currencies
Luxem bourg
Fix
191,75
215,00
256,00
290,00
171,89
194,00
236,00
267,00
160,14
182,00
222,00
254,00
United Kingdom
Ρ
•
143,09
•
•
•
106,45
127,00
163,00
•
107,94
•
•
Danmark
Dkr
M
•
28,16
34,50
40,40
•
•
•
10
-Table 3
LABOUR COSTS IN INDUSTRY 1972-1975 0 )
in Eur
N A C E
11 12 13 14 21 22 Extraction and briquetting of solid fuels Coke ovens Extraction of petroleum and naturel gas Mineral oil refining Extraction and preparation of metalliferous ores Production and preliminary pro cessing of metals.
1972 1973 1974 1975 1972 1973 1974 1975 1972 1973 1974 1975 1972 1973 1974 1975 1972 1973 1974 1975 1972 1973 1974 1975 BR Deutsch land 4,68 • • • • • • • 4,46 5,70 6,10 7,30 4,96 6,00 7,10 7,80 3,99 4,70 5,50 6,00 3,83 4,50 5,20 5,60 France 3,55 • • • • • • •
5,78
6,20 6,80 8,30 5,10 5,50 6,20 7,50 4,00 4,50 5,00 6,30 3,04 3,50 3,80 4,90.. . Ί
Italia 6,39 6,70 6,60 • 4,01 • • « 5,09 5,00
5,50
• 4,75 4,50 4,70 • 3,81 • • • 3,27 • • •■ " — ι
Neder land 4,20 5,48 • • •
5,11
5,90
7,30 8,50 _ — • • • • Belgique België • • • . •3,97
4,70
5,70
7,00
_ -5,60 6,60 7,90 9,70 » :-3,94
4,70
5,70
6,60 Luxem bourg . _ _ 4,53 5,10 6,10 6,60 4,01 4,60 5,60 6,10 United Kingdom 3, 3, 4, 2 2, 30 90 60 40 70 20 Danmark _ _ — • 4,17 5,005,70
_ — •4,07
5,10 6,00 [image:19.595.5.586.157.741.2]11
-Table 3 (continued)
23 24 25 26 31 32 33
N A C E
Extraction of
minerals other than metalliferous and energyproducing minerals: peat extraction
Manufacture of non metallic mineral products Chemical industry Manmade fibres industry Manufacture of metal articles
(except for mechan ical, electrical and instrument engineering and vehicles) Mechanical engineering Manufacture of office machinery and data processing machinery 1972 1973 1974 I975 1972 1973 1974 1975 1972 1973 1974 1975 1972 1973 1974 1975 1972 1973 1974 1975 1972 1973 1974 1975 1972 1973 1974 1975 BR Deutsch land 3,34 4,00 4,60 4,90 3,32 3,90 4,50 4,80 4,18 4,90 5,80 6,30 3,72 4,40 5,20 5,60 3,42 4,10 4,70 5,10 3,73 4,50 5,20 5,70 4,34 5,00 5,80 6,30 France 2,66 3,00 3,30 4,10 2,65 3,10 3,30 4,10 3,50 4,00
4,30
5,30
3,43 3,80 4,20 5,20 2,54 2,90 3,20 3,90 2,85 3,20 3,50 4,30 5,27 6,20 6,30 7,90 . Italia 2,58 2,70 3,00 • 2,38 • • • 3,51 3,50 3,80 • 3,14 3,30 3,70 • 2,57 • • • 2,85 • • • 3,53 • • • Neder land 4,15 • • • 3,37 3,90 4,70 5,40 4,17 5,00 6,00 7,00 • • • • 3,16 3,70 4,60 5,20 3,30 3,80 4,80 5,50 3,68 4,00 5,00 6,00 Belgique België 3,21 3,70 4,50 5,50 3,15 3,70 4,50 5,50 4,05 4,80 5,90 7,103,87
4,40
5,40
6,50
3,15
3,70
4,50
5,50
3,34 3,90 4,70 5,60 2,72 3,20 4,00 4,70 Luxem bourg 2,93 3,203,90
5,00 • β • • • • • • • • • • 2,55 2,90 3,50 4,20 3,08 3,40 4,10 5,00 _ United Kingdcm • • • • • 2,04 2,30 2,70 • 2,43 2,80 3,20 • 2,44 2,80 3,30 . 1,90 2,20 2,50 • 2,08 2,40 2,70 * 2,48 2,70 2,20 in Eur Danmark • 3,52 4,30 5,10 • 3,81 4,50 5,10 ■ 4,23 5,10 5,90 — • 3,59 4,40 5,10 • 3,84* 4,70* 5,50* • • • • I [image:21.595.23.584.77.762.2]12
-Tabi 3 3 (continued)
N A C E
34 35 36 37 41 Electrical engineering Manufacture of motor vehicles and of motor vehicle parts and
ccessories
Manufacture of other means of transport
Instrument
engineering-Pood, drink and 42 obacco industry
43
44
Textile industry
Leather and leather goods industvy
υ
-Tabic : 3 (continued)
Ν A C E
45 46 47 48 49 50
A
Footwear and clothing industryTimber and wooden furniture
industries
Manufacture of paper and paper products ; printing and publishing
Processing of
rubber and plastics
Other manufacturing industries Building and civil engineering Mining and cruarrymg 1972 1973 1974 1975 1972 1973 1974 1975 1972 1973 1974 1975 1972 1973 1974 1975 1972 1973 1974 1975 1972 1973 1974 1975 1972 1973 1974 1975 BR Deutsch land 2,50 3,00 3,30 3,70 3,09 3,70 4,30 4,60 3,30 3,90 4,50 4,80 3,26 3,90 4,40 4,80 2,77 3,30 3,40 3,70 3,55 4,30 4,80 5,10 4,37 • • • France 1,85 2,10 2,30 2,90 1,99 2,30 2,50 3,20 3,01 3,40 3,70 4,60 2,47 2,80 3,10 3,90 2,25 2,60 2,80 3,50 2,39 2,70 3,00 3,70 3,48 4,00 4,40 5,70 Italia 1,85 1,90 2,10 • 1,95 2,10 2,30 • 3,18 3,20 3,30 • 2,77 • • • 2,10 • • • 2,31 2,40 2,70 ■ 3,12 3,10 3,50 ■ Neder land 2,19 2,50 3,20 3,80 2,90 3,40 4,10 4,70 3,64 4,20 5,10 5,80 3,29 3,70 4,50 5,20 3,00 3,60 4,20 5,00 3,53 4,10 5,00 5,90 • • • • Belgique België 1,98 2,40 2,90 3,60 2,59 3,00 3,80 4,70 3,17 3,80 4,60 5,80 3,06 3,60 4,50 5,30 2,05 2,50 2,90 3,60 3,17 3,90 4,70 5,80 3,87 4,60 5,60 6,80 Luxem bourg 1,58 1,8θ" 2,00 2,50 ♦ • • • • • • 3,23 3,60 4,30 5,30 • • • • 2,33 2,70 3,40 4,00 3,94 4,40 5,30 6,00 United Kingdom 1,37 1,60 1,80 • 1,93 2,20 2,50 • 2,24 2,60 2,90 • 2,06 2,40 2,70 • 1,70 2,00 2,20 • 2,09 2,30 2,70 . 2,80 • • in Eur
L· clH LT1. S, Γ.Κ
14
Tabi e 3 (continued)
N A C E
Β
C
Total manufacturing industries
All industries (A + 3 l· 50)
!
1972
1973
I974
I975
1972
I973
1974
1975
BR Deutsch
land
3,48
4,10
4,70
5,20
3,51
4,10
4,80
5,20
Prance
2,69
3,10
3,40
4,20
2,65
3,10
3,30
4,10
Italia
2,70
2,80
3,10
e
2,66
2,70
3,00
•
N e d e r land
3,44
4,00
4,90
5,70
3,47
4,00
5,00
5,70
Belgique België
3,20
3,70
4,50
5,50
3,16
3,70
4,50
5,50
Luxem b o u r g
3,53
4,00
4,90
5,50
3,29
3,70
4,60
5,20
United Kingo.om
•
2,08
2,40
2,70
•
2,11
•
•
in E u r !
Danmark
3,72
4,60