
Amyloid fibril length distribution quantified by atomic
force microscopy single-particle image analysis
Wei-Feng Xue1, Steve W. Homans and
Sheena E. Radford1
Astbury Centre for Structural Molecular Biology, Institute of Molecular and Cellular Biology, University of Leeds, Leeds LS2 9JT, UK
1
To whom correspondence should be addressed. E-mail: [email protected], [email protected]
Amyloid fibrils are proteinaceous nano-scale linear aggre-gates. They are of key interest not only because of their association with numerous disorders, such as type II dia-betes mellitus, Alzheimer’s and Parkinson’s diseases, but also because of their potential to become engineered high-performance nano-materials. Methods to character-ise the length distribution of nano-scale linear aggregates such as amyloid fibrils are of paramount importance both in understanding the biological impact of these aggregates and in controlling their mechanical properties as poten-tial nano-materials. Here, we present a new quantitative approach to the determination of the length distribution of amyloid fibrils using tapping-mode atomic force
microscopy. The method described employs
single-particle image analysis corrected for the length-depen-dent bias that is a common problem associated with surface-based imaging techniques. Applying this method, we provide a detailed characterisation of the length distri-bution of samples containing long-straight fibrils formed
in vitro from b2-microglobulin. The results suggest that the Weibull distribution is a suitable model in describing fibril length distributions, and reveal that fibril fragmen-tation is an important process even under unagitated con-ditions. These results demonstrate the significance of quantitative length distribution measurements in
provid-ing important new information regarding amyloid
assembly.
Keywords: bias correction/brittleness/fibril fragmentation/ single-molecule method/size distribution
Introduction
Amyloid fibrils are highly ordered proteinaceous assemblies commonly regarded as the end products of nucleated poly-merisation (Ferrone, 1999). These self-assembled aggregates are of key biological interest because of their association with numerous disorders, such as type II diabetes mellitus, Alzheimer’s and Parkinson’s diseases (Chiti and Dobson, 2006). Amyloid fibrils share a common core cross-beta mol-ecular architecture (Sunde et al., 1997), and appear usually as unbranched filaments up to several micrometres in length, despite having a width in the order of only 10 nm (Knowleset al., 2007; Whiteet al., 2009). The strong mech-anical properties of these stable assemblies suggest that they are potential candidates to become engineered
high-performance nano-materials (Smith et al., 2006b; Knowleset al., 2007).
To further our understanding of the complex mechanisms involved in the formation of amyloid fibrils, as well as the biological impact of amyloid assembly in disease, it is important to determine the precise length distribution of fibril samples. For example, the ability for a fibril sample to seed the growth of new fibrils is strongly dependent on the extent to which fibrils have been fragmented (Collins et al., 2004; Xue et al., 2008), with samples containing shorter fibrils being more effective in seeding due to the increased number of extension sites per weight of fibril material, com-pared with long fibrils. Similar to the ability to seed, the dynamic equilibrium between fibrils and soluble, potentially cytotoxic, species is also dependent on the length distribution of the fibrils (Carulla et al., 2005). Fibril fragmentation, a mechanism that significantly reduces fibril length depending on the length distribution of the fibrils being fragmented (Hill, 1983), has been show to be an essential factor in the replication and the phenotype strength of prions (Tanaka
et al., 2006). Akin to other nano-scale materials (Colvin, 2003; Lynch et al., 2006), amyloid fibrils may also assert other distinct biological properties depending on their dimen-sions. Thus, methods to characterise fibril length distributions could have important implications in the development of therapies against amyloid disease by providing information about the mechanism of fibril formation (Sun et al., 2008; van Raaijet al., 2008; Bernacki and Murphy, 2009), as well as fibril length-dependent factors in amyloid disease. Methods to characterise fibril length distributions are also important in characterising the mechanical properties and the biological impact of artificial amyloid-like fibrils designed as potential nano-materials.
Tapping-mode atomic force microscopy (TM-AFM) is a direct and model-free method for characterising particle size distributions. This imaging method does not suffer from the need to separate the size distribution information from other complicating factors, such as solution viscosity, particle density and particle shape, as in the case of sedimentation or light scattering measurements. Being inherently a single-particle method, TM-AFM image analysis also provides detailed distribution information that cannot easily be obtained from ensemble methods. However, because TM-AFM is a surface-based technique, the observed size dis-tribution of particles may not reflect the bulk sample size distribution, because of unequal probability of detecting different species. Here, exemplified by the detailed character-isation of the length distribution of samples containing long-straight fibrils formedin vitro from humanb2-microglobulin (b2m) (Gosal et al., 2005; Whiteet al., 2009), we present a quantitative TM-AFM and single-particle image analysis method for characterising the length distribution of amyloid fibrils. The method described includes a novel approach to
#2009 The Author(s).
This is an Open Access article distributed under the terms of the Creative Commons Attribution Non-Commercial License
detect and correct for length-dependent bias, which is a common problem associated with the surface-based nature of AFM imaging techniques. Using this method, we show that the length distribution of long-straight b2m fibrils (Gosal
et al., 2005) cannot be adequately described by the normal distribution, whereas the Weibull distribution (Weibull, 1951) could be used instead as a suitable distribution model for fibril length. Our analysis of b2m fibrils also suggests that fragmentation is an important process even under unagi-tated conditions, highlighting the significance of fragmenta-tion in determining the rate of fibril propagafragmenta-tion and the properties of fibrils formed under ambient conditions.
Results
Extracting observed fibril length probability distributions from TM-AFM images
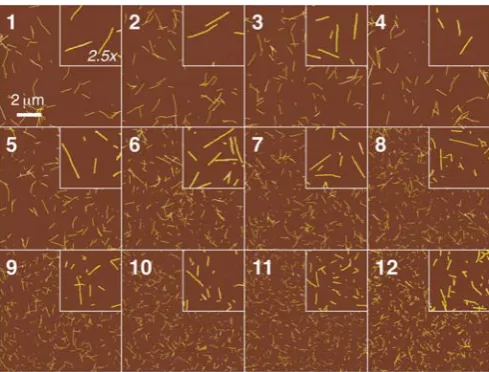
TM-AFM images of long-straight b2m fibrils deposited on freshly cleaved mica surfaces were collected at a resolution of 10241024 pixels over 1010mm areas as described in the Materials and methods section. A total of 76 height images were collected from 12 different samples containing fibrils of identical morphology but of varying length. To ensure that the same amount of fibrils in terms of initial monomer concentration or weight is present in the samples, each sample was carefully prepared by applying agitation subsequent to seeded fibril growth (described in the Materials and methods section). Under the solution con-ditions employed, small soluble oligomers or large non-fibrillar aggregates are not observed in the fibril samples (Smith et al., 2006a; Xue et al., 2008), and virtually all (.95%) of the initial monomers are incorporated into fibrils (Smith et al., 2006a), further ensuring equal mass concen-tration of fibrils present in every sample. Figure 1 shows typical height image of each of the 12 samples. From these height images, the length and the height along the highest ridge of individual fibrils, unambiguously traced according to criteria described in the Materials and methods section, were measured. Depending on the length of the fibrils in each
sample, 4 – 16 images were collected and 374 – 1298 fibrils were successfully traced for each sample, with 20 – 340 fibrils successfully traced on each image (again depending on fibril length). A total of 9298 fibrils were traced and ana-lysed. In Fig. 2A, the measured length Lof traced fibrils for samples 1, 2, 6 and 12, as examples, is plotted in unbinned frequency histograms to illustrate the connection between the raw fibril length data and the probability density of the observed length probability distribution in each case. For each sample, the measured length of fibrils, L, can be regarded as a continuous random variable independently drawn from an underlying probability distribution character-ised by its cumulative distribution function, FL(l)¼P(Ll),
or its probability density function, fL(l)¼dFL(l)/dl, where l
represents the length and P the probability. The goal of the length distribution analysis described herein is thus to find
FL(l) and fL(l) of a probability distribution model that can
empirically describe the probability of finding fibrils with lengthLin each sample analysed.
Figure 2B shows binned frequency histograms for the same examples as in Fig. 2A, with each bar of bin khaving a value corresponding to the number of observed fibrils N(k) with fibril lengthL that satisfiesl(k)L,l(k)þDlk, where l(k) is the lower boundary length value of bink andDlk the
bin size (Dlk¼83.3 nm in Fig. 2). The cumulative frequency
plots of the number of fibrils with fibril length L equal or shorter than l, N(Ll), are also shown for comparison in the same graphs. These cumulative functions are bin size independent and the value at l equal to or larger than the longest fibril observed indicates the total number of fibrils measured for each sample. To facilitate direct comparison between the length distributions of different samples, the probability density, and the cumulative probability of the observed length probability distributions, was evaluated. Figure 2C, for samples 1, 2, 6 and 12, shows unit area histo-grams that represent estimation of the observed length prob-ability density functions. The probprob-ability density of each bin,
Pobs(k), on these unit area histograms was obtained by nor-malisingN(k) with the number of observations made (in this case, the number of fibrils measured for each sample), PN
obs, and the bin size,Dlk, so that the total area of all bars
is equal to 1:
PobsðkÞ ¼
NobsðkÞ
DlkPNobs
ð1Þ
On the same plots, the observed cumulative probability,
Pobs(Ll), is also plotted for each sample:
PobsðLlÞ ¼
NobsðLlÞ
P
Nobs
ð2Þ
As shown in Eq. (2), the observed cumulative probability is obtained by normalisingNobs(Ll) with the total number of observations made.
Detection of length-dependent bias
[image:2.612.52.297.514.700.2]Fibrils of different length may not be detected by TM-AFM imaging with identical efficiency due to length-dependent differences in their surface deposition efficiency. Length Fig. 1. TM-AFM height images of samples with long-straight fibrils formed
measurements of fibrils may be further biased due to length dependence in the frequency at which a fibril can be unam-biguously traced in image analysis. To detect whether the observed length probability distributions are length biased, the relationship between the observed weight average length and the observed total length of fibrils successfully traced on each image was analysed.
[image:3.612.54.559.54.458.2]The modal height of all analysed fibrils plotted against their length is shown in Fig. 3A, with the horizontal line indicating the average modal height of 5.2 nm [consistent with previous TM-AFM measurements (Gosal et al., 2005)]. As shown in Fig. 3A, there is a considerable variation in the observed height of fibrils, which is to be expected due to variations in the twist of the fibrils and the orientation of deposition on the surface. Importantly, however, there is no significant length dependence of fibril height, consistent with the fact that fibrils of the same morphology were analysed. This confirms that the average
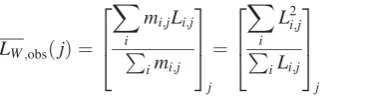
width of these fibrils is not related to their length in the samples analysed. Given the same fibril width, the observed weight average length, LW;obsðjÞ, of analysed fibrils on each
imagejcan then be calculated because the mass,mi,j, of a fibril iis proportional to its lengthLi,j:
LW;obsðjÞ ¼
X
i
mi;jLi;j P
imi;j 2
6 4
3 7 5
j
¼
X
i
L2i;j
P iLi;j 2 6 4
3 7 5
j
ð3Þ
[image:3.612.359.544.639.689.2]for all samples, the total length of fibrils successfully traced on each image should (on average) be independent of the length of fibrils imaged, if there is no length-dependent bias. However, the total length of fibrils successfully traced on each image relative to the average total length over all images, Ltot;obsðjÞ=Ltot;obsðjÞ ¼ ½PiLi;jj=½
P
iLi;jj, plotted against the weight average length of fibrils successfully traced on each of the 76 images analysed,LW;obsðjÞ(Fig. 3B) shows
the contrary for imaged long-straight b2m fibrils. The total length of traced fibrils on images with shorter fibrils is greater than traced fibrils on images with longer fibrils (Fig. 3B). This behaviour indicates that a greater mass of fibrils are effectively detected for the purpose of length measurements in samples containing short fibrils compared with their longer counterparts, despite all samples containing identical bulk mass concentration of fibrils. The observed length probability distribution is therefore biased towards short fibrils. This bias reflects the more favourable net effect of mass transport (more favourable diffusion, more favourable number concen-tration gradient and less favourable sedimentation) and binding (likely to be less favourable) to the mica surface during surface preparation for shorter b2m fibrils under the conditions employed compared with their longer counter-parts. The difference in the deposition efficiency is evident from the fact that the total mass of fibrils deposited on the mica surfaces, estimated by the total number of pixels per image with height .2 nm, is two to three times greater for
sample 12 than for sample 1 or 2 (Fig. 1), despite identical image size. The bias towards short fibrils may also reflect the fact that the frequency of tracing long fibrils successfully is lower than for short fibrils due to more frequent cases of cut off by image boundaries and/or fibril overlap.
Correction of length-dependent bias
To correct for the length-dependent bias in the observed length probability distributions, a weighting function, wbc(l), was proposed, which allows the probability of finding a fibril with length l¼L in the bulk samples, Pc(l), to be obtained from the probability of successfully tracing a fibril of the same length on TM-AFM images of the sample, Pobs(l), such that:
PcðlÞ ¼wbcðlÞ PobsðlÞ ð4Þ
To find a suitable function wbc(l) that could satisfy Eq. (4), the criterion that the total length of traced fibrils on each image after bias correction should be the same, on average, was used. This criterion reflects the reasonable assumption that if there is no length-dependent bias, the same total mass of fibrils should be traceable for the purpose of length measurements, given that the same mass concentration of fibrils is present in each sample. For the purpose of bias cor-rection in accordance with Eq. (4),wbc(l) could be an empiri-cal function of any suitable functional form. Different functional forms were therefore tested to find a weighting function that is low in complexity, but effective in correcting the observed bias. A power function in this case is a good starting point as the relative fibril detection efficiency for length measurements may be governed by an underlying power law:
wbcðljaÞ ¼a1la2þ1 ð5Þ
Parameters aof possiblewbc(l) function(s) that satisfy the bias correction criterion, such as Eq. (5), could be found using a least-squares minimisation approach. In this case, the residual sum of squares to be minimised, RSS, corresponds to the sum of squares of the relative difference between the total length of fibrils i traced on each image j and the average of the total length of fibrils traced on each image over all imagesjof the data set:
^
a¼argminðRSSÞ
a
¼argmin a
X
j P
iNcðl¼Li;jÞLi;j P
iNcðl¼Li;jÞLi;j
P
iNcðl¼Li;jÞLi;j P
iNcðl¼Li;jÞLi;j
" #2
j 0
@
1 A 8
< :
9 = ;
¼argmin a
X
j
1
P
iwbcðl¼Li;jjaÞLi;j P
iwbcðl¼Li;jjaÞLi;j " #2
j 0
@
1 A 8
< :
9 = ;
ð6Þ
[image:4.612.48.301.57.296.2]Estimates ^a of adjustable parameters a are then found when the RSS function is at its minimum. In Eq. (6), Nc(l¼ Li,j) represents the corrected detection frequency of a fibril
Fig. 3. Bias correction of the observed fibril length data. (A) Modal height of fibrils plotted against their length, illustrating that the width of the fibrils in analysed samples is not length-dependent. The black line denotes the average modal height of 5.2 nm. (B) The observed total length of traced fibrils on each image normalised by its average value over all images analysed plotted against the observed weight average length of traced fibrils on each image. The relationship plotted demonstrates significant length-dependent bias in the detection efficiency for fibril length measurements. (C) The experimentally determined bias correction weighting functionwbc(l) obtained for the observed data shown in A and B using the method outlined in the text and Eqs. (4 – 6). The y-axis is normalised with the value of obtained wbc(l) for the longest fibril measured in the entire data set (l¼
Lmax). (D) The same plot as in B but with the data bias corrected using the
with length Li,j, obtained by correcting the observed
fre-quency [in this case, Nobs(l¼Li,j)¼1, Fig. 2A], according
to Eq. (4):
NcðlÞ ¼wbcðlÞ NobsðlÞ ¼wbcðlÞ ð7Þ
Least-squares fitting using Eqs. (5) and (6) to the b2m fibril length data set (Fig. 3B) yielded an exponent parametera2¼ 0.99, indicating that a linear function may be appropriate to use aswbcin this case. Fitting witha2fixed at 1 (effectively fitting a linear function) resulted in largely unchanged results as expected, suggesting that the relative efficiency of tracing fibrils depends linearly on their length in this case. Figure 3C shows the resulting linear wbc(l) function versus fibril length. Figure 3D shows the corrected total length of traced fibrils relative to the average corrected total length over all 76 images,
Ltot;cðjÞ=Ltot;cðjÞ ¼ Piwbcðl¼Li;jÞLi;j
j= P
iwbcðl¼Li;jÞLi;j
j, plotted against the corrected weight average length of fibrils successfully traced on each image,LW;cðjÞ, where:
LW;cðjÞ ¼
P
iNcðl¼Li;jÞmi;jLi;j P
iNcðl¼Li;jÞmi;j
j
¼
P
iwbcðl¼Li;jÞL2i;j P
iwbcðl¼Li;jÞLi;j " #
j
ð8Þ
As shown in Fig. 3D, the total length of fibrils successfully analysed on each image, corrected by wbc(l), on average, is no longer dependent on the length of fibrils analysed, as specified by the criterion of bias correction. The resulting function wbc(l) in this case, as seen in Fig. 3C, suggests for the b2m fibrils analysed and under the conditions employed that the ratio between the bulk number concentration of fibrils of 3mm in length and the frequency of which these fibrils were unambiguously traced on images is 14 times lower than fibrils of 50 nm. This information could then be used to quantitatively correct the length distribution of fibrils observed experimentally by TM-AFM for the length-dependent bias using Eqs. (4) and (7). Figure 2D shows examples of unit area histogramsPc(k) and cumulative prob-abilitiesPc(Ll) of corrected fibril length probability distri-bution of samples 1, 2, 6 and 12. Compared with the observed length probability distributions (Fig. 2C and grey lines in Fig. 2D), the bias-corrected distributions are shifted towards longer length. The difference between the observed and the corrected length distributions is, however, sample-dependent, with bias having the most pronounced impact on samples with broad length distributions and longer fibril length, such as in the case of samples 1 and 2 where the median lengths are shifted by as much as over 200 nm. Thus, the length-dependent bias may have a significant impact on the quantitative measurements of amyloid fibril length distri-butions, and should be taken into account for any analysis of fibril length or length dependence in biological or physical properties of the amyloid fibrils.
Fitting probability distribution models to the length distribution data
To examine whether the bias-corrected fibril length prob-ability distributions can be described by a probprob-ability
distribution model, a set of five continuous probability distri-butions that are defined between 0 and þ1 were tested against the bias corrected experimental data shown in Fig. 2D, including log-normal, exponential, gamma, Rayleigh and Weibull distributions. Although not appropriate from a physical point of view since it allows probability density at negative length values, the normal distribution was also fitted to the data for comparison. To ensure that the probability distributions tested were fitted to the data in a manner independent of bin size that appropriately reflect the probability distribution of each tested model, parameter esti-mationsu^of each tested distribution model were obtained by using the maximum likelihood estimation (MLE) (Press, 2002) method:
^
u¼arg max u
Y
i
fLðl¼LijuÞ wbcðl¼LiÞ
( )
¼arg min u
X
i
wbcðl¼LiÞlog½fLðl¼LijuÞ
( )
ð9Þ
In Eq. (9), each fibril length measurement in a sample is assumed to be an independent observation from an identical length probability distribution. Best-fit parameters ^u of the tested distribution can then be found when the likelihood of observing the measured lengths, i.e. the product of the prob-ability densities fL(l) of each observation of the sample, is
maximised. Since length observations in this case are biased towards short fibrils as shown in Fig. 3B, the probability density of each observation is corrected by modifying the frequency of measuring a fibril of length Li with the
exper-imentally determined bias correcting function [wbc(l¼Li) in
Eq. (9) using Eq. (7)] in order to effectively fit distribution models to the bias-corrected data.
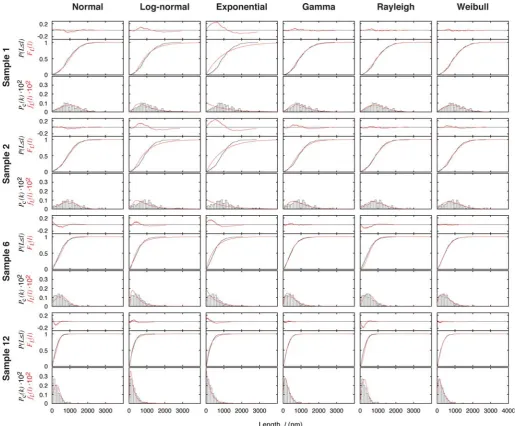
Typical results of the MLE fitting of the tested distribution models to the length probability distribution data are shown in Fig. 4, exemplified again using samples 1, 2, 6 and 12. For each model and each sample in Fig. 4, the cumulative distribution function of the fitted model, FL(l) (red line,
middle graph), and the data, Pc(Ll) (black line, middle
graph), as well as the probability density function of the fitted model,fL(l) (red line, bottom graph), and the unit area
histogram, Pc(k) (bars, bottom graph), are shown for com-parison. The difference between the cumulative distribution function of the fitted model and the data, FL(l)2Pc(Ll)
(red line, top residual plot), indicating the quality of the fit, is also shown in Fig. 4 for each model and each sample. In the case of probability distribution fitting, the maximum difference between the cumulative distribution function of the fitted model and the data, i.e. max(jFL(l)2Pc(Ll)j) or
the maximum absolute value of the red line in the residual plots in Fig. 4, quantitatively describes the goodness of the fits (Table I). This quantity, given sufficient sample size as the case presented here (for every sample analysed,
from a probability distribution equal to the fitted distribution. Table I summarises the quality of the fits of each of the six tested models to the data of each of the 12 samples, with italicised entries corresponding to the cases where the Kolmogorov – Smirnov test rejected the null hypothesis in favour of the alternative hypothesis that the data, with 95% significance, are not consistent with the fitted distribution model. As shown in Table I, all tested models except Weibull and gamma distributions fitted significantly poorly to the majority of the measured sample distributions as judged by the Kolmogorov – Smirnov test. Visual comparison of the fits and the residual plots in Fig. 4 also showed that both the Weibull and the gamma distributions consistently yielded fitted distributions that have the smallest differences to the data across different samples, corroborating with the Kolmogorov – Smirnov test results in Table I. Out of all six tested models, the Weibull distribution is least inconsistent
with the data (not significantly inconsistent with 11 out of 12 samples, Table I), suggesting that the Weibull probability distribution could be a suitable model describing the measured fibril length probability distributions. More impor-tantly, results shown in both Table I and Fig. 4 indicate that commonly used distribution models such as normal and exponential distributions do not represent satisfactory models in the case of fibril length distribution.
Discussion
[image:6.612.46.562.55.481.2]probability distributions, represented by both their cumulat-ive probability and probability densities. This facilitates sample comparison in a sample size and bin size-independent manner. Here, the probability density is estimated by unit area histograms obtained by normalising frequency histograms with sample size and bin size. Histograms estimate probability density in a highly bin size-dependent manner, in that the apparent ‘noise’ seen in the histograms varies with changes in the bin size. Therefore, they do not readily reflect the quality of the data. It is there-fore important that the data are also represented by their cumulative probability plot where each individual obser-vation is visualised more effectively. (ii) Given that a length-dependent bias is found in the observed length probability distributions, this is corrected by an experimentally deter-mined weighting function in order to estimate the true bulk sample length probability distributions from the observed data. This method used to determine the bias correction weighting function relies on the assumption that the mass of effectively traced fibrils per unit image area, independent of the sample length distribution, should be the same after bias correction for samples containing equal mass concentration of fibrils. As TM-AFM imaging is a surface-based method, the effective detection of fibrils for the purpose of length measurements is dependent on the surface deposition effi-ciency and the image analysis effieffi-ciency, both of which are likely to be length dependent, as demonstrated here for long-straight b2m fibrils. It is therefore crucial that the observed length distribution is not taken directly as the bulk length distribution without testing and correcting for length-dependent bias. The bias correction weighting function could be readily determined for other types of fibrils, correcting for bias originating from similar sources but with the extent of the bias likely to be dependent on the type of sample material, the type of surface and the protocol of deposition. Such an approach is therefore generically applicable and could be used for fibrils formed from different peptide or
protein precursors, deposited onto different surfaces under different conditions, and imaged using entirely different tech-niques such as electron microscopy. (iii) Probability distri-bution models are fitted to the bias-corrected data using the MLE method to find distribution model(s) that can describe the data in a bin size-independent manner appropriate and consistent with the fitted model. Because any form of model fitting should be performed against the raw data if possible, it is not ideal to fit distribution models by least-squares fitting probability density functions to binned data in the form of histograms. Here, by using the MLE (Press, 2002) method, distribution fitting is performed directly on the raw observations, based on the probabilities calculated from the fitted distribution model. The goodness of fit can then be quantitatively assessed by performing the Kolmogorov – Smirnov test (Press, 2002) to check if the fitted distribution model is reasonable. The outlined fitting procedure is general, and could readily be applied to the analysis of other fibrillar samples, including amyloid fibrils as well as other linear polymers.
The method we have outlined here was exemplified by the analysis of 12 samples containing long-straight fibrils of human b2m with a spectrum of lengths formed in vitro by controlled mechanical agitation. Results of this analysis suggest that the normal distribution does not provide good description of fibril length distribution data. Instead, the Weibull distribution (Weibull, 1951) provides a satisfactory distribution model in describing fibril length distributions, potentially providing critical constraint for future mechanistic studies of fibril formation. More importantly, samples 1 and 2 (Figs 2 and 4) show similar length distributions, despite the fact that these samples are formed under quiescent con-dition by seeding a monomer solution with 0.1% (w/w) or 10% (w/w) fibrillar seeds taken from an identical solution of preformed fibrils, respectively. Since long-straight b2m fibril growth from preformed extension sites under the conditions employed proceeds orders of magnitude more rapidly than the creation of new extension sites by nucleation (Xueet al., 2008), the length of fibrils extended from 0.1% (w/w) fibril seeds is expected to be up to two orders of magnitude longer on average compared with growth from 10% (w/w) seeds. The observed similarity in the length distribution of samples 1 and 2 therefore suggests that fibril fragmentation (Collins
[image:7.612.46.297.91.246.2]et al., 2004; Smithet al., 2006b; Xueet al., 2008) must be a significant process even when fibril samples are not agitated, such that the resulting fibrils do not extend beyond a few micrometres in length, independent of the amount of seeds added. These conclusions highlight the important infor-mation contained within fibril length distribution data and show how critical insights can be derived about the proper-ties of fibril formation mechanisms from these data. Thus, analysis of the mechanism of amyloid assembly and the bio-logical impact of amyloid in disease could benefit signifi-cantly from data obtained through quantitative measurements of fibril length distributions. As a whole, the method pre-sented herein offers a quantitative approach to the exper-imental determination of the length distribution using TM-AFM that could be applied not only to amyloid fibrils but also to other linear polymers. The distribution analysis approach outlined here should also be useful for other types of single-particle or single-molecule techniques that probe the underlying distributions of measured properties.
Table I. Goodness of fit testing of the MLE results by the Kolmogorov – Smirnov test
Sample Tested probability distributions
Normal Log-normal Exponential Gamma Rayleigh Weibull
1 0.074 0.102 0.248 0.064 0.051 0.046
2 0.055 0.126 0.244 0.079 0.036 0.056
3 0.085 0.090 0.217 0.047 0.052 0.032
4 0.040 0.141 0.207 0.094 0.053 0.053
5 0.073 0.124 0.169 0.075 0.088 0.053 6 0.088 0.084 0.141 0.039 0.111 0.026 7 0.076 0.097 0.140 0.060 0.117 0.044 8 0.097 0.066 0.139 0.039 0.142 0.041 9 0.096 0.080 0.110 0.039 0.147 0.036 10 0.102 0.042 0.161 0.038 0.120 0.040 11 0.107 0.049 0.146 0.036 0.156 0.043
12 0.113 0.060 0.110 0.031 0.179 0.033
The number listed for each sample and each model indicates the test quantity, which is the maximum difference between the cumulative distribution function of the fitted model and the data, max(jFL(l)2Pc(L
Materials and methods
Fibril sample preparations
Wild-type b2m was expressed and purified as previously described (Kad et al., 2001; Gosal et al., 2005). Long, straight fibrils of b2m were formed at 120mM initial monomer concentration in a reaction buffer containing 10 mM sodium di-hydrogen phosphate and 50 mM NaCl, adjusted to pH 2.0 using HCl. The fibril growth reaction was initiated by dissolving lyophilised protein into the reaction buffer using the method previously described (Xue et al., 2008), and was performed by stirring a 500ml fibril sample in a 1.5 ml glass vial containing a 38 mm PTFE-coated magnetic stirring bar. Stirring was carried out using a custom-made precision stirrer with accurate rpm readout pro-vided by a rev-counter on the rotor axis (custom built by the workshop of the School of Physics and Astronomy, University of Leeds) at 1000 rpm, 258C. The above sample was subsequently used as seed to generate all fibril samples imaged in this study to ensure an identical morphology of the fibrils produced. The identities of the samples imaged are the following: (i) fibril solution of 120mM initial monomer concentration containing 0.1% (w/w) seed grown under quiescent growth condition at 258C for 2 days; (ii) same as sample 1 but with 10% (w/w) seed; (iii) sample 1 sub-sequently stirred for 0.77 h; (iv) sample 2 subsub-sequently stirred for 1.1 h; (v) sample 1 subsequently stirred for 2.2 h; (vi) sample 1 subsequently stirred for 4.6 h; (vii) sample 2 subsequently stirred for 4.2 h; (viii) sample 1 subsequently stirred for 10.8 h; (ix) sample 2 subsequently stirred for 9.8 h; (x) sample 1 subsequently stirred for 23 h; (xi) sample 1 subsequently stirred for 30 h; (xii) sample 2 subsequently stirred for 25 h.
Tapping-mode atomic force microscopy image acquisition The long-straight b2m fibrils were deposited onto freshly cleaved mica surfaces. To ensure optimum surface coverage and dispersion of fibrils, each sample was diluted to 0.4mM (monomer equivalent concentration) with sterile-filtered deionised water immediately before a 20ml drop was depos-ited onto the mica surface. For each sample, the surface was incubated with the sample for 5 min before washing with 1 ml sterile-filtered deionised water and drying under a gentle stream of N2gas. The samples were imaged using a Dimension 3100 Scanning Probe Microscope (Veeco Instruments) and PPP-NCLR silicon cantilever probes (Nanosensors, Neuchatel, Switzerland) with nominal force constant of 48 N/m. Height images of 10241024 pixels in size, covering surface areas of 1010mm, were acquired under ambient environmental conditions. The acquisition of images with large size is aimed to reduce the relative number of fibrils that are cut off by image boundaries and increase the number of fibrils that can be traced on each image. Images were processed using supplied software NanoScope 6.13r1 to remove sample tilt and scanner bow before analysis.
Analysis of fibril length and height
The AFM images were analysed using automated scripts written in Matlab (Mathworks). To ensure objective analysis, fibril particles suitable for analysis were traced automatically from each image using the following criteria: (i) fibrils must
lie entirely within the boundaries of the image; (ii) fibrils must be unambiguously traceable by the scripts in a way that is unaffected by any overlapping fibrils; and (iii) fibrils must be 2 pixels or more in length (after the apparent width of fibrils on images caused by cantilever tip convolution has been taken into account). The length and the height along the highest ridge of each fibril were subsequently extracted for fibrils that were unambiguously traced by the scripts.
Acknowledgements
We thank the members of the Radford and the Homans groups for helpful comments. We would also like to thank Neil Thomson for critical reading of the manuscript and Simon Connell for technical help with AFM.
Funding
This study was funded by the Wellcome Trust grant no. 075675. Funding to pay the Open Access publication charges for this article was provided by the Wellcome Trust.
References
Bernacki,J.P. and Murphy,R.M. (2009)Biophys. J.,96, 2871 – 2887. Carulla,N., Caddy,G.L., Hall,D.R., Zurdo,J., Gairi,M., Feliz,M., Giralt,E.,
Robinson,C.V. and Dobson,C.M. (2005)Nature,436, 554 – 558. Chiti,F. and Dobson,C.M. (2006)Annu. Rev. Biochem.,75, 333 – 366. Collins,S.R., Douglass,A., Vale,R.D. and Weissman,J.S. (2004)PLoS Biol.,
2, e321.
Colvin,V.L. (2003)Nat. Biotechnol.,21, 1166 – 1170. Ferrone,F.A. (1999)Methods Enzymol.,309, 256 – 274.
Gosal,W.S., Morten,I.J., Hewitt,E.W., Smith,D.A., Thomson,N.H. and Radford,S.E. (2005)J. Mol. Biol.,351, 850 – 864.
Hill,T.L. (1983)Biophys. J.,44, 285 – 288.
Kad,N.M., Thomson,N.H., Smith,D.P., Smith,D.A. and Radford,S.E. (2001)
J. Mol. Biol.,313, 559 – 571.
Knowles,T.P., Fitzpatrick,A.W., Meehan,S., Mott,H.R., Vendruscolo,M., Dobson,C.M. and Welland,M.E. (2007)Science,318, 1900 – 1903. Lynch,I., Dawson,K.A. and Linse,S. (2006)Sci. STKE,2006, e14.
Press,W.H. (2002) Numerical Recipes in Cþþ: The Art of Scientific Computing, 2nd edn. Cambridge University Press, Cambridge, New York, UK.
Smith,A.M., Jahn,T.R., Ashcroft,A.E. and Radford,S.E. (2006a) J. Mol. Biol.,364, 9 – 19.
Smith,J.F., Knowles,T.P., Dobson,C.M., Macphee,C.E. and Welland,M.E. (2006b)Proc. Natl Acad. Sci. USA,103, 15806 – 15811.
Sun,Y., Makarava,N., Lee,C.I., Laksanalamai,P., Robb,F.T. and Baskakov,I.V. (2008)J. Mol. Biol.,376, 1155 – 1167.
Sunde,M., Serpell,L.C., Bartlam,M., Fraser,P.E., Pepys,M.B. and Blake,C.C. (1997)J. Mol. Biol.,273, 729 – 739.
Tanaka,M., Collins,S.R., Toyama,B.H. and Weissman,J.S. (2006) Nature, 442, 585 – 589.
van Raaij,M.E., van Gestel,J., Segers-Nolten,I.M., de Leeuw,S.W. and Subramaniam,V. (2008)Biophys. J.,95, 4871 – 4878.
Weibull,W. (1951)J. Appl. Mech. Trans. ASME,18, 293 – 297.
White,H.E., Hodgkinson,J.L., Jahn,T.R., Cohen-Krausz,S., Gosal,W.S., Muller,S., Orlova,E.V., Radford,S.E. and Saibil,H.R. (2009)J. Mol. Biol. Xue,W.-F., Homans,S.W. and Radford,S.E. (2008) Proc. Natl Acad. Sci.
USA,105, 8926 – 8931.
Received May 27, 2009; revised May 27, 2009; accepted June 3, 2009


![Fisheries and aquaculture in Europe [Newsletter] August 2007 No 35](data:image/gif;base64,R0lGODlhAQABAIAAAP///wAAACH5BAEAAAAALAAAAAABAAEAAAICRAEAOw==)