PROJECT COMPLETION REPORT
FOR
(SHORT TERM) RESEARCH GRANT
PERFORMANCE ANALYSIS OF MECHANICAL
PROPERTIES AND WELDMENT AREA OF ALUMINIUM
ALLOYS
Principal Researcher : DR. AHMAD KAMELY BIN MOHAMAD
Co-Researchers : Johny Purnomo Joewono (FKP)
Project Code No. : PJP/2009/FKP(12A)S580
Report Submission Date : 4 July 2013
ABSTRACT
PERFORMANCE ANALYSIS OF MECHANICAL PROPERTIES AND WELDMENT AREA OF ALUMINIUM ALLOYS
(Keywords : MIG robot welding, Aluminium, Mechanical properties, Response Surface Methodology)
The industrial revolutions of welding process cause welding applied in almost every operation that involves fabricating in manufacture. The increasing usage of aluminium for new technology has stimulated considerable interest in the development of improved aluminium alloys. The quality of welding can influence by many factors e.g. current, velocity, flow rate, etc. Aluminium welding still represents a critical operation due to his complexity and the high level of defect that can be produced in the joint. Aluminium has several chemical and physical properties that need to be understood when using the various joining processes. For designers and technologist are the greatest challenge to weld aluminium and its alloys, it caused aluminium alloys differ from conventional material like steel.
Therefore, it is necessary to find the optimum welding parameters to produce quality welding by analyzing the mechanical properties and microstructure of weldments area. Metal Inert Gas Robot welding is used in this study. From this study, it is found that good quality welding with the used of high current and high voltage. It was observed that the bending strength increased with the used of high current and high voltage (161086 Mpa). In the other hand the results also show very high ultimate tensile strength values of 1798.74 Mpa obtained with the used of high current (190 A) and high voltage (19 V).
Key Researchers:
DR. Ahmad Kamely bin Mohamad En. Johny Purnomo Joewono
E-mail : kamely@utem.edu.my Tel. No. : 06-3316488
Vote No. : PJP/2003/FKP(12A) S580
ACKNOWLEDGEMENT
First and foremost, I would like to thank Universiti Teknikal Malaysia Melaka and the Ministry of Science, Technology and Innovation Malaysia for their financial support through the short term grant funding vote no. PJP/2009/FKP(12A)S580, which has enabled the purchase of some necessary research materials. Finally, I would also like to express my sincere appreciation to all who has helped me in one-way or another, but whose names are not mentioned including all the technicians in Welding Workshop, Materials Science Laboratory, and Metrology Laboratory.
TABLE OF CONTENTS
CHAPTER TITLE PAGE
ABSTRACT 1
ACKNOLEDGEMENTS 2
1.0 INTRODUCTION 7
1.1. Background 7
1.2. Problem Statement 7
1.3 Objectives of the study 8
1.4 Scope of Study 8
2.0 LITERATURE REVIEW 9
3.0 RESEARCH METHODOLOGY 12
3.1 Welding Machine 13
3.1.1 Welding Parameter 13
3.2 Tensile Strength Test 13
3.3 Bending Strength Test 14
3.4 Characterization of Micro Structural 15
3.5 Response Surface Methodology 16
4.0 RESULTS AND DISCUSSIONS 17
4.1 Welding Bead Penetration 17
4.2 Mechanical Properties of Weldment Area 18
4.2.1 Tensile and Bending Strength 18
4.2.2 Hardness Test 20
4.3 Microstructure Analysis of Heat Affected Zone (HAZ) 21 4.4 Mathematical Modeling of the Weldment Area Strength 22
4.5 Optimization 24
4.6 Model Validation 27
5.0 SUMMARY AND CONCLUSIONS 29
REFERENCES 30
LIST OF FIGURES
FIGURE NO. TITLE PAGE
2.1 Emerging Growth Opportunities for Aluminium
Welding (World) 2009 (Chauhan, 2009) 4
3.1 Schematic diagram of experimental setup 3.2 MIG Robot Welding 29
3.3 Standard Tensile Test specimen according to ASTM standards
(B-557M-02) (ASTM 2002a) 31
3.4 Tensile Test Machine 31
3.5 Universal Testing Machine 32
3.6 Optical Microscopy 33
4.1 The effect of welding current and arc voltage on bead
penetration 3
4.2 Condition 190A; 19v, 15 mm/min. Depth of Penetration,
P = 6.46 mm 40
4.3 Condition 170 A; 19 v, 15 mm/min. Depth of Penetration,
P = 2.28 mm 40
4.4 The effect of welding current and arc voltage on Tensile
Strength 44
4.5 The effect of welding current and arc voltage on Bending
Strength 47
4.6 The cross section showed a certain amount of pores 4.7 Hardness distributions in the weldments area
4.8 Microstructure of weldment area (200X) 53
4.9 OFAT plots after experimenting on factor A 4.10 OFAT plot for factor B
4.11 Response surface plot showing the effect of current and voltage on the tensile strength.
LIST OF TABLES
TABLE NO. TITLE PAGE
4.1 Experimental Result of Tensile Strength Test 22
4.2 Sequential model Sum of Squares 23
4.3 Lack of Fit Test 23
4.4 The ANOVA Analysis of Tensile Strength 23
4.5 Validation of tensile strength Test Result 28 4.6 Validation of bending strength test result 28
1.0 INTRODUCTION
1.1 Background
The industrial revolutions of welding process cause welding applied in almost every operation that involves manufacture with the fabrication process (Messler, 1996). Welding is the process of merging two or more materials using filler or not by heating them to temperatures of welding by using pressure or not (Jeffus, 1997). The quality of welding can be influenced by many factors such as current, velocity, flow rate, and etc. (Meran, 2006).
The increasing usage of aluminium for new technology has stimulated considerable interest in the development of improved aluminium alloys (Tanner & Robinson, 2003; Chen et al., 2003; Zander & Sandström, 2009). The significant aspect to weld aluminium is the chemical composition of weld bead and the combination between parent material and filler composition. Aluminium welding still represents a critical operation due to his complexity and the high level of defect that can be produced in the joint (Maggiolino & Schmid, 2008).
1.2 Problem Statement
Aluminium has several chemical and physical properties that need to be understood when using the various joining processes (Maggiolino & Schmid, 2008). Generally aluminium alloys have a low melting point (Park et al. 2008) and sensitive to solidification and liquation cracks (Gupta & Murty, 2006). Therefore, it is necessary stringent process control in order to achieve good quality results.
With the increasing of automation in arc welding, to satisfy a bead quality need to be specified the selection of welding procedure (Kim, 2003). Mathematical models need to be developed to make effective use of automated or robotic arc
welding (Kim, Son, Yang, et al. 2003). Automated welding and robotic welding can be effectively used by developing mathematical modeling (Correia et al., 2005). The survey reveals the high level of interest in the adaptation of Response Surface Methodology (RSM) to predict responses and to optimize the welding process. Therefore, it is necessary to find the optimum welding parameters to produce good quality welding
1.3 Objectives
The objectives of the research are as follows:
a) To study the effect of different welding parameter setting (current and voltage) on the mechanical properties (tensile strength, bending strength and hardness) of Aluminium Alloys 6064 weldments area.
b) To analyze the microstructure of Fusion Zone (FZ) and Heat Affected Zone (HAZ) on weldments area.
c) To study the correlation between welding parameter (current and voltage) and mechanical properties by using RSM.
1.4 Scope of Study
a) The materials used are aluminium Alloys 6064 b) MIG robot welding
c) The mechanical properties of the joints are evaluated using a combination of conventional tensile test, bending test and hardness test.
d) The micro structural characteristics of the welds are evaluated using optical microscopy and Scanning Electron Microscopy (SEM).
e) This study will analyze the effect of weldments using a RSM. f) The welding parameters being study are current and voltage.
2.0 LITERATURE REVIEW
Aluminium is a very strong ferrite stabilizer (Norton, 2006). Alumunium alloys have lower melting point than steel (Luijendijk, 2000) and sensitive solidifications and liquations cracks (Gupta & Murty, 2006). Aluminium alloy 6064 has good machinability and high mechanical properties and has a good resistance to corrosion and suitability to hard, protective and decorative anodizing.
[image:10.595.170.427.335.533.2]In the recent years, uses of aluminium in several industries will increase and it increases opportunities in aluminium welding (Figure 2.1) and have replaced conventional materials in the automotive world because it is lightweight (Praveen & Yarlagadda, 2005).
Figure 2.1 Emerging Growth Opportunities for Aluminium Welding
Aluminium alloys series' primary are choice to reduce weight and extensively used in many applications such as pipeline, marines frames, storage tanks, automotive industries, high performance building and aircraft applications (Sayer et al., 2008; Elangovan et al., 2009; Elangovan & Balasubramanian, 2008; Praveen et al., 2006). The specific mechanical strength and corrosion resistance make important advantage between aluminium alloys and the other structural alloys (Lean, 2003). Aluminium alloys series primary are choice to reduce weight and extensively used in many
applications such as pipeline, marines frames, storage tanks, automotive industries, high performance building and aircraft applications. The specific mechanical strength and corrosion resistance make important advantage between aluminium alloys and the other structural alloys (Lean, 2003).
Heat treatable wrought aluminium–magnesium–silicon alloys conforming to AA6061 are of moderate strength and possess excellent welding characteristics over the high strength aluminium alloys (Thomas et al., 1995). The microstructure of the welded joint is formally divided into three zones: heat affected (HAZ), thermomechanically affected (TMAZ) and stirred zone (Lomolino et al., 2005). Bussu & Irving, (2003) in their study of friction stir welded 2024-T351 aluminium joints found that crack propagation behaviour was sensitive to both weld orientation and the distance of the crack from the weld line. In addition the Growth rates both faster and slower than in the parent material were observed, depending on the crack orientation and distance from the weld (Bussu & Irving, 2003) .
Weld fusion zones typically exhibit coarse columnar grains because of the prevailing thermal conditions during welding metal solidification. This often results in inferior weld mechanical properties and poor resistance to hot cracking. It is thus highly desirable to control solidification structure in welds and such control is often very difficult because of higher temperatures and higher thermal gradients in welds in relation to castings and the epitaxial nature of the growth process. Nevertheless, several methods for refining weld fusion zones have been tried with some success in the past: inoculation with heterogeneous nucleants, microcooler additions, and surface nucleation induced by gas impingement and introduction of physical disturbance through techniques such as torch vibration (Balasubramanian et al., 2007).
The fatigue life of friction welded joints was poorer than in as-received base material. In alloy 6061/alloy 6061 joints, fatigue failure initiated in the softened heat-affected-zone region. In metal matrix composite joints, fatigue failure initiated at the bond line region (Zhou et al., 1997) The relationship between joining parameter settings, the tensile and torsional strength properties of inertia friction welded alloy 6061 tubing containing 10 vol% Al2O3 particles have been examined (Cola, 1992;
Cola & Baeslack n.d.,1992). Welded joints have been investigated and compared in terms of their microstructures, mechanical properties and hardness and FSW have
yielded the best mechanical properties (Yeni et al., 2009). The loss of both alloying elements reduces the effect of hardening and results in the reduction of tensile strength and ductility.
3.0 METHODOLOGY
Figure 3.1 Schematic diagram of experimental setup
3.1 Welding Machine
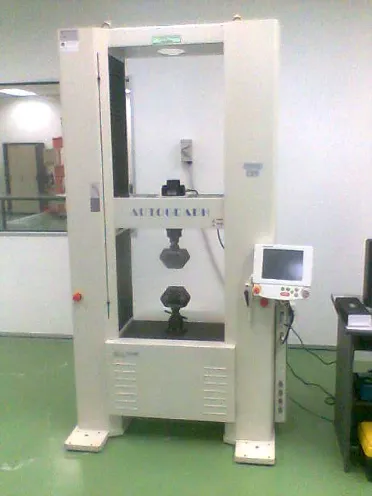
[image:14.595.188.407.174.337.2]The experiment is conducted by using MIG robot welding DR 4000 series (Figure 3.2). Robot welding was chosen because it can perform repetitive weld and welding speed is consistent.
Figure 3.2 MIG robot welding DR 4000 series
3.1.1 Welding Parameters
Filler wire ER 4043 with diameter 1 mm is used, the welding speed 15 mm/min and shielding gas is pure argon (99%) with flow rate 15 lit/min. The current between 170-190 Ampere and the voltage variations were 16-20 volt. Welding speed and torch angle are kept constant.
3.2 Tensile Strength
The tensile tests were carried out using ASTM standards (B-557M-02) (Figure 3.3) and evaluation of the mechanical properties of the joints obtained in the different welding parameter were done using Trapezium 2 software. The test was conducted using Universal Testing Machine (Figure 3.4). The force was reset to zero before the test start. The purpose of this test is to investigate the tensile strength and yield strength. The test provides data of the weldment ductility. The maximum stress
obtained from the test result will be analyzed to determine the effect of welding parameter on the weldment structure.
Figure 3.3 Standard tensile specimen according to ASTM standards (B-557M-02)
Figure 3.4 Tensile Test Machine
3.3 Bending Strength Tests
The test was conducted using Universal Testing Machine (Figure 3.5) according to ASTM standards (E-290-02). The force was reset to zero before the test start. The mechanical properties of the joints of the different welding parameter were evaluated and analysis was done by using trapezium 2 software.
[image:15.595.205.391.252.500.2]Figure 3.5 Universal Testing Machines
3.4 Characterization of Micro Structural Change
For subsurface analysis, samples were preserved at each test. Once test samples were sectioned by wire EDM, they were mounted in a thermosetting polymer resin, Buehler Epomet molding compound such that the subsurface microstructures could be examined. This material is particularly suited for hard metal samples, where edge rounding is a problem. The samples were then rough grinding manually with a progressively grit paper start from 2000 to 4000 grit paper. Fine polishing was then performed using Supreme Polycrystalline Diamond Suspension, 2 μm and finally with alumina slurry 1 μm grit size. After polishing, samples were etched with chemical solution for 5 seconds and finally viewed with an optical microscope and SEM for further microstructural analysis. The microstructure and the phase composition were investigated using Optical Microscopy, SEM and X-Ray diffraction.
Figure 3.6 Optical Microscopy
3.5 Response Surface Methodology
Response surface methodology is used to model, analyzes the data and predict the mechanical properties (tensile strength and bending), the model was checked by ANOVA technique. This method can provide 99% of confidence level (Balasubramanian, Jayabalan & Balasubramanian, 2007; Balasubramanian, 2008a)
4.0 RESULTS AND DISCUSSION
4.1 Welding Bead penetration
[image:18.595.159.456.321.482.2]Figure 4.1 shows the relationship between current and voltage that affected the penetration. Penetration increased with the increased in current. The depth of penetration values decreased with the decreased in current. The good 6.46 mm penetration was obtained at 190 A, 19 V condition and the worse was 2.28 mm penetration at 170 A, 19 V condition (Figures 4.2 to 4.3). Generally, the depth of penetration varies which depend on the combination of the current and voltage.
[image:18.595.225.388.551.667.2]Figure 4.1 The effect of welding current and arc voltage on bead penetration
Figure 4.2 Condition 190 A, 19 v, 15 mm/min. Depth of Penetration = 6.46 mm
Figure 4.3 Condition 170A, 19v, 15 mm/min. Depth of Penetration = 2.28 mm
According to Jayaraman et al. (2009), better penetration, high heating rate and right welding profile are the contributing factors that affect the quality of welding joint. The welding defects influence the tensile strength and fracture of the joints and the heat input determined the quality of joining. These are influenced by welding parameters such as welding current, arc voltage, welding speed and protective gas parameters (Kim et al., 2003; Ankara and Ozturk, 1997; Ates and Turker, 1999).
4.2 Mechanical Properties of Weldment Area
4.2.1 Tensile and Bending Strength
Figure 4.4 shows the effect of welding current and arc voltage on Tensile Strength. The highest tensile strength is achieved by using 190 A, there is a significant increment as the voltage increased from 17 v to 19 v. The same phenomenon was also observed by the use of electric current 180 A, but the different result was obtained by the use of electric current 170 A, in which a significant decrease in tensile strength when the voltage increased from 17 v to 19 v.
Figure 4.4 The effect of welding current and arc voltage on Tensile Strength
[image:20.595.146.471.455.630.2]Figure 4.5 shows the effect of welding current and arc voltage on bending strength. The relationship between bending strength and parameter involved in robot welding is related to heat input that produce the penetration of weldment area, increase of current and voltage will increase the bending strength (180 A and 190 A; voltage 17-19v), in the other hand, the tensile strength decreased with increasing voltage and current which is between 100582.96 Mpa to 82001.91 Mpa.
Figure 4.5 The effect of welding current and arc voltage on bending strength
The results showed that the bending strength increased with the increase in current and voltage (Figure 4.6). The use of low current and low voltage produces lack of fusion which gives poor adhesion of the weld bead to the base metal. Rampaul & Hoobasar, (2003) found that the cause of incomplete penetration is due to the defects occurred when the welding procedures are not adhered to; possible causes include the current setting, arc length, electrode angle, and electrode manipulation.
[image:21.595.206.427.278.418.2]The cross-sections show a certain number of pores occurred and this is mainly disturbance in the welding process due to the fusion caused in metal inert gas (MIG) robot welding.
Figure 4.6 The cross section showed a certain amount of pores
4.2.2 Hardness Test
Figure 4.7 shows the variation of Vickers hardness measured at 0.5mm distance range on one side with a distance of 0-5 mm from the weld center line and from that figure shown the decreasing hardness in the HAZ region. The optimum hardness at HAZ is achieved with 180A and 19v. Kumar et al. (2009) also reported the decreasing hardness in the HAZ region that caused by heat input below the temperature reversion has made precipitate not return to its original shape when the solidification.
Figure 4.7 Hardness Distributions on the Weldments Area
4.3 Analysis of Microstructure of Heat Affected Zone (HAZ)
The microstructures of aluminium alloys 6064 joints are exhibited in the micrographs in Figure 4.8 and it is showing a columnar solidification structure close to the fusion line was also reported in studies by Hu (2004). Figure 4.8also shown the precipitates which occur because the solubility of alloying elements exceeded at the lower temperature when it solidifies. The heat input caused the precipitation of aluminium alloys 6064; the precipitation induces the depletion zone at the adjacent grain boundary. Balasubramanian, Ravisankar & Reddy (2008) reported the simple aging treatment applied to the joints caused noticeable changes in the formation of precipitates and their distribution.
Figure 4.8 Microstructure of weldment area (200X)
4.4 Mathematical Modeling of the Weldment Area strength
The analysis of RSM is conducted by using Design Expert version 7.03 software packages. The analysis involves Analysis of Variance (ANOVA), interpretation lack of fit and the sequential model sum of squares. The experimental result of tensile strength is presented in Table 4.1below.
Table 4.1 Experimental Results of Tensile Strength Test Run Current (A) Voltage (V) Tensile Strength
(Mpa)
1 170 20 893.75
2 180 15 609.375
3 180 18 1462.5
4 194 18 2334.38
5 170 16 1796.88
6 190 20 1615.63
7 180 18 1578.13
8 180 18 2034.38
9 180 18 1034.38
10 180 18 1271.88
11 190 16 1468.75
12 180 21 2034.38
13 166 18 1506.25
[image:23.595.159.440.420.701.2]From the sequential model sum of squares and lack of fit test it showed that the 2 factor Interactions (2FI) is suggested do describe the relationship between current and voltage.
Table 4.2 Sequential Model Sum of Squares
Source Sum of
squares df Mean Square F value
p-value Prob>F
Mean vs Total 29673517.05 1 29673517.05
Linear vs Mean 529028.6698 2 264514.3349 1.161990354 0.3518
2FI vs Linear 275630.25 1 275630.25 1.239865064 0.2944
Quadratic vs 2FI 355065.44 2 177532.72 0.755139609 0.5047 Cubic vs
Quadratic 1010928.885 2 505464.4425 3.981505101 0.0924
Residual 634765.5342 5 126953.1068
Total 32478935.83 13 2498379.679
Table 4.3 Lack of Fit Test
Source Sum of
Squares df Mean Square F Value
p-value Prob>F
Linear 1717296.222 6 286216.0369 2.047713583 0.2543
2FI 1441665.972 5 288333.1943 2.062860645 0.2514
Quadratic 1086600.532 3 362200.1772 2.591337057 0.1901
Cubic 75671.6467 1 75671.6467 0.541387759 0.5027
Pure Error 559093.8875 4 139773.4719