O R I G I N A L
R E S E A R C H
Composition of volatile compounds in bovine milk heat
treated by instant infusion pasteurisation and their
correlation to sensory analysis
A N N I B H O U G A A R D , J A N N I E S V E S T E R G A A R D , C A M I L L A VA R M I N G ,
W E N D E R L P B R E D I E and R I C H A R D H I P S E N *
Department of Food Science, Faculty of Life Sciences, University of Copenhagen, Rolighedsvej 30, DK-1958 Frederiksberg C, Denmark
*Author for
correspondence. E-mail: [email protected]
2010 Society of Dairy Technology
Volatile compounds in skim milk and nonstandardised milk subjected to instant infusion pasteurisa-tion at 80C, 100C and 120C were compared with raw milk, high temperature short time pasteur-ised milk and milk pasteurpasteur-ised at 85C⁄30 s. The composition of volatile compounds differed between infusion pasteurisation treated samples and the reference pasteurisations. The sensory prop-erties of skim milk subjected to instant infusion pasteurisation were described by negative attributes, such as cardboard sour and plastic flavours, which are not associated normally with fresh milk. Partial least squares modelling showed good correlation between the volatile compounds and the sensory properties, indicating the predictive and possible causal importance of the volatile com-pounds for the sensory characteristics.
Keywords Milk, Instant infusion pasteurisation, Volatile compounds, Descriptive sensory analysis.
I N T R O D U C T I O N
Heat treatment of milk is normally performed to provide microbiological inactivation, and thereby ensure consumer safety and prolong the shelf life. A standard treatment is high temperature short time (HTST) pasteurisation with the minimum require-ments of holding the milk at 72C for 15 s.
Heat treatment is known to cause changes in the flavour of milk and one of the factors contributing to this is changes occurring in the composition of vola-tile compounds. The degree of this change is related to the intensity of heat treatment (Calvo and de la Hoz 1992). The content of several ketones, alde-hydes and sulphur compounds has been reported to increase when the intensity of heat treatment is increased, e.g. from pasteurisation to ultra high tem-perature (UHT) treatment or in-bottle sterilisation (Contariniet al.1997; Contarini and Povolo 2002). Increasing the intensity of heat treatment by chang-ing the time and⁄or temperature of a certain process-ing method may provide less pronounced changes in the composition of volatile compounds (Bassette and Jeon 1983; Valeroet al.2000).
Heat treatment by direct steam infusion is char-acterised by high heating and cooling rates and
short holding times, and as applied in the Pure-Lac (Elopak, Spikkestad, Norway and SPX APV) process, it has been reported to provide improved shelf-life and increased freshness, sweet-ness and general acceptance in comparison with pasteurised milk (Fredsted et al. 1995). The flash cooling, applied in direct heat treatment technolo-gies to remove the excess water added as steam during heating, has an additional deodourising effect, which may reduce the content of some vola-tile compounds in the products (Bassette and Jeon 1983; Fredsted et al.1995; Contarini et al. 1997; Edmond 2001). Based on these findings, it is sug-gested that heat treatment of milk using instant infusion at temperatures in the range from 80C to 120C would provide a gentle pasteurisation where some of the flavour attributes of unprocessed raw milk is preserved also during storage, i.e. resulting in milk with a fresh taste compared with standard pasteurisation methods.
The aim of this study was thus to describe the differences in composition of volatile compounds induced by instant infusion pasteurisation (IIP) of milk in comparison with raw milk, HTST pasteuri-sation and a more intensive pasteuripasteuri-sation at 85C⁄
30 s. Furthermore, it was the aim to study the
Archived
at
sensory characteristics of IIP milk, focusing on characteristics related to freshness after storage and compared with the two latter mentioned pasteurisa-tion methods. In addipasteurisa-tion, the correlapasteurisa-tion between composition of volatile compounds and descriptive sensory analysis of skim milk samples subjected to IIP, HTST and the 85C⁄30 s pasteurisation was investigated.
M AT E R I A L S A N D M E T H O D S
Heat treatment of milk
Two batches of milk were obtained on two consec-utive days from a Danish dairy factory (Rødkærs-bro Mejeri, Arla Foods, Rødkærs(Rødkærs-bro, Denmark). Batch 1 constituted 3000 L of skim milk, which had not been heat treated, but had been microfil-trated (membrane pore size 1.4lm) in connection with the skimming process. Batch 2 was 3000 L of raw, nonstandardised (NSTD) milk. Both skim milk and NSTD milk were heat treated in a pilot scale instant infusion plant (SPX APV, Silkeborg, Denmark) with a flow of 500 L⁄h, using a holding time of 0.2 s and treatment temperatures 80C (IIP 80), 100C (IIP 100) and 120C (IIP 120). Milk samples were aseptically packed in plastic bags consisting of a nylon foil laminate with an inner layer of polyethylene (Rapak, Rugby, UK). Two reference treatments were applied; HTST pas-teurisation at 72C for 15 s, and a more intensive pasteurisation at 85C for 30 s (85C⁄30 s), both treatments performed in a pilot scale plate heat exchanger (SPX APV). The reference samples were drawn under laminar air flow into sterile polyethylene terephthalate bottles (Grathwol A⁄S, Karlslunde, Denmark). A sample of the raw skim milk and NSTD milk was collected in polyethylene terephthalate bottles as well. All samples were cooled and stored at 5C until further handling.
All milk samples were transferred to 250 mL polyethylene bottles (Plastiques Gosselin, Haz-ebrouck Cedex, France) before freezing or further refrigerated storage. Samples of fresh milk were fro-zen at)45C on day 2 after heat treatment for skim milk samples, and on day 1 after heat treatment for the fresh NSTD milk samples. To investigate the effect of storage, samples of both milk types were stored at 5C until day 7 after heat treatment and subsequently at)45C until further analysis.
Dynamic headspace sampling of volatile com-pounds
Milk samples were thawed at 5C overnight. 150 g of milk were weighed into a 1 L purge bottle and
1 mL of internal standard was added (50 ppm 4-methyl-1-pentanol). A magnet was added before attachment of a purge head with a Tenax-TA trap containing 250 mg of Tenax-TA with mesh size of 60⁄80 and density 0.37 g⁄mL (Buchem bv, Apeldoorn, The Netherlands). The bottles were placed in a temperature controlled waterbath at 40C on magnetic stirrers with a stirring speed of 200 rpm. Temperature equilibration was done for 10 min before turning on nitrogen flow. The sam-ples were purged for 1 h by purging above the sample with a nitrogen flow of 100 mL⁄min. After purging, 10 min of dry purging was performed, blowing nitrogen backwards through the trap at 50 mL⁄min to remove excess water trapped due to the relatively high temperature used during sam-pling. The traps were stored at refrigeration tem-perature until further analysis.
Gas chromatography–mass spectrometry (GC–MS) analysis
The collected volatile compounds were thermally desorbed using an automated thermal desorber (ATD 400; Perkin Elmer, Norwalk, CT, USA). The trap was heated to 250C, and desorption time to the cold trap (5C, 30 mg Tenax-TA; Buchem bv, Apeldoorn, The Netherlands) was 15 min, with a helium flow of 60 mL⁄min. The volatile com-pounds were desorbed from the cold trap to the GC-column by flash heating from 5C to 300C, using a split ratio of 1:10. Separation and identification of aroma compounds were performed on a Hewlett-Packard (Palo Alto, CA, USA) G1800A GC–MS system equipped with a J&W Scientific DB-Wax (J&W Scientific, Inc., Folsom, CA, USA) capillary column (30 m· 0.25 mm internal diameter, 0.25lm film thickness) using helium as carrier gas (1 mL⁄min). The column temperature was kept at 45C for 10 min, increased with 6C⁄min to 240C, and kept isothermal for 10 min. The mass selective detector used the electron ionisation mode at 70 eV, and the mass⁄charge (m⁄z) range between 15 and 300 was scanned. The volatile compounds were identified by interpretation of their ms spectra and comparison with those in the Wiley275.L library (HP product G1035A; Hewlett-Packard, Palo Alto, CA, USA). The software GCD Plus ChemStation G1074B (Version A.01.00; Hewlett-Packard) was used for data analysis. All analyses were carried out in triplicate.
Sensory descriptive analysis
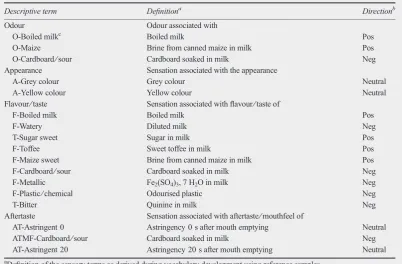
panelists on the skim milk samples IIP 80, IIP 120 (batch 1) and the two reference treatments HTST and 85C⁄30 s. The samples were transferred to 1000 mL polyethylene bottles (unknown producer) immediately after processing, cooled and stored at 5C until further analysis after 7 days of storage. Three training sessions of 2–2.5 h duration were conducted 1 week prior to the evaluation in order to familiarise the assessors with the descriptors and intensity scales. Consensus about descriptors and anchor points of the scales was obtained after thorough discussion of the descriptors, using differ-ent samples as examples and specific references prepared for each descriptor. The 17 descriptors developed comprised three odour, two appearance and 12 flavour terms as shown in evaluation order in Table 1. The intensity of the descriptive terms was scored on an unstructured 15 cm line scale anchored ‘none’ to the left and ‘extreme’ to the right. Samples (50 mL) were evaluated in odour-free jars with lid and tempered to 16C prior to evaluation.
In each of two evaluation sessions the four heat treated samples and two commercial control sam-ples (organic, nonhomogenised skim milk) were
evaluated. The control samples representing a fresh sample (day 1 after milking) and a stored sample (purchased day 1 after milking and stored as the heat treated samples) were included as references on the intensity scale. The serving order of the sam-ples was randomised. All samsam-ples were evaluated in triplicate in a randomised balanced block design.
Data analysis
The effect of treatment on the composition of vola-tile compounds was tested by one-wayANOVAand Duncan’s multiple rangepost hoctest. The analysis was performed inSAS9.1 (SAS Institute, Inc., Cary, NC, USA).
[image:3.595.147.550.394.658.2]Sensory raw data were examined with regard to panel performance. For each session,F-values and MSE-values for each assessor and descriptor were calculated (results not shown). Analyses for panel performance were performed with the open source software Panel Check version 1.3.2 (SourceForge Inc., Mountain View, CA, USA). Overall effects of treatments were analyzed conducting a 3-way ANO-VA (effects of and interactions between assessor, product and replicate) and least significant differ-ence as post hoc test in SPPSversion 17.0 (SPSS
Table 1 List of 17 sensory descriptors used for evaluation of milk presented in evaluation order
Descriptive term Definitiona Directionb
Odour Odour associated with
O-Boiled milkc Boiled milk Pos
O-Maize Brine from canned maize in milk Pos
O-Cardboard⁄sour Cardboard soaked in milk Neg Appearance Sensation associated with the appearance
A-Grey colour Grey colour Neutral
A-Yellow colour Yellow colour Neutral
Flavour⁄taste Sensation associated with flavour⁄taste of
F-Boiled milk Boiled milk Pos
F-Watery Diluted milk Neg
T-Sugar sweet Sugar in milk Pos
F-Toffee Sweet toffee in milk Pos
F-Maize sweet Brine from canned maize in milk Pos F-Cardboard⁄sour Cardboard soaked in milk Neg F-Metallic Fe2(SO4)3, 7 H2O in milk Neg
F-Plastic⁄chemical Odourised plastic Neg
T-Bitter Quinine in milk Neg
Aftertaste Sensation associated with aftertaste⁄mouthfeel of
AT-Astringent 0 Astringency 0 s after mouth emptying Neutral ATMF-Cardboard⁄sour Cardboard soaked in milk Neg AT-Astringent 20 Astringency 20 s after mouth emptying Neutral
a
Definition of the sensory terms as derived during vocabulary development using reference samples.
b
Direction of the descriptor; Pos: positive; Neg: negative.
c
Inc., Chicago, IL, USA). Principal components analysis (PCA) and partial least squares (PLS) modelling were performed in MATLAB R2008a (The Mathworks, Inc., Natick, MA, USA) with the PLS-Toolbox version 5.2.2 (Eigenvector Research, Inc., Wenatchee, WA, USA).
R E S U LT S A N D D I S C U S S I O N
Composition of volatile compounds
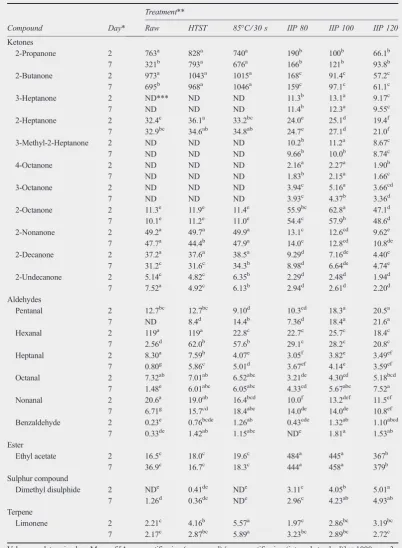
A total of 59 volatile compounds were identified in the milk samples. A total of 20 of these compounds were selected for further data analysis, primarily based on an expectation of contribution to milk fla-vour from reported low threshold values (Burdock 2005). The selected compounds are shown in Tables 2 and 3 for skim milk and NSTD milk, respectively. The remaining compounds mainly constituted of aliphatic and aromatic hydrocarbons and alcohols (data not shown). The majority of the volatile compounds detected in both skim milk and NSTD milk have been reported in one or more stud-ies of milk subjected to different heat treatments, such as pasteurisation, ultrapasteurisation in a steam infusion plant, UHT treatment, or in-bottle sterilisa-tion (Bassette and Jeon 1983; Contariniet al.1997; Valeroet al.2001; Solano Lopezet al.2005).
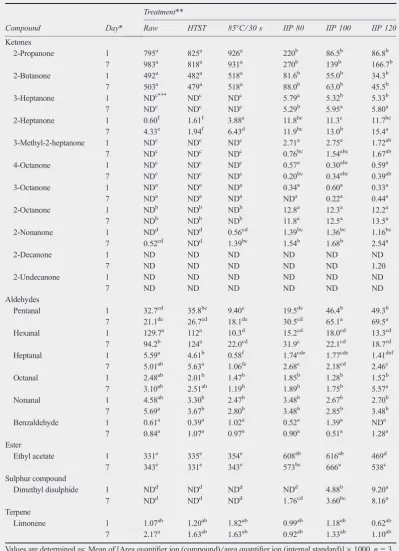
Comparing Tables 2 and 3 shows that 2-deca-none and 2-undeca2-deca-none were only detected in skim milk, and 2-heptanone, 2-octanone and 2-no-nanone were detected in higher amounts in skim milk as compared with NSTD milk. These differ-ences may, at least partially, be due a protective effect of the milk fat against release of volatile compounds from the NSTD milk during the dynamic headspace sampling (Wilkeset al.2000). The content of 2-propanone and 2-butanone in both skim milk and NSTD milk was significantly higher in the reference samples (raw milk, HTST and 85C⁄30 s pasteurised milk) than in the sam-ples subjected to IIP (Tables 2 and 3). This could be due to stripping of volatile compounds during flash cooling, as suggested in other studies (Bas-sette and Jeon 1983; Contarini et al. 1997). This explanation is further corroborated by the tendency, though not significant, of decreasing amounts of 2-propanone and 2-butanone with increasing tem-perature of IIP where the flash effect is enhanced due to the concurrent increased drop in tempera-ture. The alcohols 2-propanol and 2-butanol showed similar tendencies of low amounts or no detection in IIP treated samples, and it may be speculated that they are also stripped during the flash cooling step (data not shown).
The content of ethyl acetate exhibited an opposite effect, with higher content in the IIP treated samples than in the reference samples (Tables 2 and 3). Increased content of ethyl acetate in UHT milk as compared with raw and pasteurised milk was also reported by Vazquez Landaverdeet al.(2005). An explanation for this observation has not been estab-lished, but it has been suggested that ethyl acetate could be formed in milk by a heat catalysed esterifi-cation of ethanol and acetic acid (Vazquez Landav-erdeet al.2005). However, IIP may provide better catalysing effect than the reference treatments due to the direct contact between milk and steam. It could also be considered whether the difference in ethyl acetate level was related to the fact that the milk fat globules are partially disrupted in the IIP treatment, probably due to cavitation during flash cooling (Hougaardet al.2009), leaving the milk fat more susceptible to enzymatic reactions.
Methyl ketones with an odd number of C atoms may be formed during heat treatment of milk by thermal decarboxylation of b-keto acids and have primarily been reported in UHT milk (Badings 1991; Calvo and de la Hoz 1992) or in higher amounts in UHT milk as compared with pasteur-ised and raw milk (Vazquez Landaverde et al.
2005). However, in the skim milk of this study, all methyl ketones were found in lower amounts in the IIP treated samples, with only one exception, 2-octanone, which does not contain an odd number of C atoms, and consequently may be formed by a different reaction. In the NSTD milk, only 2-propa-none and 2-buta2-propa-none were found in lower amounts in the IIP treated samples as compared with the ref-erences. A number of heptanones and octanones were detected in the IIP treated samples, but not in the reference samples.
Several aldehydes were detected both in the ref-erence samples and in the milk subjected to IIP, and the levels of aliphatic aldehydes, except pent-anal, were higher in raw and HTST treated samples than in IIP treated samples, but no clear relation between IIP treatment intensity and amount of aldehydes was observed (Tables 2 and 3).
Table 2 Volatile compounds detected in skim milk samples subjected to different heat treatments
Compound Day*
Treatment**
Raw HTST 85C⁄30 s IIP 80 IIP 100 IIP 120
Ketones
2-Propanone 2 763a 828a 740a 190b 100b 66.1b 7 321b 793a 676a 166b 121b 93.8b
2-Butanone 2 973a 1043a 1015a 168c 91.4c 57.2c
7 695b 968a 1046a 159c 97.1c 61.1c 3-Heptanone 2 ND*** ND ND 11.3b 13.1a 9.17c
7 ND ND ND 11.4b 12.3a 9.55c
2-Heptanone 2 32.4c 36.1a 33.2bc 24.0e 25.1d 19.4f
7 32.9bc 34.6ab 34.8ab 24.7e 27.1d 21.0f
3-Methyl-2-Heptanone 2 ND ND ND 10.2b 11.2a 8.67c
7 ND ND ND 9.66b 10.0b 8.74c
4-Octanone 2 ND ND ND 2.16a 2.27a 1.90b
7 ND ND ND 1.83b 2.15a 1.66c
3-Octanone 2 ND ND ND 3.94c 5.16a 3.66cd
7 ND ND ND 3.93c 4.37b 3.36d
2-Octanone 2 11.3e 11.9e 11.4e 55.9bc 62.8a 47.1d 7 10.1e 11.2e 11.0e 54.4c 57.9b 48.6d 2-Nonanone 2 49.2a 49.7a 49.9a 13.1c 12.6cd 9.62e
7 47.7a 44.4b 47.9a 14.0c 12.8cd 10.8de
2-Decanone 2 37.2a 37.6a 38.5a 9.29d 7.16de 4.40e 7 31.2c 31.6c 34.3b 8.98d 6.64de 4.74e 2-Undecanone 2 5.14c 4.82c 6.35b 2.29d 2.48d 1.94d 7 7.52a 4.92c 6.13b 2.94d 2.61d 2.20d Aldehydes
Pentanal 2 12.7bc 12.7bc 9.10d 10.3cd 18.3a 20.5a
7 ND 8.4d 14.4b 7.36d 18.4a 21.6a Hexanal 2 119a 119a 22.8c 22.7c 25.7c 18.4c 7 2.56d 62.0b 57.6b 29.1c 28.2c 20.8c Heptanal 2 8.30a 7.59b 4.07e 3.05f 3.82e 3.49ef
7 0.80g 5.86c 5.01d 3.67ef 4.14e 3.59ef
Octanal 2 7.32ab 7.01ab 6.52abc 3.21de 4.30cd 5.18bcd 7 1.48e 6.01abc 6.05abc 4.33cd 5.67abc 7.52a Nonanal 2 20.6a 19.0ab 16.4bcd 10.0f 13.2def 11.5ef
7 6.71g 15.7cd 18.4abc 14.0de 14.0de 10.8ef
Benzaldehyde 2 0.23e 0.76bcde 1.26ab 0.43cde 1.32ab 1.10abcd
7 0.33de 1.42ab 1.15abc NDe 1.81a 1.53ab Ester
Ethyl acetate 2 16.5c 18.0c 19.6c 484a 445a 367b 7 36.9c 16.7c 18.3c 444a 458a 379b Sulphur compound
Dimethyl disulphide 2 NDe 0.41de NDe 3.11c 4.05b 5.01a 7 1.26d 0.36de NDe 2.96c 4.23ab 4.93ab Terpene
Limonene 2 2.21c 4.16b 5.57a 1.97c 2.86bc 3.19bc 7 2.17c 2.87bc 5.89a 3.23bc 2.89bc 2.72c
Values are determined as: Mean of [Area quantifier ion (compound)⁄area quantifier ion (internal standard)]·1000,n= 3. Values within one compound without common superscript are significantly different (P< 0.05).
Table 3 Volatile compound detected in nonstandardised milk samples subjected to different heat treatments
Compound Day*
Treatment**
Raw HTST 85C⁄30 s IIP 80 IIP 100 IIP 120
Ketones
2-Propanone 1 795a 825a 926a 220b 86.5b 86.8b 7 983a 818a 931a 270b 139b 166.7b
2-Butanone 1 492a 482a 518a 81.6b 55.0b 34.3b
7 503a 479a 518a 88.0b 63.0b 45.5b 3-Heptanone 1 NDc*** NDc NDc 5.79a 5.32b 5.33b 7 NDc NDc NDc 5.29b 5.95a 5.80a 2-Heptanone 1 0.60f 1.61f 3.88e 11.8bc 11.3c 11.7bc
7 4.33e 1.94f 6.43d 11.9bc 13.0b 15.4a
3-Methyl-2-heptanone 1 NDc NDc NDc 2.71a 2.75a 1.72ab 7 NDc NDc NDc 0.76bc 1.54abc 1.67ab 4-Octanone 1 NDc NDc NDc 0.57a 0.30abc 0.59a
7 NDc NDc NDc 0.20bc 0.34abc 0.39ab
3-Octanone 1 NDa NDa NDa 0.34a 0.60a 0.33a
7 NDa NDa NDa NDa 0.22a 0.44a 2-Octanone 1 NDb NDb NDb 12.8a 12.3a 12.2a 7 NDb NDb NDb 11.8a 12.5a 13.5a 2-Nonanone 1 NDd NDd 0.56cd 1.39bc 1.36bc 1.16bc
7 0.52cd NDd 1.39bc 1.54b 1.68b 2.54a
2-Decanone 1 ND ND ND ND ND ND
7 ND ND ND ND ND 1.20
2-Undecanone 1 ND ND ND ND ND ND
7 ND ND ND ND ND ND
Aldehydes
Pentanal 1 32.7cd 35.8bc 9.40e 19.5de 46.4b 49.3b
7 21.1de 26.7cd 18.1de 30.5cd 65.1a 69.5a Hexanal 1 129.7a 112a 10.3d 15.2cd 18.0cd 13.3cd
7 94.2b 124a 22.0cd 31.9c 22.1cd 18.7cd Heptanal 1 5.59a 4.61b 0.58f 1.74cde 1.77cde 1.41def
7 5.01ab 5.63a 1.06fe 2.68c 2.18cd 2.46c
Octanal 1 2.48ab 2.01b 1.47b 1.85b 1.28b 1.52b 7 3.10ab 2.51ab 1.19b 1.89b 1.75b 5.57a Nonanal 1 4.58ab 3.30b 2.47b 3.48b 2.67b 2.70b 7 5.69a 3.67b 2.80b 3.48b 2.85b 3.48b
Benzaldehyde 1 0.61a 0.39a 1.02a 0.52a 1.39a NDa
7 0.84a 1.07a 0.97a 0.90a 0.51a 1.28a Ester
Ethyl acetate 1 331e 335e 354e 608ab 616ab 469d 7 343e 331e 343e 573bc 666a 538c Sulphur compound
Dimethyl disulphide 1 NDd NDd NDd NDd 4.88b 9.20a 7 NDd NDd NDd 1.76cd 3.60bc 8.16a Terpene
Limonene 1 1.07ab 1.20ab 1.82ab 0.99ab 1.18ab 0.62ab 7 2.17a 1.63ab 1.63ab 0.92ab 1.33ab 1.10ab
Values are determined as: Mean of [Area quantifier ion (compound)⁄area quantifier ion (internal standard)]·1000,n= 3. Values within one compound without common superscript are significantly different (P< 0.05).
Storage of the milk generally had minor impact on the volatiles within the different heat treatments, except from the levels of aliphatic aldehydes in raw skim milk that decreased considerably during storage. Changes in the composition of volatile compounds in ultrapasteurised and UHT treated milk have been investigated by several authors, and generally the content of aldehydes and methyl ketones are found to increase during storage (Rerk-rai et al. 1987; Valeroet al. 2001; Solano Lopez
et al.2005). However, storage at refrigeration tem-perature leads to markedly slower changes (Bas-sette and Jeon 1983; Rerkrai et al. 1987), which may explain the minor effect observed after refrig-erated storage for 7 days.
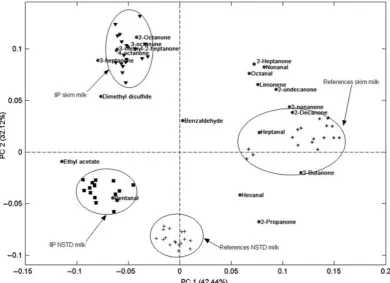
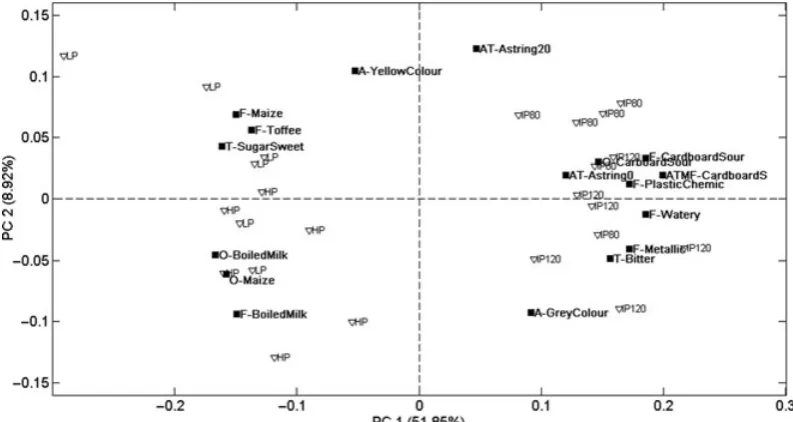
A PCA was performed, including all samples of both skim milk and NSTD milk, and the levels of the 20 volatile compounds. A biplot of the scores and loadings obtained for principal component (PC)1 and PC2, explaining 75% of total variance, is shown in Figure 1, and this plot reveals four distinct groups of samples, separated by milk type (skim milk vs NSTD milk) and applied processing method (IIP vs references) Roughly, it can be said that PC1 separated the IIP treatments from the
reference treatments, and PC2 separated the skim milk from the NSTD milk. No obvious separation of the different heat treatment temperatures was observed, and no effect of refrigerated storage for 7 days could be inferred from the PCA model (sample labels not shown in Figure 1). The observed grouping show that the composition of volatile compounds in IIP treated milk was differ-ent from the composition of volatile compounds in the reference samples. However, the distance was shorter between the two groups of NSTD milk than between the skim milk groups, which may be due to difficulties in releasing the volatile compounds from the milk as discussed above, but it may also indicate that the differences in compo-sition of volatile compounds resulting from the different applied heat treatments were in fact less pronounced for NSTD milk than for skim milk.
[image:7.595.152.543.373.656.2]Sensory properties of IIP treated skim milk The results of the sensory descriptive analysis showed, that 12 of the 17 descriptors were found significant in describing the differences between the four heat treatments (Table 4). The results also showed, that two out of three of the significant
descriptors were describing differences between the heat treatment technologies; the odour of maize (P£0.01) and the odour and flavour of boiled milk (P£0.01 andP£0.001) were all perceived
[image:8.595.149.549.152.381.2]lower for IIP samples than for reference pasteurised samples whereas the watery (P£0.001), card-board sour (P£0.001) and plastic and chemical like (P£0.001) flavours, as well as the cardboard
Table 4 Mean values (over assessor and replicates) of 17 sensory descriptors for each of the four heat treatments
Sensory descriptor
TreatmentA
SignB 85C⁄30 s HTST IIP 80 IIP 120
O-Boiled milkC ** 4.04b 3.85b 2.26a 2.05a
O-Maize ** 4.49b 4.10b 2.61a 2.40a
O-Cardboard⁄sour ** 3.53a 3.62a 6.74b 4.61a
A-Grey colour n.s. 4.89 4.57 5.11 4.99
A-Yellow colour n.s. 3.67 4.09 4.08 3.52
F-Boiled milk *** 4.63b 4.10b 2.84a 2.53a
F-Watery *** 6.33a 5.48a 7.97b 8.23b
T-Sugar sweet * 4.34b 4.57b 3.74ab 3.37a
F-Toffee ** 2.40b 2.65b 1.77ab 1.08a
F-Maize sweet ** 3.39ab 4.05b 3.10ab 2.34a
F-Cardboard⁄sour *** 3.13a 2.91a 5.83b 4.72b
F-Metallic n.s. 3.37 2.66 4.17 4.25
F-Plastic⁄chemical *** 2.71a 2.31a 4.50b 4.67b
T-Bitter * 1.81ab 1.42a 2.33b 2.51b
AT-Astringent 0 n.s. 4.66 4.95 5.51 5.75
ATMF-Cardboard⁄sour *** 2.32a 2.01a 4.39b 4.06b
AT-Astringent 20 n.s. 7.60 7.95 8.47 7.83
A
Treatments: HTST, high temperature short time pasteurisation, IIP, instant infusion pasteurisation at 80C and 120C.
B
Significance levels: n.s., not significant; *P£0.05; **P£0.01; ***P£0.001.
C
Means within a row with the same superscript letter are not significantly different (least significant difference test,P£0.05).
[image:8.595.148.545.444.655.2]sour aftertaste (P£0.001) were perceived higher for IIP samples than for reference pasteurised sam-ples. Bitterness (P£0.05) was perceived higher for IIP samples than for the HTST sample, and a pronounced cardboard sour odour (P£0.01) was found to be perceived higher for the IIP 80 sample than for the other samples. Sweetness related descriptors, i.e. sugar sweet taste (P£0.05) and toffee flavour (P£0.01), were found to be per-ceived lower for the IIP 120 sample than for reference pasteurised samples. Maize sweet flavour (P£0.01) was perceived lower for IIP 120 sample than for the HTST sample.
An overview of the sensory data analyzed by PCA revealed that more than 50% of the total vari-ance in the data was primarily related to the heat treatment technology, separating the reference treat-ments (HTST and 85C⁄30 s) from the IIP treat-ments in PC1 (Figure 2). The sensory descriptors watery flavour, cardboard sour odour, flavour and aftertaste as well as plastic and chemical like
flavour were found to be associated positively with the IIP treatments. The reference treatments resulted in skim milk associating positively with the odours and flavours of boiled milk and maize as well as sugar sweet taste and toffee flavour. In PC2, explaining 9% of total variance, a tendency to sepa-ration of the two temperatures of IIP is found, indi-cating a more pronounced astringent aftertaste (not significant) in samples treated at 80C (Figure 2).
As seen from Table 1, the most pronounced sen-sory characteristics of the IIP treated skim milk are all related to negative descriptors, whereas the sen-sory properties of the reference heat treatments are related to positive descriptors. It can thus be con-cluded, that in comparison with the two reference heat treatments the findings in this study did not support the suggestion based on earlier reports by Fredsted et al. (1995) of IIP treatment preserving sensory characteristics associated to freshness of milk, as freshness is generally regarded as a posi-tive milk property.
Correlation between composition of volatile compounds and sensory properties
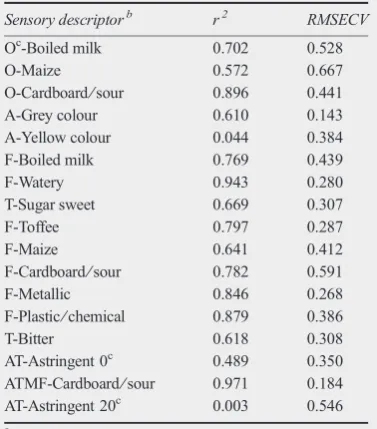
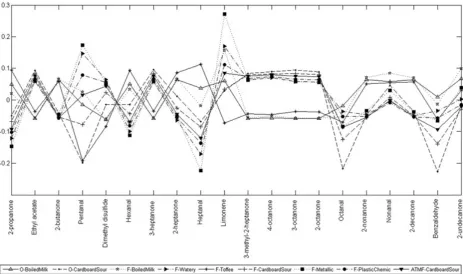
[image:9.595.149.338.428.643.2]A PLS model may be used to evaluate the ability of the composition of volatile compounds to describe the sensory properties of the milk samples. A cross validated PLS2 model with three latent variables was calculated, explaining a total of 92.4% of the variance in the volatile compounds and 79.7% of the variance in the sensory data. Regression coefficients of the cross validated dictions vs measured sensory attributes are pre-sented in Table 5. The regression coefficients were generally high with 9 out of 17 sensory descriptors showingr2values above 0.7, clearly indicating that the composition of volatile compounds in the heat treated milk samples can be used for prediction of the sensory descriptors. The PLS regression vectors for the sensory terms with the highest correlations between predictions and measured values are plot-ted in Figure 3. The regression vectors for boiled milk odour and flavour and for toffee flavour, which were positively correlated to the reference samples in the PCA (Figure 2), are seen to differ substantially in shape from the vectors for the rest of the descriptors (Figure 3), which were positively correlated to the IIP treated samples (Figure 2). For example, for the volatile compounds 2-propanone, ethyl acetate, 2-butanone and 3-heptanone the regression vectors of the sensory terms positively associated with the IIP treated samples points in the opposite direction of the regression vectors of the reference treatments. These results emphasise
Table 5 Regression coefficients (r2) of cross validated prediction vs measured sensory descriptor and RMSECVafor a partial least squares 2 model with three latent variables on skim milk samples subjected to instant infusion pasteurisation at 80C and 120C, high tempera-ture short time pasteurisation and 85C⁄30 s pasteurisa-tion using the content of 20 volatile compounds for prediction
Sensory descriptorb r2 RMSECV
Oc-Boiled milk 0.702 0.528
O-Maize 0.572 0.667
O-Cardboard⁄sour 0.896 0.441 A-Grey colour 0.610 0.143 A-Yellow colour 0.044 0.384 F-Boiled milk 0.769 0.439
F-Watery 0.943 0.280
T-Sugar sweet 0.669 0.307
F-Toffee 0.797 0.287
F-Maize 0.641 0.412
F-Cardboard⁄sour 0.782 0.591 F-Metallic 0.846 0.268 F-Plastic⁄chemical 0.879 0.386
T-Bitter 0.618 0.308
AT-Astringent 0c 0.489 0.350 ATMF-Cardboard⁄sour 0.971 0.184 AT-Astringent 20c 0.003 0.546
a
RMSECV, Root mean square error of cross validation.
b
Sensory descriptors as defined in Table 1.
c
that the composition of volatile compounds was important for the sensory properties, and that the volatile compounds detected in milk subjected to IIP contributed to sensory descriptors that are not associated with freshness of milk.
C O N C L U S I O N S
The composition of volatile compounds in skim milk or NSTD milk subjected to IIP at different temperatures was found to differ from the composi-tion of volatile compounds in raw milk, HTST pas-teurised milk, and milk paspas-teurised at 85C⁄30 s. Separation of milk samples according to milk type (skim or NSTD) and heat treatment technology [References (including raw) and IIP] was obtained when applying principal component analysis on volatile compounds. Based on the current results, it seems highly unlikely that IIP, as previously sug-gested, can provide pasteurisation of milk with preservation of the fresh taste of raw milk. This was confirmed for the skim milk by descriptive sensory analysis, where the IIP treated samples were positively correlated to negative descriptive terms, which can not be associated with freshness. Furthermore, good predictions of the sensory
properties of skim milk were obtained from the composition of volatile compounds in partial least squares analysis.
A C K N O W L E D G E M E N T S
The authors wish to thank the Danish Ministry of Food, Agriculture and Fisheries for financial support through the DARCOFIII programme and the Interna-tional Centre for Research in Organic Food Systems (ICROFS). SPX APV in Silkeborg, Denmark is thanked for providing access to the pilot plant and for excellent technical support, running the pilot plants for the different heat treatments. Laboratory techni-cian Mehdi Darestani Farahani is thanked for support and GC–MS operation for the analysis of volatile compounds.
R E F E R E N C E S
Badings H T (1991) Milk. InVolatile Compounds in Foods and Beverages, pp 91–106. Maarse H, ed. New York, USA: Marcel Dekker, Inc.
[image:10.595.87.551.62.336.2]Bassette R and Jeon I J (1983) Effect of process-times and storage-times and temperatures on concentrations of vola-tile materials in ultra-high-temperature steam infusion pro-cessed milk.Journal of Food Protection46950–953.
Burdock G M (2005)Fenaroli’s handbook of flavour ingredi-ents, 5th edn. Boca Raton, USA: CRC Press.
Calvo M M and de la Hoz L (1992) Flavour of heated milks. A review.International Dairy Journal269–81.
Contarini G and Povolo M (2002) Volatile fraction of milk: comparison between purge and trap and solid phase mic-roextraction techniques.Journal of Agricultural and Food Chemistry507350–7355.
Contarini G, Povolo M, Leardi R and Toppino P M (1997) Influence of heat treatment on the volatile compounds of milk. Journal of Agricultural and Food Chemistry 45
3171–3177.
Edmond S P (2001) Continuous heat processing. InThermal technologies in food processing, pp 29–48. Richardson p, ed. Cambridge: Woodhead Publishing Ltd.
Fredsted L B., Rysstad G and Eie T (1995) ‘‘Pure-Lac: the new milk with protected freshness and extended shelf life’’. In Heat Treatments & Alternative Methods, pp. 104–125. Brussels: International Dairy Federation. Hougaard A B, Hammershøj M, Vestergaard J S, Poulsen O
and Ipsen R H (2009) Instant Infusion paseurization of bovine milk I Effects on bacterial inactivation and physi-cal-chemical properties. International Journal of Dairy Technology62484–492.
Lawless H T and Heymann H (1999)Sensory Evaluation of Food. Principles and Practices. New York, USA: Aspen Publishers, Inc.
Rerkrai S, Jeon I J and Bassette R (1987) Effect of various direct ultra-high temperature heat treatments on flavour of commercially prepared milks.Journal of Dairy Science
702046–2054.
Solano Lopez C E, Taehyun J and Alvarez V B (2005) Vola-tile compounds and chemical changes in ultrapasteurized milk packaged in polyethylene terephthalate containers. Journal of Food Science70C407–C412.
Valero E, Villamiel M, Sanz J and Martinez Castro I (2000) Chemical and sensorial changes in milk pasteurised by microwave and conventional systems during cold storage. Food Chemistry7077–81.
Valero E, Villamiel M, Miralles B, Sanz J and Martinez Castro I (2001) Changes in flavour and volatile components dur-ing storage of whole and skimmed UHT milk. Food Chemistry7251–58.
Vazquez Landaverde P A, Velazquez G, Torres J A and Qian M C (2005) Quantitative determination of thermally derived off-flavour compounds in milk using solid-phase microextraction and gas chromatography. Journal of Dairy Science883764–3772.