Exploring the Future of Fuel Loads in Tasmania,
Australia: Shifts in Vegetation in Response to
Changing Fire Weather, Productivity, and
Fire Frequency
†
Rebecca Mary Bernadette Harris1,*ID, Tomas Remenyi1 ID, Paul Fox-Hughes2, Peter Love1and Nathaniel L. Bindoff1,3,4,5
1 Antarctic Climate and Ecosystems Cooperative Research Centre (ACE CRC), University of Tasmania,
Hobart 7001, Australia; tom.remenyi@utas.edu.au (T.R.); p.t.love@utas.edu.au (P.L.); N.Bindoff@utas.edu.au (N.L.B.)
2 Bureau of Meteorology, Hobart 7001, Australia; paul.fox-hughes@bom.gov.au
3 Institute for Marine and Antarctic Studies (IMAS), University of Tasmania, Hobart 7001, Australia
4 ARC Centre of Excellence for Climate Systems Science, University of Tasmania, Hobart 7001, Australia
5 Centre for Australian Weather and Climate Research (CAWCR), Commonwealth Scientific and Industrial
Research Organisation (CSIRO) Marine and Atmospheric Research, Hobart 7001, Australia
* Correspondence: rmharris@utas.edu.au; Tel.: +61-3-6226-2920
† This paper is an extended version of our paper published in Proceedings of The Modelling and Simulation Society of Australia and New Zealand (MSSANZ) conference 12 2017, pp. 1097–1103. ISBN:
978-0-9872143-7-9.http://www.mssanz.org.au/modsim2017/H10/harris.pdf.
Received: 23 February 2018; Accepted: 9 April 2018; Published: 16 April 2018
Abstract:Changes to the frequency of fire due to management decisions and climate change have the potential to affect the flammability of vegetation, with long-term effects on the vegetation structure and composition. Frequent fire in some vegetation types can lead to transformational change beyond which the vegetation type is radically altered. Such feedbacks limit our ability to project fuel loads under future climatic conditions or to consider the ecological tradeoffs associated with management burns. We present a “pathway modelling” approach to consider multiple transitional pathways that may occur under different fire frequencies. The model combines spatial layers representing current and future fire danger, biomass, flammability, and sensitivity to fire to assess potential future fire activity. The layers are derived from a dynamically downscaled regional climate model, attributes from a regional vegetation map, and information about fuel characteristics. Fire frequency is demonstrated to be an important factor influencing flammability and availability to burn and therefore an important determinant of future fire activity. Regional shifts in vegetation type occur in response to frequent fire, as the rate of change differs across vegetation type. Fire-sensitive vegetation types move towards drier, more fire-adapted vegetation quickly, as they may be irreversibly impacted by even a single fire, and require very long recovery times. Understanding the interaction between climate change and fire is important to identify appropriate management regimes to sustain fire-sensitive communities and maintain the distribution of broad vegetation types across the landscape.
Keywords:climate change; prescribed burning; vegetation change; climate adaptation
1. Introduction
One of the key determinants of fire activity is the available fuel load. The fuel load is influenced at the landscape scale by community structure and composition (e.g., grassland vs. forest), and at more
local scales by fuel age, structure, and composition; rates of decomposition, and vegetation growth rates. Attempts to project future fire danger must therefore account for changes in vegetation growth and fuel dynamics under future climatic conditions. The challenges associated with quantifying these processes have been identified as a significant gap that limits our ability to project future fire danger [1].
Projecting future fire danger is further complicated by the interactions and feedbacks that exist between the fire regime, vegetation, climate, and human intervention [1]. The frequency of fire is an important aspect of the fire regime and is projected to increase under the warmer and drier climate conditions expected with ongoing climate change. In addition, prescribed burning (also referred to as management burning) is a major component of the fire regime in many parts of the world. Prescribed burning regimes are likely to change in the future, for several reasons. In the warmer and drier conditions that are projected under ongoing climate change, there may be reduced opportunities available for prescribed burning, as fire danger increases and the fire season starts earlier in the year [2–6]. At the same time, community attitudes may shift to demand more extensive and/or frequent prescribed burning to protect lives and property following destructive wildfires. Alternatively, support for prescribed burning may decline due to concerns about the health effects of smoke [7,8].
Changes to the frequency of fire due to such management decisions and climate change have the potential to affect the flammability of the vegetation, with long-term effects on the vegetation structure and composition. Frequent fire in some vegetation types can lead to transformational change when a threshold is crossed, beyond which the vegetation type is radically altered, and this is not always a gradual process. For example, in forests dominated by obligate seeders, increased frequency of intense fire can cause a state change from woodland to grassland [9]. In Tasmania, Australia, changes to anthropogenic burning have caused rainforest to shift to moorland and vice versa [10–12]. An increase in the frequency of prescribed burning may also increase flammability in some vegetation types [13,14]. In subalpine and alpine forests of southeastern Australia, for example, Zylstra [15] demonstrated that frequent burning (up to a 14-year cycle) led to changes in forest structure that more than doubled the average size of fires, which spread faster and were more difficult to suppress.
It is therefore of interest to explore future potential fire activity under different scenarios of fire frequency. While there are major impediments to projecting fuel loads under future climatic conditions, it is possible to project several important factors determining fire activity into the future. Values for future climate conditions, including fire weather, Soil Dryness Index, and productivity can be calculated from projections of future climate, available at increasingly fine resolution. For other ecological factors, the general trends expected under climate change, such as growth rates and time to maturity, can be estimated. This enables potential pathways of change to be identified, starting with the current flammability and sensitivity to fire of broad vegetation types.
We present an approach to identify the main drivers of change to potential fire activity under future climate change and explore potential pathways of change to broad vegetation types affecting flammability across the landscape. We illustrate the approach using data from Tasmania, Australia, but the method could be applied anywhere in the world. We use a “pathway modelling” approach to consider multiple transitional pathways that may occur under different fire frequencies. We do not include changes to the distribution of vegetation in response to changing climate suitability because we expect that such change will occur slowly over long timeframes for the main forest types in Tasmania. Since the dominant forest species that make up the bulk of the fuel load are long-lived and adapted to a broad range of climate conditions (as shown by their current broad geographical distributions), they are likely to persist, even if stressed, for much of the 100-year timeframe covered by the model.
arising from changing fire weather over time in combination with changes to the fire regime due to management decisions.
This article expands on research presented at the International Congress on Modelling and Simulation (MODSIM), December 2017, Hobart, Australia, and published in The Modelling and Simulation Society of Australia and New Zealand (MSSANZ) conference proceedings. A more detailed methodology is presented here, to enable the tool to be developed and applied elsewhere. Ways in which the tool could be applied to communicate and illustrate the potential consequences of changes of fire frequency and climate change are also more fully developed.
2. Materials and Methods
2.1. Representing the Response to Fire of Tasmanian Vegetation Communities
A regional vegetation map, TASVEG version 3.0 [16], was used to provide information about the existing composition, structure, flammability, and fire sensitivity of broad vegetation groups across the region. This provided the baseline for the potential response of the vegetation to changing fire weather, productivity (biomass), and fire frequency. TASVEG 3.0 provides a map of the Tasmanian vegetation at a resolution of 1:25,000, comprising 158 mapping units, most of which represent distinct vegetation communities. Associated with each mapping unit is detailed information about the composition, structure, and floristics of the unit [17], from which flammability and fire sensitivity categories have been derived based on the attributes of the common plant species [18]. We focus on the dominant plants because they are often the “fuel species” [19] that provide most of the biomass and determine the structure of the vegetation community. Changes to the distribution, abundance, or dominance of fuel species under altered fire regimes have the potential to set up positive or negative feedbacks.
The response of a community to fire is related to the flammability and sensitivity of the present vegetation type to fire. The fire attributes categories (24 categories) are groups of communities in the TASVEG vegetation map that have similar fire sensitivity and flammability characteristics. There are five fire sensitivity categories (low, moderate, high, very high, and extreme) which reflect the potential ecological impact of a single fire on a stand of vegetation (Table1). Sensitivity to fire will determine the response of the vegetation to fire or, alternatively, its resilience to frequent burning. Sensitivity is influenced by the reproductive strategy of the dominant species (e.g., obligate seeders vs. resprouters, time to maturity) [20], which has been widely used to represent response to changing fire intervals, e.g., [21]. The four flammability categories (low, moderate, high, and very high) are based on knowledge of the dynamics of fuel dryness for each vegetation type, which affects how many days per year the vegetation type will burn (Table1). The distribution of vegetation across Tasmania belonging to the flammability categories in TASVEG 3.0 is shown in Supplementary Material Figure S2.1.
[image:3.595.90.507.649.734.2]We use a broad functional type approach to understand the effect of altered fire regimes across the landscape because it is independent of taxonomic identity and therefore focusses on process [22]. Different species assemblages are likely to have very similar fuel properties because fuel is strongly influenced by vegetation structure and spatial distribution [23].
Table 1.Fire sensitivity and flammability categories from Pyrke and Marsden-Smedley (2005) [18].
Fire Sensitivity Categories
Extreme Any fire will cause irreversible or very-long-term (>500 years) damage
Very high A single fire will cause significant change to community structure for 50–100 years and will increase the probability of subsequent fires
Table 1.Cont.
Moderate At least 15 years between fires is required to maintain the defining species
Low A single fire will generally not affect the vegetation, but repeated short intervals (i.e., <10 years) may cause long-term changes
Flammability Categories
Very high Will burn readily throughout the year even under mild weather conditions, except after recent rain (i.e., less than 2–7 days ago)
High Will burn readily when fuels are dry enough (from late spring to early autumn) but will be too moist to burn for lengthy periods, particularly in winter
Moderate Will only burn after extended periods without rain (i.e., 2 weeks or more), and in moderate or stronger wind conditions
Low Will burn only after extended drought (i.e., 4 weeks or more without rain) and/or under severe fire weather conditions (i.e., Forest Fire Danger Index > 40)
2.2. Vegetation Pathways through Time
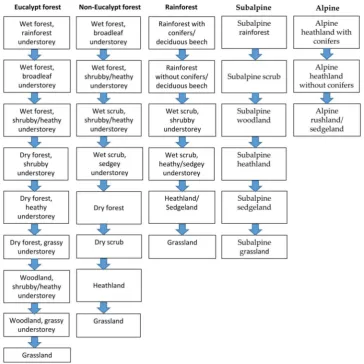
The model starts with broad vegetation type to determine the general transition pathway, but the rate at which change occurs is based on the attributes of the underlying mapping units. Transitional gradients, from wet forest types through to dry forests, woodlands, and grasslands, are followed, dependent on the fire frequency and the changing fire weather over time.
Eucalyptus forests, Non-eucalyptus forests (e.g.,MelaleucaL.,LeptospermumJ.R. Forst. & G. Forst., AcaciaMill)., and Rainforests (e.g.,AthrotaxisD. Don.,NothofagusBlume) follow different pathways, represented by a gradient of moisture and fire frequency. Figure1shows the general pathways followed in the model. The detailed steps for all vegetation types are shown in Supplementary Material Table S2.2. Subalpine and Alpine types are treated separately to reflect their higher sensitivities to fire. The pathways can be reversed under fire suppression scenarios except where site factors determine the present vegetation type. For example, grassland can move towards forest if fire is suppressed, and non-eucalypt wet forest may become drier in the future and with increased fire frequency. However, dry non-eucalypt forests cannot become wet forests because the current composition reflects the moisture of the site (e.g.,AllocasuarinaL.A.S. Johnson occurs on dry sites,Acaciaon wet sites).
Different understorey types within the broad vegetation types reflect the fertility of the site, moisture, and fire history. We assigned broad understorey types to enable this to be incorporated into the transition pathway and influence the rate of change. We started all communities with the understorey it would have if it had been unburnt for long periods. We did not attempt to recreate the state of the vegetation in its current state, although this could be incorporated with further model development.
Figure 1.The vegetation pathways followed in the model. Detailed steps with the associated TASVEG 3.0 vegetation codes representing the original vegetation types used to develop the pathway are shown in Supplementary Material Table S2.2.
2.3. Modelling Potential Fire Activity
The vegetation pathway model is based on the four-switch model [24], which describes fire activity in terms of four factors that must be fulfilled simultaneously (switched “on”) for fire to occur. There must be fuel available (biomass); it must be dry enough to burn (availability to burn); weather conditions must be conducive to fire spread (fire weather); and there must be an ignition source (ignition).
Modelling “Potential Fire Activity” (PFA), the level of fire activity possible if an ignition source were present, is a two-step process. First, the broad vegetation type is determined for each cell for a particular time and fire interval. Then, the PFA is calculated at each grid cell (10 km) across Tasmania, Australia, using the appropriate attributes for that type, following the equation
Potential Fire Activity (PFA) = Biomass + Availability to Burn + Fire Weather (1)
where Biomass = (productivity×fuel load at time since fire); Availability to Burn = flammability of vegetation type at current Soil Dryness Index (SDI)×slope factor; and Fire Weather = Fire Danger Index (FFDI or MFDI, depending on vegetation type). Each term is described in detail below.
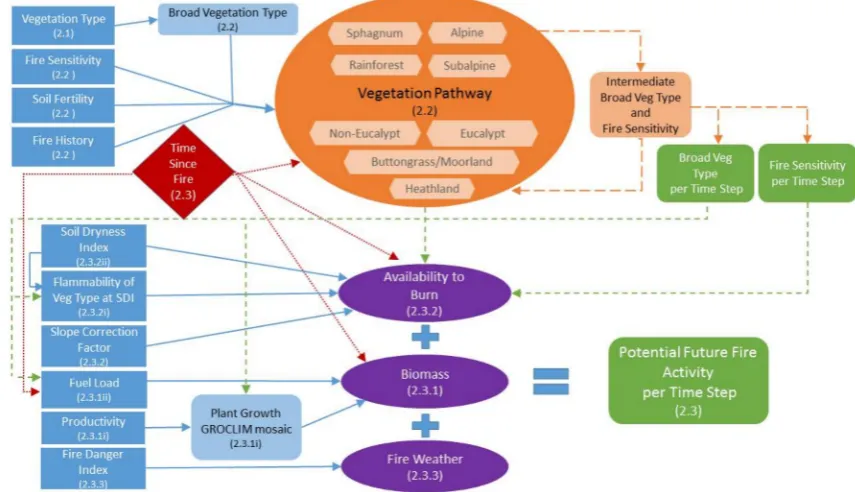
attributes from TASVEG 3.0 [16], and information on fuel characteristics from the scientific literature. Climate indices used in the equation reflect the appropriate time period, so if the model is 50 years from 2000, then the climate layer at that time step is 2040–2060. The layers used to calculate each term and their relationship to each other are summarized in Figure2.
Figure 2.The components of the vegetation pathway model. Blue boxes are inputs. Light-blue boxes are derived products. Orange components represent the different vegetation pathways followed over time. Purple boxes represent the “switches” calculated. Green boxes are outputs reflecting changes to vegetation over time. ‘Broad Vegetation Type per timestep’ is used to define the vegetation conditions and estimate the Potential Fire Activity at each timestep. Numbers in brackets refer to the section within the text within which the term is described in detail.
All climate-driven layers were calculated from the output of a dynamically downscaled regional climate model (The Commonwealth Scientific and Industrial Research Organisation’s Conformal Cubic Atmospheric Model (CCAM)), at a resolution of ~10 km. Downscaling of six global climate models from the Climate Model Intercomparison Project 3 (CMIP3) was carried out by the Climate Futures for Tasmania (CFT) project. Details of the climate modelling can be found in Corney et al. [25]. All projections and layers are available through the Tasmanian Partnership for Advanced Computing (TPAC) portal (http://portal.sf.utas.edu.au/thredds/catalog.html).
2.3.1. Biomass
There are two components to the Biomass term: (i) productivity and (ii) the fuel load.
(i) Productivity
The GROCLIM submodel from the ANUCLIM model [26] was used to generate an index of relative potential plant growth, based on plant growth response to light, temperature, and water regimes under current and future climate conditions. The growth index does not represent actual biomass production, but describes plant production potential across the landscape.
of growing temperatures (3–36◦C) with an optimum temperature of 19◦C, and is most applicable to temperate species. The C3-Microtherm plant type has a range of growing temperatures from 0 to 20◦C with an optimum temperature of 10◦C, so is most applicable to conifers and cool to cold temperate climate plants. An additional GROCLIM index was customized to represent forest growth based on the known thermal requirements of aEucalyptusL'Hér. species (E. globulus: Minimum temperature (Tmin)
8◦C, Maximum temperature (Tmax) 40◦C, Optimum temperature (Topt) 16◦C) [27]. The growth index
is a dimensionless index with a scale of zero to one, where plant growth is minimal or nonexistent below a growth index value of 0.2. This was scaled (by multiplying by 1.6), so that productivity could increase or decrease under future conditions of temperature and rainfall.
A composite GROCLIM layer was calculated for each time period, with the appropriate GROCLIM thermal types applied to each broad vegetation type, as follows. The C3-Microtherm index was used for all areas with alpine and subalpine vegetation types; Buttongrass because it generally occurs at altitudes greater than 600 m in colder regions; and Rainforest with conifers or deciduous beech, because of the presence of conifers. The index based on theEucalyptusthermal type was applied to all areas with Eucalypt forest types, and the C3-Mesotherm index was applied to all other regions to incorporate the broad thermal range of temperate plants in general.
(ii) Fuel Load
The fuel load (tonnes per hectare) was calculated for each broad vegetation type at each time step, using Olson’s model of fuel accumulation [28]:
Biomass (of fuel) =L×(1−exp(−k×A)) (2) whereLrepresents the carrying capacity (or maximum fuel load),kis the growth rate (or decomposition rate) andAis age (or time since fire).
Values for carrying capacity and growth rate in Tasmanian vegetation types were decided upon after consultation with the literature and fire ecologists (Jon Marsden-Smedley, Dave Taylor, personal communication), and resulted in the accumulation curves shown in Supplementary Material Figure S2.3. The value for the TASVEG type that made up the greatest area of each Broad Vegetation Type was used.
2.3.2. Availability to Burn
This term of the Potential Fire Activity equation incorporates (i) the Flammability of the vegetation type and (ii) a measure of fuel dryness, the Soil Dryness Index (SDI).
(i) Flammability
The four flammability categories (low, moderate, high, and very high) are based on knowledge of the dynamics of fuel dryness for each vegetation type, which affects how many days per year the vegetation type will burn. The categories are defined in Table1. As with fire sensitivity, the flammability category was changed at each time step to reflect any changes to vegetation type.
(ii) Soil Dryness Index (SDI)
The Soil Dryness Index (SDI) [29] is a measure of soil moisture which is used as an index of fuel moisture and relative flammability of different vegetation types (values from [30]) (Table S2.4, Supplementary Material). An overview of the SDI and its strengths and weaknesses can be found in Marsden-Smedley (2009) [30]. The mean SDI from the CFT projections was calculated at each time period, and determined the flammability of each vegetation type at that time.
2.3.3. Fire Weather (FFDI, MFDI)
Two different fire danger indices were used to indicate fire weather at each time period. Both indices incorporate surface air temperature, relative humidity, and wind speed, combined with an estimate of fuel dryness (Drought Factor, based on Soil Dryness Index and recent precipitation) to give an index of daily fire danger. The Moorland Fire Danger Index (MFDI) [31] was used for areas with Buttongrass Moorland, Sphagnum, and Sedgeland vegetation. This index is better suited to moorlands and other types where soil dryness has less of an influence on fire behavior. The annual cumulative MacArthur’s Forest Fire Danger Index (FFDI) [32] was applied for all other vegetation types.
2.4. Fire Frequency
[image:8.595.86.511.334.417.2]We explored the effect of different fire frequencies on the potential fire activity and flammability of vegetation across Tasmania. The climate-driven layers (productivity, SDI, and fire weather) were updated to reflect the changing climate over time, and the vegetation type shifted along the appropriate pathway when the fire frequency was above the threshold for each type. Values for the time between fires, or fire interval, required for recovery were based on available literature (e.g., Table2).
Table 2.Fire sensitivity categories used in the vegetation model [18].
Frequency of Fire above Which Community Does Not Survive
(No. of Fires per 100 Years)
Time between Fires below Which Community Does Not Survive (Stand Replacement)
Time between Fires below Which Community Will
Change Gradually
Extreme (E) 1 300 500
Very High (VH) 1 50 100
High (H) 3 30 80
Moderate (M) 6 - 15
Low (L) - 2–5 10
3. Results
3.1. Impact of Fire Frequency on Vegetation Type
Very frequent fire, with only 4 years between fires, results in a shift towards drier vegetation types across the state (Figure3). Regions with fire-sensitive vegetation are highlighted, as the vegetation shifts quickly at high fire frequency. For example, the wet sclerophyll forests with rainforest or broadleaved understoreys in southern Tasmania (shown in orange) quickly move towards dry forest types. In contrast, at very long fire intervals (or low fire frequency), which would occur if fire were actively suppressed, some vegetation types could potentially transition towards different vegetation types (Figure4). For instance, if fire were suppressed in native grasslands, there would be a shift towards woodland vegetation as trees establish in the absence of frequent fire. Buttongrass moorland transitions to a woody vegetation type (mauve to pink) if fire is suppressed and the fire interval is longer than 30 years.
currently carried out are sustained at a 10-year fire interval (Figure6). The transitions are seen as a series of steps in the output, reflecting the threshold values used in the model.
Figure 3.Impact of frequent fire (every 4 years) on vegetation type across Tasmania, incorporating annual layers from the Climate Futures for Tasmania projections. The numbers above each map refer to the number of years from 2000. Colors represent different vegetation types, as follows: Light blues, Subalpine vegetation; Dark blue, Alpine vegetation; Purple, Buttongrass; Oranges, Wet sclerophyll; Dark Orange to Brown, Dry sclerophyll; Greys, Woodland; Reds, Non-eucalypt wet forests; Dark Purple, Non-eucalypt dry forests, Light to Dark Greens, Rainforest.
[image:9.595.169.426.450.694.2]Figure 5.The change in the area of Tasmania covered by broad vegetation structural types after 100 years of burns at a range of fire intervals. The area at fire interval 0 corresponds to the distribution of vegetation types in the year 2000.
Figure 6.The impact of a ten-year fire interval on vegetation types across Tasmania over a period of 100 years, beginning in 2000. Transitions were constrained along vegetation pathways, indicated by different colors, with each type having different tolerances to fire frequency.
3.2. Impact of Fire Frequency on Future Potential Fire Activity
[image:10.595.149.437.367.589.2]Figure 7.Impact of fire interval on future Potential Fire Activity across Tasmania.
3.3. Impact of Fire Frequency on Treatability
Vegetation that requires fire management to fulfil operational requirements is referred to as “treatable”. At fire intervals of between 15 and 50 years, there is little change in the percentage treatability across Tasmania from the baseline to the end of the century (Figure8). Intervals of less than 5 years maintain the highest proportion of vegetation requiring fuel management. The drop in treatability at very high frequencies reflects the shift to the bare ground state of fire-sensitive vegetation types over time. At very long fire intervals, the percentage of treatable vegetation drops over time because in the absence of fire, vegetation transitions to wetter forest types.
[image:11.595.136.461.478.716.2]4. Discussion
Future fire danger is projected to increase substantially under ongoing climate change [2,33]. More frequent bushfires can therefore be expected, leading to a greater need for prescribed burning to reduce bushfire risks. However, trade-offs will occur between fuel reduction and vegetation transitions in response to more frequent fire. The vegetation pathway model is a tool to illustrate the potential impacts of a dryer and warmer future climate in combination with management decisions about the frequency of prescribed burning. Within the model, ecological theory is translated into visualizations and summaries of potential landscape-scale change, to consider the impact of fire frequency on vegetation type, potential future fire activity, and the consequences of such changes for the proportion of a region that will require fuel management.
Currently, prescribed burning is applied in Tasmania for fuel reduction, ecological management, and weed control purposes [30]. Each of these objectives requires different intensities and frequencies of burning, which also vary in different vegetation types. In asset protection zones, fires of sufficient intensity are required to reduce the fuel load while ensuring that safety standards are not compromised and fires can be contained. Except in cases where the asset is a fire-sensitive species or community, there is a trade-off in these zones between fire risk reduction and ecological impacts. Broad-scale fuel management is then applied in strategic management zones to increase the potential to suppress bushfires and reduce wildfire size, whilst aiming to minimize adverse impacts on other values. In ecological management zones, fires may be suppressed, or prescribed burning applied at a range of intensities and frequencies appropriate for the target species or community, so that a mosaic of burnt and unburnt areas is maintained. The aim in these zones is that no vegetation transition should occur as a result of fire management. The Tasmanian operational guidelines for asset protection zones recommend fire frequencies of between 4 and 10 years in dry forests and scrub, and the exclusion of prescribed burning from the wet forests, alpine areas, and other fire-sensitive vegetation communities [18]. The results presented here therefore do not represent the current management approach to prescribed burning. Instead, we illustrate the potential impact of a range of scenarios of fire frequency.
Fire frequency has a substantial impact on the future Potential Fire Activity (PFA) relative to the impact of the changing climate over the coming decades. While the climate is projected to become warmer and drier over time, leading to higher fire danger, fire frequency is the dominant driver of future fire activity because of the feedback between fire and flammability in drier, fire-adapted vegetation types. Frequent fire has the potential to lead to shifts in vegetation type, away from mesic, fire-sensitive types, towards drier, more fire-adapted vegetation. The rate of change differs across the vegetation types, with some fire-sensitive communities irreversibly impacted by even a single fire, and requiring very long recovery times. For example, rainforest communities with conifers may never recover after a fire, asAthrotaxisis an extremely slow growing and very long-lived tree that is killed by fire. In such communities, there is a positive feedback where fires promote vegetation that is more flammable, increasing the risk of fire. In contrast, fire-adapted vegetation such as dry eucalypt forests recover relatively quickly after fire, and are only impacted by very frequent fires.
long term. The challenge of suppressing fires even at relatively small scales is already becoming evident in Tasmania, as shown by the impact of recent fires in The Tasmanian Wilderness World Heritage Area. This area contains the core refugium of the paleo-endemic coniferAthrotaxis cupressoides (A. cupressoides) D. Don, a species restricted to cool, wet climates and fire-free environments. Following an extremely hot and dry summer in 2015/2016, a lightning storm ignited numerous fires which burnt large stands ofA. cupressoides[34,35]. Recovery is unlikely because of the species’ slow growth and limited seedling establishment and the positive feedback between fire and flammability discussed above. Fire suppression is likely to become increasingly difficult in the future as fire danger increases, the fire season becomes longer [33], and the window available for prescribed burning narrows under ongoing climate change [36].
We have presented results for the state of Tasmania, but similar assessments could be generated for any subregion and will reflect the different vegetation types within the region of interest (for example, see Supplementary Material, Figure S2.5, for results for each of the Bureau of Meteorology forecast districts). The percentage of vegetation requiring fuel treatment is likely to differ across different districts depending on the vegetation types present, as they follow different transition pathways. Further exploration of the changes within a region, or particular forest, would be useful to inform conversations about the range of possible futures under different fuel management strategies.
The pathway approach is a useful tool for assisting community adaptation, by illustrating the potential impacts of a dryer and warmer future in combination with decisions seeking to manage fire risk in the future. Change over time under different scenarios of fire frequency can be spatially represented to show the shifts in vegetation type across the landscape and, hence, flammability. Maps can be used to show the distribution of the different vegetation types across the landscape, and how this changes at different fire intervals. The regions with the most fire-sensitive vegetation types and, therefore, greatest potential for vegetation transitions can be highlighted in this way to improve understanding of the tradeoffs between conservation, flammability, and fuel management.
The model involves a considerable simplification of the real world of vegetation and fire at the landscape scale. Flammability and fire sensitivity, for instance, are categorized into four and five classes, respectively. We have based these classes on available research in Tasmania, but any number of classes could be incorporated. Recently logged wet eucalypt forest and rainforest, for example, might be better represented by an additional flammability class, because the increased exposure of the understorey to insolation and altered floristics leads to higher flammability compared to undisturbed forests. More refined categories, based on understandings of the many fuel characteristics that influence fire, could be incorporated to make the model more regionally specific.
There are several factors influencing fire activity that could be included in the model with further development. Aspect could be incorporated to consider its influence on fire intensity and frequency, through temperature and drying effects and differential fire spread. MODIS (Moderate Resolution Imaging Spectroradiometer) canopy cover class could be used to distinguish different canopy cover within the broad vegetation types and within mapping units (e.g., “forest” and “woodland” canopy structure; recently logged or cleared vegetation). However, some factors such as forest growth under elevated CO2are unable to be projected into the future because of lack of knowledge or complex
warmer and drier. Additionally, extreme events such as heatwaves and droughts may cause sudden shifts in the vegetation in these regions, where the dominant species are less resilient to extremely high temperatures and/or low moisture conditions [35]. Similarly, the distribution of vegetation types in which structurally important species have particular climatic requirements (e.g.,Athrotaxis) may change over time.
The transitions in the model are based on the assumption of low to moderate fire intensity such as might be applied in asset protection zones and in some areas within strategic management zones. They do not capture the impact of very high-intensity, high-severity fires that can sometimes lead to immediate change after a single fire. The occurrence of such fires is likely to increase in the future as lightning ignitions and fire danger increase. Additionally, we have assumed that vegetation responses will remain the same under future climate conditions, but this may not be the case as vegetation becomes stressed by ongoing climate changes such as droughts. For example, dry eucalypt forests, which in the past have recovered relatively quickly after fire, may become more vulnerable to transition due to the cumulative effect of drought.
5. Conclusions
Fire frequency has a large impact on future fire activity relative to the impact of the changing climate over the coming decades. Frequent fire has the potential to lead to shifts in vegetation type, away from mesic, fire-sensitive types, towards drier, more fire-adapted vegetation. This leads to a positive feedback between fire and flammability in drier, fire-adapted vegetation types. The rate of change differs across vegetation types, leading to changes in vegetation structure and flammability at the landscape scale. The pathway model consolidates current understanding in the field into an interactive framework, enabling plausible futures to be explored. It could be used as a tool in community adaptation, to frame potential futures and identify the consequences of decisions seeking to manage fire risk in the future. Change over time, under different management regimes (frequency of prescribed burning), can be spatially represented to show the shifts in vegetation types across the landscape.
Supplementary Materials:The following are available online athttp://www.mdpi.com/1999-4907/9/4/210/s1. Figure S2.1: The distribution of vegetation across Tasmania belonging to the flammability categories in TASVEG 3.0, Table S2.2. The vegetation pathways followed in the model, Figure S2.3: Fuel load versus time since fire in the broad vegetation types, Table S2.3: The vegetation types in the model associated with each fuel accumulation curve; Table S2.4, Flammability at different levels of Soil Dryness Index (SDI), Figure S2.5: Impact of fire interval on Potential Future Fire Activity in the Bureau of Meteorology forecast districts.
Acknowledgments: This work was funded by the National Bushfire Mitigation—Tasmanian Grants Program (NBMP). Rebecca Harris was supported in part by a Humboldt Research Fellowship. Jon Marsden-Smedley and Dave Taylor provided guidance and data for fuel accumulation curves and vegetation attributes. Sandra Whight and Paul Black supported the concept and gave valuable insights into the operational implications of prescribed burning regimes in Tasmania. Jayne Balmer (Department of Primary Industries, Parks, Water and Environment) gave ecological advice that helped in translating the TASVEG types into the model.
Author Contributions:R.M.B.H. and T.R. conceived and designed the approach and analyses; T.R., R.M.B.H. and P.L. developed the model; R.M.B.H. and T.R. analyzed the data; all authors contributed to the concept and model development; R.M.B.H. and T.R. wrote the paper, with contributions from P.F.-H., P.L. and N.L.B.
Conflicts of Interest:The authors declare no conflict of interest. The funding sponsors had no role in the design of the study; in the collection, analyses, or interpretation of data; in the writing of the manuscript, and in the decision to publish the results.
References
2. Fox-Hughes, P.; Harris, R.M.; Lee, G.; Grose, M.; Bindoff, N.L. Future fire danger climatology for Tasmania, Australia, using a dynamically downscaled regional climate model.Int. J. Wildland Fire2014,23, 309–321. [CrossRef]
3. Flannigan, M.; Cantin, A.S.; de Groot, W.J.; Wotton, M.; Newbery, A.; Gowman, L.M. Global wildland fire season severity in the 21st century.For. Ecol. Manag.2013,294, 54–61. [CrossRef]
4. Liu, Y.Q.; Stanturf, J.; Goodrick, S. Trends in global wildfire potential in a changing climate.For. Ecol. Manag.
2010,259, 685–697. [CrossRef]
5. Westerling, A.L.; Hidalgo, H.G.; Cayan, D.R.; Swetnam, T.W. Warming and earlier spring increase western us forest wildfire activity.Science2006,313, 940–943. [CrossRef] [PubMed]
6. Jolly, W.M.; Cochrane, M.A.; Freeborn, P.H.; Holden, Z.A.; Brown, T.J.; Williamson, G.J.; Bowman, D. Climate-induced variations in global wildfire danger from 1979 to 2013.Nat. Commun. 2015. [CrossRef] [PubMed]
7. Johnston, F.; Bowman, D. Bushfire smoke: An exemplar of coupled human and natural systems.Geogr. Res.
2014,52, 45–54. [CrossRef]
8. Haikerwal, A.; Reisen, F.; Sim, M.R.; Abramson, M.J.; Meyer, C.P.; Johnston, F.H.; Dennekamp, M. Impact of smoke from prescribed burning: Is it a public health concern?J. Air Waste Manag. Assoc.2015,65, 592–598. [CrossRef] [PubMed]
9. Bowman, D.M.J.S.; Murphy, B.P.; Neyland, D.L.J.; Williamson, G.J.; Prior, L.D. Abrupt fire regime change may cause landscape-wide loss of mature obligate seeder forests. Glob. Chang. Biol.2014,20, 1008–1015. [CrossRef] [PubMed]
10. Di Folco, M.B.; Kirkpatrick, J.B. Organic soils provide evidence of spatial variation in human-induced vegetation change following European occupation of Tasmania.J. Biogeogr.2013,40, 197–205. [CrossRef] 11. Fletcher, M.S.; Thomas, I. A Holocene record of sea level, vegetation, people and fire from western Tasmania,
Australia.Holocene2010,20, 351–361. [CrossRef]
12. Fletcher, M.S.; Thomas, I. The origin and temporal development of an ancient cultural landscape.J. Biogeogr.
2010,37, 2183–2196. [CrossRef]
13. Fernandes, P.M.; Botelho, H.S. A review of prescribed burning effectiveness in fire hazard reduction.Int. J. Wildland Fire2003,12, 117–128. [CrossRef]
14. Lindenmayer, D.B.; Hobbs, R.J.; Likens, G.E.; Krebs, C.J.; Banks, S.C. Newly discovered landscape traps produce regime shifts in wet forests.Proc. Natl. Acad. Sci. USA2011,108, 15887–15891. [CrossRef] [PubMed] 15. Zylstra, P. The historical influence of fire on the flammability of subalpine Snowgum forest and woodland.
Vic. Nat.2013,130, 232–239.
16. Tasmanian Department of Primary Industries, Parks, Water and Environment. Tasmanian Vegetation Monitoring and Mapping Program; TASVEG 3.0; Resource Management and Conservation Division, Department of Primary Industries, Parks, Water and Environment: Hobart, Australia, 2013.
17. Harris, S.; Kitchener, A.From Forest to Fjaeldmark: Descriptions of Tasmania’s Vegetation; Department of Primary Industries, Parks, Water and Environment, Printing Authority of Tasmania: Hobart, Australia, 2005. 18. Pyrke, A.F.; Marsden-Smedley, J.B. Fire-attributes categories, fire sensitivity, and flammability of Tasmanian
vegetation communities.TasForests2005,16, 35–46.
19. Gill, A.M.; Woinarski, J.C.Z.; York, A.Australia’s Biodiversity—Responses to Fire: Plants, Birds and Invertebrates; Department of Environment and Heritage: Canberra, Australia, 1999; p. 206.
20. Noble, I.R.; Slatyer, R.O. The use of vital attributes to predict successional changes in plant communities subject to recurrent disturbances.Vegetatio1980,43, 5–21. [CrossRef]
21. Hammill, K.; Penman, T.; Bradstock, R. Responses of resilience traits to gradients of temperature, rainfall and fire frequency in fire-prone, Australian forests: Potential consequences of climate change.Plant Ecol.
2016,217, 725–741. [CrossRef]
22. Cary, G.J.; Bradstock, R.A.; Gill, A.M.; Williams, R.J. Global change and fire regimes in Australia. InFlammable Australia: Fire Regimes, Biodiversity and Ecosystems in a Changing World; Bradstock, R.A., Gill, A.M., Williams, R.J., Eds.; CSIRO Publishing: Clayton, Australia, 2012; pp. 149–169.
23. Bradstock, R.A.; Cary, G.J.; Davies, I.; Lindenmayer, D.B.; Price, O.F.; Williams, R.J. Wildfires, fuel treatment and risk mitigation in Australian eucalypt forests: Insights from landscape-scale simulation.
24. Bradstock, R.A. A biogeographic model of fire regimes in Australia: Current and future implications.
Glob. Ecol. Biogeogr.2010,19, 145–158. [CrossRef]
25. Corney, S.P.; Katzfey, J.J.; McGregor, J.L.; Grose, M.R.; Bennett, J.C.; White, C.J.; Holz, G.K.; Gaynor, S.M.; Bindoff, N.L.Climate Futures for Tasmania: Climate Modelling Technical Report; Antarctic Climate & Ecosystems Cooperative Research Centre: Hobart, Australia, 2010.
26. Hutchinson, M.F.ANUCLIM; Version 6.1; Fenner School of Environment and Society, Australian National University: Canberra, Australia, 2011.
27. Sands, P.J.; Landsberg, J.J. Parameterisation of 3-PG for plantation grownEucalyptus globulus.For. Ecol. Manag.
2002,163, 273–292. [CrossRef]
28. Olson, J.S. Energy storage and balance of producers and decomposers in ecological systems.Ecology1963,
34, 322–331. [CrossRef]
29. Mount, A.B.The Derivation and Testing of a Soil Dryness Index Using Run-Off Data; Bulletin 4; Forestry Commission: Hobart, Australia, 1972.
30. Marsden-Smedley, J.B.Planned Burning in Tasmania: Operational Guidelines and Review of Current Knowledge; Fire Management Section, Parks and Wildlife Service, Department of Primary Industries, Parks, Water and the Environment: Hobart, Australia, 2009.
31. Marsden-Smedley, J.B.; Rudman, T.; Pyrke, A.; Catchpole, W.R. Buttongrass moorland fire-behaviour prediction and management.TasForests1999,11, 87–99.
32. McArthur, A.G. Fire behaviour in eucalypt forests. InForestry and Timber Bureau Leaflet 107; Forestry and Timber Bureau: Canberra, Australia, 1967.
33. Holz, A.; Wood, S.W.; Veblen, T.T.; Bowman, D.M.J.S. Effects of high-severity fire drove the population collapse of the subalpine Tasmanian endemic coniferAthrotaxis cupressoides. Glob. Chang. Biol. 2015,21, 445–458. [CrossRef] [PubMed]
34. Harris, R.M.B.; Beaumont, L.J.; Vance, T.R.; Tozer, C.; Remenyi, T.A.; Perkins-Kirkpatrick, S.E.; Mitchell, P.J.; Nicotra, A.B.; McGregor, S.; Andrew, N.R.; et al. Biological responses to the press and pulse of climate trends and extreme events.Nat. Clim. Chang.2018, in press.
35. Fox-Hughes, P.; Harris, R.M.B.; Lee, G.; Jabour, J.; Grose, M.R.; Remenyi, T.A.; Bindoff, N.L.Climate Futures for Tasmania Future Fire Danger: The Summary and the Technical Report; Antarctic Climate & Ecosystems Cooperative Research Centre: Hobart, Australia, 2015.
36. Harris, R.M.B.; Remenyi, T.; Fox-Hughes, P.; Love, P.; Phillips, H.E.; Bindoff, N.L. An assessment of the viability of prescribed burning as a management tool under a changing climate: a Tasmanian case study. In Proceedings of the Bushfire and Natural Hazards CRC & AFAC Conference, Melbourne, Australia, 4 September 2017; Rumsewicz, M., Ed.; Bushfire and Natural Hazards CRC: Melbourne, Australia, 2017.
![Table 1. Fire sensitivity and flammability categories from Pyrke and Marsden-Smedley (2005) [18].](https://thumb-us.123doks.com/thumbv2/123dok_us/8395322.324450/3.595.90.507.649.734/table-sensitivity-ammability-categories-pyrke-marsden-smedley.webp)

![Table 2. Fire sensitivity categories used in the vegetation model [18].](https://thumb-us.123doks.com/thumbv2/123dok_us/8395322.324450/8.595.86.511.334.417/table-fire-sensitivity-categories-used-the-vegetation-model.webp)


