Environmental impacts of grazed pastures
J. Eriksen1, S. Ledgard2, J. Luo2 R. Schils3, J. Rasmussen1
1Department of Agroecology and Environment, University of Aarhus, PO Box 50, Tjele,
Denmark
2AgResearch Ltd., Ruakura Research Centre, Private Bag 3123, Hamilton, New Zealand
3ALTERRA, Wageningen-UR, PO Box 47, 6700 AA Wageningen, The Netherlands
Abstract
Large nitrogen (N) surplus and return of excreta-N in localised patches at high N rates in intensively grazed pasture systems markedly increases the risk of N losses to waterways and the atmosphere. Here are described the main routes of N input to grazed pastures, losses via N leaching, methane (CH4) and nitrous oxide (N2O) emissions. Furthermore farm N budgets
and N use efficiency in relation to management strategies that can be applied to reduce N losses are discussed. Nitrate leaching increases exponentially with increased inputs and is closely related to urine patches, which also influence the leaching of dissolved organic N. High N2O emission rates in grazed pastures are related to fertiliser-N or N in excreta
combined with compaction by animal treading. Grazing may considerably reduce CH3
emissions compared to indoor housing of cows. Pastures are occasionally cultivated due to sward deterioration followed by a rapid and extended period of N mineralization,
contributing to an increased potential for losses. Good management of the pasture (e.g. reduced fertiliser input and reduced length of grazing) and of the mixed crop rotation during both the grassland and the arable phase (e.g. delayed ploughing time and a catch crop strategy) can considerably reduce the negative environmental impact of grazing. It is important to consider the whole farm system when evaluating environmental impact. In particular for green house gasses since the pasture may serve as a source of N2O and
indirectly of CH3, but also as a sink of CO2 influenced by management practices on the farm.
Keywords: Clover/grass pastures, grazing, nitrogen losses, pasture management
Introduction
Grazing animals have profound effects on pastoral systems including nutrient removal by grazing and redistribution through excreta. Generally, in grazed pastures the conversion of consumed N into product is low and a substantial quantity of N (>70%) is recycled through the direct deposition of animal excreta. This low N utilization by grazing animals reflects the relatively high concentrations of N required for metabolic functions and optimum growth of plants compared to that needed by the grazing ruminant for amino acid and protein synthesis (Haynes and Williams, 1993). Increasing the N concentration in grass, such as by increasing the rate of N fertiliser application, can result in a substantial N surplus (i.e. N inputs – N outputs in products). For example, N surpluses of 150 to 250 kg N ha-1 yr-1 occur in highly productive dairy farm systems in the Netherlands and northern Germany (Rotz et al., 2005). Increasing the N concentration of the diet generally increases the excretion of urinary N in both absolute terms and as a percentage of the total N excreted. There is an exponential relationship between N intake and N excretion in urine and Scholefield et al. (1991) predicted that about 80% of N intake is excreted in urine with a dietary N concentration of 4% N.
Archived
at
Grazing cattle return N in urine patches at rates of up to about 1000 kg N ha-1, which is far in excess of plant requirements (Haynes and Williams, 1993). Urine N is in highly mineralisable forms compared to dung N, and within 3-5 days is rapidly converted to plant-available N in soil. This can result in inorganic soil N under urine patches up to 10 times greater than under dung patches, and more than 30 times greater than areas unaffected by excreta (Afzal and Adams, 1992).
The large N surplus and return of excreta-N in localised patches at high N rates in intensively grazed pasture systems markedly increases the risk of N losses to waterways and the atmosphere. The excretal returns, particularly urinary N, from grazed animals are typically the major sources of N lost from grazed pastures. The primary transformations leading to N losses are ammonia (NH3) volatilisation, nitrification and denitrification (Bolan et al., 2004).
Leaching losses of NO3 to waterways and emissions of NH3 and N2O to the atmosphere from
grazed pastures have significant environmental implications (Oenema et al., 1997; Di and Cameron, 2002).
In grazed pastures, animal treading damage during grazing under wet soil conditions limits pasture growth and reduces soil infiltration rates (Drewry et al., 2008). Animal treading of pasture can also increase soil bulk density and consequently cause an increase in mechanical impedance to root penetration and a reduction in aeration and/or an increase in waterlogging of soil. This will have a negative effect on legume growth, productivity, and N2
fixation in pasture (Menneer et al., 2004). In addition, the treading damage also increases the risk of run-off losses of other nutrients, such as P, from grazed pastures (Monaghan et al., 2005).
Pastures are permanent or occasionally cultivated due to sward deterioration. As a consequence of the substantial N surplus and the soil N build-up, the cultivation of grazed grassland is followed by a rapid and extended period of N mineralization, which may also contribute significantly to an increased potential for losses.
The objectives of the present review are to describe the main routes of N input to farming systems with grazed pastures, to quantify environmentally harmful losses from these systems via NO3 leaching, atmospheric CH4 and N2O losses, and to discuss farm N budgets
and N use efficiency in relation to management strategies that can be applied to reduce N losses.
Nitrogen leaching
Permanent pastures
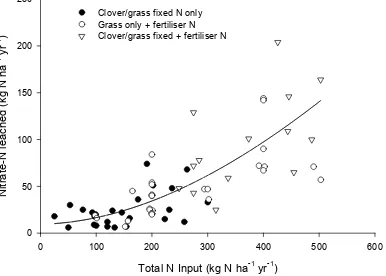
Research on grazed systems indicates that NO3 leaching increases exponentially with
increased N input (Figure 1). This is mostly associated with an increase in dry matter (DM) production, N uptake and recycling in animal excreta resulting in a corresponding increase in leaching losses from urine patches (Ledgard, 2001). Various studies have also shown the much greater importance of urine N compared to fertiliser N in contributing to NO3 leaching
(because of the much larger specific rate of N application in urine); urine typically contributes 70-90% of total N lost through leaching (Monaghan et al., 2007).
Many permanent pastures include legumes, particularly white clover in temperate pastures, to supply N from clover N2 fixation for long term production (Ledgard, 2001). The
a white clover diet than with a ryegrass-based diet. However, the clover-N feedback mechanism, whereby N2 fixation decreases with high N inputs, acts to enhance N efficiency.
In areas where N inputs from excreta occur there will be low associated input from N2
fixation.
Fertiliser N is generally used efficiently by pastures for plant growth but it enhances pasture N uptake and grass N concentrations, thereby increasing both N excretion in urine and the risk of environmental loss. Estimates of N leached from managed pastures vary widely, ranging from about 5 to 200 kg N ha-1 yr-1, due to many factors including differences
in N input, N output in excreta, soil drainage and animal type (e.g. Monaghan et al., 2007). Eriksen et al. (2004) observed higher leaching losses from grazed N-fertilised ryegrass pasture (on average 47 kg N ha-1yr-1) than from grazed non-N-fertilised clover/ryegrass pasture (on average 24 kg N ha-1yr-1). Over time the losses from the clover/ryegrass pasture decreased due to a reduction in N2 fixation together with a reduction in DM production which
in turn led to a lower grazing intensity and lower rate of recycling of animal excreta. The research summary of N leaching from grazed pastures in Figure 1 shows overlap of N leaching values estimated from pastures with or without clover at similar N inputs. However, in long-term grass/clover pastures, N inputs from N2 fixation are usually less than about 200
kg N ha-1 yr-1 thereby limiting maximum N leaching from non-N-fertilised clover/grass
pastures, whereas N fertiliser may be used at much higher annual rates of application, with potential for high N losses.
One of the options to mitigate NO3 losses is to reduce the length of the grazing season.
A NO3 leaching model of Vellinga et al. (2001) was used to exemplify the effect of grazing
season length on NO3 losses (Figure 2). Under full grazing, i.e. 20 hours a day from 15 April
to 15 October, the NO3 concentration is 69 mg/l. In this experiment, the best strategy to
reduce NO3 losses was to shorten the end of the grazing season in the autumn. For example,
NO3 concentration was reduced to 59 mg/l by ending grazing on the 15 September, and the
Nitrate Directive target was achieved by ending grazing around 15 August. However, some farmers especially in mainland Europe choose to start grazing their herds later in the spring/summer and do not turn out cows until after the whole grassland area has been cut for silage. Farmers follow this strategy to ensure that high quality silage can be harvested. From an environmental viewpoint this strategy is less efficient than shortening the end of the grazing season as delaying turnout from 15 February to 15 March only reduces NO3
concentration to 66 mg/l.
Pastures in crop rotation
Dairy production systems in parts of Europe are based on ley-arable rotations (Vertés et al., 2007) that are characterised by three phases: pasture, ploughing out, and subsequent arable cropping (Watson et al., 2005). Generally, the ploughing-out phase carries the highest risk of NO3 leaching as N accumulated in the soil during the ley phase is released upon cultivation.
However, in every phase there are options to reduce NO3 leaching.
Table 1 shows N budgets for temporary pastures as influenced by different sward types and uses, and that the N surplus is considerable for pasture grazed by dairy cows with high feed-N (Eriksen, 2001). However, in the early pasture phase NO3 leaching losses are usually
low as much N can be accumulated in the sward, but over time the N loss depends on the equilibrium between inputs and the soil organic N pool. This equilibrium is not reached within the first years of the clover pasture (Johnston et al., 1994) and also takes longer to be reached in grass-clover compared to grass-only swards due to the self-regulatory nature of legumes. Even though NO3 leaching losses in young swards are much less than indicated by
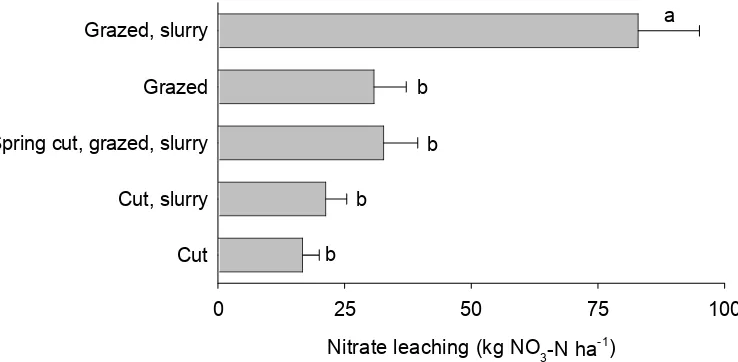
(Wachendorf et al., 2004) but a management system that combines cutting and grazing is preferable to a pure grazing system. The dual advantage is in less recycling of animal excreta and a lower N surplus because of herbage removal, both leading to less NO3 leaching. In a
Danish experiment, grazing with spring application of cattle slurry showed NO3 losses
dramatically higher than other managements (Figure 3, Eriksen et al., unpublished) but excluding the use of slurry under grazing management, or alternatively using combinations of cutting and grazing, reduced NO3 leaching considerable to an average level of approximately
30 kg NO3-N ha-1. This was close to, and not statistically different from the leaching under
cutting.
The release of N following grassland cultivation is often substantial in the first year, with N fertilizer replacement values often exceeding 100 kg N ha-1 (Eriksen et al., 2008), but with relatively little effect of both grassland management and age, even in situations with huge differences in N input during the grass phase (Eriksen, 2001; Hansen et al., 2005). It has been demonstrated that mineralisation of N following grassland cultivation is a two-stage process with a rapid mineralisation over the first 160-230 days followed by a second phase with mineralisation rates 2-7 times lower than in the first phase (Vertes et al., 2007). However, it is recognised that grass-rich crop rotations are more beneficial to soil fertility than arable rotations and although differences in the initial residual value between grasslands of different age or management often seem small, the accumulated effect can be considerable over the years. It is well-known that cultivation of permanent pasture has an impact on soil C and N dynamics for decades (Springob et al., 2001), but it has also been shown that even grasslands of 2 to 8 years of age may affect the availability of soil N for some time (Eriksen et al., 2008).
Delayed ploughing in late winter or spring can reduce NO3 leaching especially on sandy
soils and where rainfall occurs early in the autumn or winter (Djurhuus and Olsen, 1997). However, this must be set against possible lower yields of spring versus winter crops. It has also been shown that rotary cultivation of grass swards prior to ploughing can result in faster N availability and better synchrony between N mineralization and plant uptake (Eriksen and Jensen, 2001).
The release of large quantities of N from grass-clover residues means that fertiliser-N use on subsequent cereal crops can be reduced or even eliminated in the first following crop. Catch crops are useful during winters in the arable phase of the crop rotation to reduce NO3 leaching, by removing soil mineral N from the soil profile before winter drainage
occurs. An example is given in Figure 4, where two grass-clover swards were ploughed on coarse sandy soil in Denmark. Perennial ryegrass as a catch crop reduced NO3 leaching by
66-88% compared to bare soil, and in the treatment with barley harvested green and followed by Italian ryegrass it was reduced by more than 90% to less than 10 kg NO3-N ha-1 yr-1.
A key objective in designing grass-arable crop rotations is to optimise the grass phase, i.e. the number of grassland cultivations in relation to the length of the grass phase. For the individual farmer this depends on the requirement for feed and access to grazing. The common motivation for grassland cultivation is yield loss due to sward deterioration caused by e.g. compaction from wheel traffic and invasion of less productive natural grasses (Hoving and Boer, 2004), but also the maintenance or increase of soil fertility and nutrient utilisation play a role.
Leaching of dissolved organic N
Leaching of N from cultivated soils occurs mainly in NO3 form, but leaching of dissolved
(Wachendorf et al., 2005; Van Kessel et al., 2009). Rasmussen et al. (2008) reported a total N leaching of 10 kg N ha-1 from cut grass-clover with DON accounting for 15% of the total loss, and Wachendorf et al. (2005) reported a total N leaching of 30 kg N ha-1 from a grazed pasture with DON accounting for one third of total N. Nitrogen leaching in both experiments was estimated on the basis of soil solution sampled with suction cups/plates. Other studies reporting much higher DON proportion of the total dissolvable N are most often based on soil extractions (e.g. Jones and Willet, 2006) mobilizing disproportional high amounts of DON. The trend often found in studies of the contribution of DON to total N leaching is that the amount of DON lost is relatively constant, whereas changes in total N losses occur due to changes in the leaching of NO3 (Rasmussen et al., 2008; Vinther et al., 2006).
Nitrous oxide and methane emissions
Eckard et al. (2003) noted that denitrification losses were highest in winter when soil moisture was highest. Very high N2O emission rates have been observed in grazed pastures
(e.g., de Klein et al., 2006; Luo et al., 2008b; 2008c) when wet soils become compacted by animal treading. Treading causes anaerobic conditions and animal excreta provides abundant N and C. Thus, high N2O emission rates can occur on wet soils soon after N fertilisation or
grazing.
Reported N2O emission rates from soils under clover/grass pasture grazed by dairy cows
in New Zealand and Australia range from 6 to 11 kg N2O-N ha-1 yr-1 (Dalal et al., 2003; Luo
et al., 2008a). At comparable levels of production it is likely that the N2O emissions resulting
from N-cycling of animal excreta will be similar for both clover/grass and grass pasture. However, because grass pasture requires inputs of N fertiliser, this type of pasture will have additional fertiliser-specific losses. For example, losses of up to 29 kg N2O-N ha-1 yr-1 have
been measured in grass pastures in Ireland that received N fertiliser application at a rate of 390 kg N ha-1 yr-1 (Hyde et al., 2006). Ryden (1983) reported losses of 1.3 kg N ha-1 yr-1 for grass pasture that did not receive N fertiliser inputs and of 11 kg N ha-1 yr-1 after N fertilisation at a rate of 250 kg N ha-1 yr-1. In an Australian study (Eckard et al., 2003), N losses from total denitrification were significantly less from unfertilised clover/ryegrass pasture than from the same pasture receiving 200 kg N ha-1yr-1 (as either ammonium nitrate
or urea), at 6 kg N ha-1 yr-1 without N fertiliser and 15 and 13 kg N ha-1 yr-1, respectively, for the two N fertilisers. Similar denitrification losses have been reported by other workers on clover/grass pastures in New Zealand. For example, Ruz-Jerez et al. (1994) reported annual losses of 3.4 kg N ha-1 from grass/clover swards compared to 19.3 kg N ha-1 after application of 400 kg ha-1 yr-1 of N fertiliser and Ledgard et al. (1999) reported total denitrification losses of 3-7 kg N ha-1 yr-1 without added N compared to 10-25 kg N ha-1yr-1 after application of 200 kg N ha-1yr-1 as N fertiliser. Much higher denitrification losses were measured from N-fertilised pasture in Northern Ireland at up to 154 kg N ha-1 yr-1 after application of 500 kg N ha-1yr-1 as N fertiliser (Watson et al., 1992).
Ramirez-Restrepo and Barry, 2005). They also have the potential to reduce N leaching and N2O
emissions by increasing the relative N excretion in faeces compared to urine (Carulla et al., 2005), thereby reducing the amount of urine-N with high risk of N loss.
Farm N budgets and N use efficiency
The previous two sections referred to measurements from plots or paddocks with pasture but there is also a need to consider the whole farm and account for effects of nutrients in external inputs such as brought-in feed and within-farm transfers such as from farm dairy effluent or stored slurry. The magnitude of N input to grazed farm systems is generally the main factor determining the N surplus and therefore the potential for N losses. For example, Ledgard et al. (1999) found that a three-fold increase in total N inputs to intensively-grazed dairy pastures in NZ resulted in a four-fold increase in N surplus, a four- to five-fold increase in gaseous and leaching losses, and a halving of the N use efficiency (Table 2). A summary of dairy farm systems across Western Europe (Bossuet et al., 2006) showed an even wider range in the quantity and form of N inputs, N outputs, and N surplus, with denitrification being generally higher overall and N leaching lower than in the New Zealand study.
A three-year comparison between fertiliser-N and clover-N dairy systems using ryegrass-based pasture was carried out by Schils et al. (2000a, 2000b). The farm systems had the same number of cows but more land was used in the clover system due to lower pasture production (Table 3). An intensive monitoring programme was carried out, with measurements including forage production and quality, feed intake and milk production. Biological N2 fixation was calculated from clover contents and clover/grass yields. Nitrate
concentration in drain water was measured on a weekly basis, while GHG emissions were calculated using IPCC emission factors (Schils et al., 2005). The N surplus per ha was higher for the N-fertilised system, but this was mainly related to the higher milk production per ha. While there was no significant difference in the calculated N leaching between the systems. When expressed as N leached per kg milk. there was a trend for N leaching it to be 25% higher from the clover system than from the N-fertilised system. Calculated N2O emissions
(direct and indirect) were lower on the clover system, both per ha and per kg milk, mainly due to the much lower use of fertiliser-N.
Importance of managing whole systems
Intensively grazed pasture systems markedly increase the risk of N losses to waterways and the atmosphere. Traditionally, N losses are expected to increase with the age of the sward due to the likely loss of excess N when maximum accumulation has been reached. This picture of increasing N losses with sward age and comparatively huge losses following cultivation may well describe the situation on many farms, but it is not an inherent property of grassland and grass-arable rotations. Good pasture management (e.g. reduced fertiliser input and reduced length of grazing) and in the mixed crop rotation both during the grassland and the arable phase (e.g. delayed ploughing time and a catch crop strategy) can considerably reduce negative environmental impact of grazing.
Although there are environmental consequences of grazing, pollution swapping can occur with e.g. housing and cutting only systems due to transport and storage of feed – all of which require energy often from non-renewable sources. Therefore, when evaluating environmental impact it is necessary to examine the whole farming system. In particular for green house gasses since pasture may serve as a source of N2O and indirectly of CH3, but also
as a sink of CO2 influenced by management practices on the farm. Furthermore, indirect
emissions in other ecosystems from losses of N via NO3 leaching and NH3 volatilisation
References
Afzal M. and Adams W.A. (1992) Heterogeneity of soil mineral nitrogen in pasture grazed by cattle. Soil Science Society of America Journal 56, 1160-1166.
Bossuet I., Chambaut H., le Gall A. and Raison C. (2006) Study of the distribution of nitrogen surplus in experimental dairy farms of the Atlantic area. Dairy Systems and Environment in the Atlantic Area. Proceedings of the Final Seminar of the Green Dairy Project, 13-14 December 2006, Institute of de I’Elevage, Rennes, France, pages 67-95.
Bolan N.S., Saggar S., Luo J., Bhandral R. and Singh, J. (2004) Gaseous emissions of nitrogen from grazed pastures: processes, measurements and modelling, environmental implications, and mitigation.
Advances in Agronomy 84, 37-120.
Carulla J.E., Kreuzer M., Machmuller A. and Hess H.D. (2005) Supplementation of Acacia mearnsli tannins decreases methanogenesis and urinary nitrogen in forage-fed sheep. Australian Journal of Agricultural Research 56, 961-970.
Clark H. (2001) Ruminant methane emissions: a review of methodology used for national inventory estimations. A report for Ministry of Agriculture and Fisheries, Wellington, New Zealand.
Dalal R.C., Wang W., Robertson G.P. and Parton W.J. (2003) Nitrous oxide emissions from Australian agricultural lands and mitigation options. Australian Journal of Soil Research 41, 165-195.
de Klein C.A.M., Smith L.C. and Monaghan R.M. (2006) Restricted autumn grazing to reduce nitrous oxide emissions from dairy pastures in Southland, New Zealand. Agriculture, Ecosystems and Environment
112, 192-199.
Di H. and Cameron K.C. (2002) The use of a nitrification inhibitor, dicyandiamide (DCD), to decrease nitrate leaching and nitrous oxide emissions in a simulated grazed and irrigated grassland. Soil Use and Management 18, 395-403.
Djurhuus J. and Olsen P. (1997) Nitrate leaching after cut grass/clover leys as affected by time of ploughing.
Soil Use and Management 13, 61-67.
Drewry J.J., Cameron K.C. and Buchan G.D. (2008) Pasture yield and soil physical property responses to soil compaction from trading and grazing – a review. Australian Journal of Soil Research 46, 237-256. Eckard R.J., Chen D., White R.E. and Chapman D.F. (2003) Gaseous nitrogen loss from temperate perennial
grass and clover dairy pastures in south-eastern Australia. Australian Journal of Agricultural Research
54, 561-570.
Eriksen J. (2001) Nitrate leaching and growth of cereal crops following cultivation of contrasting temporary grasslands. Journal of Agricultural Science, Cambridge 136, 271-281.
Eriksen J., Askegaard M. and Søegaard K. (2008) Residual effect and nitrate leaching in grass-arable rotations: Effect of grassland proportion, sward type and fertilizer history. Soil Use and Management 24, 373-382.
Eriksen J. and Jensen L.S. (2001) Soil respiration, nitrogen mineralisation and uptake in barley following cultivation of grazed grasslands. Biology and Fertility of Soils 33, 139-145.
Eriksen J., Vinther F.P. and Søegaard K. (2004) Nitrate leaching and N2-fixation in grasslands of different composition, age and management. Journal of Agricultural Science, Cambridge 142, 141-151.
Hansen J.P., Eriksen J. and Jensen L.S. (2005) Residual nitrogen effect of a dairy crop rotation as influenced by grass-clover ley management, manure type and age. Soil Use and Management 21, 278-286.
Hansen E.M., Eriksen J. and Vinther F.P. (2007) Catch crop strategy and nitrate leaching following a grazed grass-clover. Soil Use and Management 23, 348-358.
Haynes R.J. and Williams P.H. (1993) Nutrient cycling and soil fertility in grazed pasture ecosystems. Advances in Agronomy 49, 119-199.
Hoving I.E. and de Boer H.C. (2004) Farm management and economics – grassland renovation. In: "Grassland Resowing and Grass-arable Crop Rotations" (eds. J.G. Conijn and F. Taube), Plant Research International, Wageningen, Report 80, pages 67-70.
Hyde B.P., Hawkins M.J., Fanning A.F., Noonan D., Ryan M., O’Toole P. and Carton O.T. (2006) Nitrous oxide emissions from a fertilized and grazed grassland in the south east of Ireland. Nutrient Cycling in Agroecosystems 75, 187-200.
Johnston A.E., McEwen J., Lane P.W., Hewitt M.V., Poulton P.R. and Yeoman D.P. (1994) Effects of one to six year old ryegrass-clover leys on soil nitrogen and on the subsequent yields and fertilizer nitrogen requirements of the arable sequence winter wheat, potatoes, winter wheat, winter beans (Vicia faba) grown on a sandy loam soil. Journal of Agricultural Science, Cambridge 122, 73-89.
Ledgard S.F. (2001) Nitrogen cycling in low input legume-based agriculture, with emphasis on legume/grass pastures. Plant and Soil 228, 43-59.
Ledgard S.F., Penno J.W. and Sprosen M.S. (1999) Nitrogen inputs and losses from clover/grass pastures grazed by dairy cows, as affected by nitrogen fertiliser application. Journal of Agricultural Science, Cambridge 132, 215-225.
Luo J., Ledgard S.F., de Klein C.A.M., Lindsey S.B. and Kear M. (2008a) Effects of dairy farming intensification on nitrous oxide emissions. Plant and Soil 309, 227-237.
Luo J., Ledgard S.F. and Lindsey S.B. (2008b) A test of a winter farm management option for mitigating nitrous oxide emissions from a dairy farm. Soil Use and Management 24, 121-130.
Luo J., Saggar S., Bhandral R., Bolan N., Ledgard S., Lindsey S. and Sun W. (2008c) Effects of irrigating dairy-grazed grassland with farm dairy effluent on nitrous oxide emissions. Plant and Soil 309, 119-130. Menneer J.C., Ledgard S.F., McLay C.D.A. and Silvester W.B. (2004) The impact of grazing animals on N2
fixation in legume-based pastures and management options for improvement. Advances in Agronomy
83, 181-241.
Monaghan R.M., Paton R.J., Smith L.C., Drewry J.J. and Littlejohn R.P. (2005) The impacts of nitrogen fertilisation and increased stocking rate on pasture yield, soil physical condition and nutrient losses in drainage from a cattle-grazed pasture. New Zealand Journal of Agricultural Research 48, 227-240. Monaghan R.M., Hedley M.J., Di H.J., McDowell R.W., Cameron K.C. and Ledgard S.F. (2007) Nutrient
management in New Zealand pastures – recent developments and future issues. New Zealand Journal of Agricultural Research 50, 181-201.
Oenema O., Velthof G.L., Yamulki S. and Jarvis S.C. (1997) Nitrous oxide emissions from grazed grassland.
Soil Use and Management 13, 288-295.
Ramirez-Restrepo C.A. and Barry T.N. (2005) Alternative temperate forages containing secondary compounds for improving sustainable productivity in grazing ruminants. Animal Feed Science and Technology
120, 179-201.
Rasmussen J., Gjettermann B., Eriksen J., Jensen E.S. and Høgh-Jensen H. (2008) Fate of 15N and 14C from labelled plant material: Recovery in perennial ryegraa-clover mixtures and in pore water of the sward.
Soil Biology & Biochemistry 40, 3031-3039
Rotz C.A., Taube F., Russelle M.P., Oenema J., Sanderson M.A. and Wachendorf M. (2005). Whole-farm perspectives of nutrient flows in grassland agriculture. Crop Science 45, 2139-2159.
Ruz-Jerez B.E., White R.E. and Ball P.R. (1994). Long-term measurement of denitrification in three contrasting pastures grazed by sheep. Soil Biology and Biochemistry 26, 29-39.
Ryden J.C. (1983) Denitrification loss from a grassland soil in the field receiving different rates of nitrogen as ammonium nitrate. Journal of Soil Science 34, 355-365.
Schils R.L.M., Boxem T.J., Sikkema K. and Andre G. (2000a) The performance of a white clover based dairy system in comparison with a grass/fertiliser-N system. I. Botanical composition and sward utilisation.
Netherlands Journal of Agricultural Science 48, 291-303.
Schils R.L.M., Boxem T.J., Jagtenberg C.J. and Verboon M.C. (2000b) The performance of a white clover based dairy system in comparison with a grass/fertiliser-N system. II. Animal production, economics and environment. Netherlands Journal of Agricultural Science 48, 305-318.
Schils R.L.M., Verhagen A., Aarts H.F.M. and Šebek L.B.J. (2005) A farm level approach to define successful mitigation strategies for GHG emissions from ruminant livestock systems. Nutrient Cycling in Agroecosystems 71, 163-175.
Scholefield D., Lockyer D.R., Whitehead D.C. and Tyson K.C. (1991) A model to predict transformations and losses of nitrogen in UK pastures grazed by beef cattle. Plant and Soil 132, 165-177.
Sommer S., Olesen J.E., Petersen S.O., Weisbjerg M., Valli L., Rohde L. and Béline F. (2009) Region-specific assessment of greenhouse gas mitigation with different manure management strategies in four agroecological zones. Global Change Biology 15, 2825-2837.
Springob G., Brinkmann S., Engel N., Kirchmann H. and Böttcher J. (2001) Organic C levels of Ap horizons in North German Pleistocene sands as influenced by climate, texture, and history of land-use. Journal of Plant Nutrition and Soil Science 164, 681-690.
Vellinga T. V., Van der Putten A. H. J. and Mooij M. (2001). Grassland management and nitrate leaching, a model approach. Netherlands Journal of Agricultural Science 49, 229-253.
Van Kessel C. , Clough T. and van Groeningen J.W. (2009) Dissolved organic nitrogen: An overlooked pathway of nitrogen loss from agricultural systems. Journal of Environmental Quality 38, 393-401.
Vertés F., Hatch D., Velthof G., Taube F., Laurent F., Loiseau P. and Recous S. (2007) Short-term and cumulative effects of grassland cultivation on nitrogen and carbon cycling in ley-arable rotations.
Vinther F.P. and Jensen E.S. (2000) Estimating legume N fixation in grass-clover mixtures of a grazed organic cropping system using two 15N methods.Agriculture, Ecosystems and Environment2 78, 139-147. Vinther F.P., Hansen E.M. and Eriksen J. (2006) Leaching of soil organic carbon and nitrogen in sandy soils
after cultivating grass-clover swards. Biology and Fertility of Soils 43, 12-19.
Wachendorf M., Büchter M., Trott H. and Taube F. (2004) Performance and environmental effects of forage production on sandy soils. II. Impact of defoliation system and nitrogen input on nitrate leaching losses. Grass and Forage Science 59, 56-68.
Wachendorf C., Taube F. and Wachendorf M. (2005) Nitrogen leaching from N-15 labelled cow urine and dung applied to grassland on a sandy soil. Nutrient Cycling in Agroecosystems 73, 89-100
Watson C.J., Jordan C., Taggart P.J., Laidlaw A.S., Garrett M.K. and Steen R.W. (1992) The leaky N-cycle on grazed grassland. Aspects of Applied Biology 30, 215-223.
Watson C.A., Öborn I., Eriksen J. and Edwards A.C. (2005) Perspectives on nutrient management in mixed farming systems. Soil Use and Management 21, 132-140.
Weller R.F. and Jones E.L. (2002) An overview of the role and potential of forage production on lowland organic livestock farms. Proceedings of the UK Organic Research 2002 Conference, Aberystwyth, UK, pages 81-84.
Wilkins R.J. and Jones R. (2000) Alternative home-grown protein sources for ruminants in the United Kingdom.
Animal Feed Science and Technology 85, 23-32.
Table 1. Annual N budget of six pasture management systems (kg N ha-1 yr-1). Data are mean of production years 1-3 (Eriksen, 2001).
Ryegrass-only
---Clover/ryegrass
--- cut grazed low N1 grazed high N1 cut grazed low N1 grazed high N1 N-Input
Fertilizer N2-fixation Animal manure N-Output
Herbage yield Balance
300 0 0
287 13
300 0 222
240 282
300 0 320
292 328
0 300
0
288 12
0 258 240
271 227
0 266 326
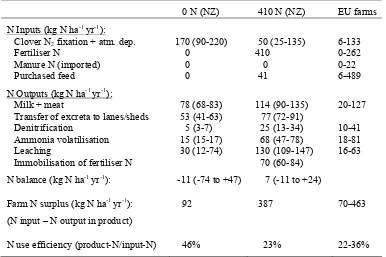
Table 2. N inputs and outputs from intensive dairy farm systems in NZ receiving N fertiliser at 0 or 410 kg N ha-1 yr-1 (Ledgard et al., 1999 and unpublished data). Bracketed values are range in N flows measured over 5 years. Data are compared with that from a range of farm systems in Western Europe (Bossuet et al., 2006).
0 N (NZ) 410 N (NZ) EU farms
N Inputs (kg N ha-1 yr-1):
Clover N2 fixation + atm. dep. 170 (90-220) 50 (25-135) 6-133
Fertiliser N 0 410 0-262
Manure N (imported) 0 0 0-22
Purchased feed 0 41 6-489
N Outputs (kg N ha-1 yr-1):
Milk + meat 78 (68-83) 114 (90-135) 20-127
Transfer of excreta to lanes/sheds 53 (41-63) 77 (72-91)
Denitrification 5 (3-7) 25 (13-34) 10-41
Ammonia volatilisation 15 (15-17) 68 (47-78) 18-81
Leaching 30 (12-74) 130 (109-147) 16-63
Immobilisation of fertiliser N 70 (60-84)
N balance (kg N ha-1 yr-1): -11 (-74 to +47) 7 (-11 to +24)
Farm N surplus (kg N ha-1 yr-1): (N input – N output in product)
92 387 70-463
Table 3. Characteristics of fertiliser-N and clover-N dairy farm systems in the study undertaken by Schils et al. (2000 a,b).
Fertiliser-N Clover-N
Cows (number) 59 59
Area (ha) 34 41
Milk production (kg FPCMa ha-1) 13884 12053
Fertiliser N (kg N ha-1yr-1) 208 17
Manure effective N (kg N ha-1yr-1) 67 52
Clover fixed N (kg N ha-1yr-1) 0 176
Grazing system (hours day-1) 24 24
N input (kg N ha-1yr-1) 333 279
N output (kg N ha-1yr-1) 80 69
N surplus (kg N ha-1yr-1) 253 212
Nitrate leaching (kg N ha-1yr-1) 20 22
Nitrous oxide (kg N ha-1yr-1) 9.4 6.6
GHG total (kg CO2-equiv ha-1) 16065 12198
Nitrate leaching (kg per 1000 kg milk) 1.4 1.8
Nitrous oxide (kg per 1000 kg milk) 0.7 0.5
GHG total (kg CO2-equiv per kg milk) 1.2 1.0
Total N Input (kg N ha-1 yr-1)
0 100 200 300 400 500 600
Ni
trate-N l
eac
hed
(kg
N
ha
-1 yr -1 )
0 50 100 150 200 250
[image:13.595.80.466.109.385.2]Clover/grass fixed N only Grass only + fertiliser N Clover/grass fixed + fertiliser N
0 10 20 30 40 50 60 70 80
0 100 200 300 400 500
Start date for grazing End date for grazing
15 Sep
100 % grazing
15 Aug 15 Jul
15 Jun 15 Aug 15 Jul
15 Jun
15 May
Grazing intensity (cow grazing days per ha)
Nitrate (mg l-1)
no grazing 15 Sep
[image:14.595.147.451.104.298.2]15 May
Figure 2. The effect of the length of the grazing season on NO3 leaching. The upper line
represents the starting dates of the grazing season, while the lower line represents the end dates of the grazing season. The modeled dairy farm has 80 cows, with a milk production of 8000 kg cow-1, on 35 ha of grassland on sandy soil, fertilised with 250 kg N ha-1.
Figure 3. Nitrate leaching from grass-clover pastures with different management. In grazed grass-clover slurry was injected in the spring (100 kg total-N ha-1 cattle slurry), in cut-only
grass-clover an additional injection of slurry was made following a spring harvest of herbage. Bars with the same letter indicate no significant difference (P>0.05)
Nitrate leaching (kg NO3-N ha-1)
0 25 50 75 100
b
a
b
b
b
0 100 200 300
Nitrate leaching (kg N ha-1 yr-1)
100 200 300 400
Organic-N Nitrate-N Green - Ital. ryegrass - 120N
Maturity - per. ryegrass - 0N Maturity - bare soil - 0N Maturity - bare soil - 120N
3-yr-old grass-clover 5-yr-old grass-clover
Green - Ital. ryegrass - 0N
[image:16.595.68.503.162.331.2]Ploughed grassland
Figure 4. Leaching of NO3 and dissolved organic nitrogen after spring cultivation of 3 or 5