This is an electronic version of an article published in Studies in Higher Education
Vol. 35, No. 1, February 2010, 41-59
which is available online at:
http://www.informaworld.com/smpp/
ISSN 0307-5079
2010 Society for Research into Higher Education DOI: 10.1080/03075070902912994
Measuring plagiarism: Researching what students do, not what they say they do
John Walker*
Student plagiarism in colleges and universities has become a controversial issue in recent years. A key problem has been the lack of reliable empirical data on the frequency, nature and extent of plagiarism in student assignments. The aim of the study described here was to provide this data. Patterns of plagiarism were tracked in two university business assignments involving over 500 students and over 1000 scripts. Turnitin software was used to facilitate the identification of plagiarised material in assignments. The findings confirmed some common assertions about the nature of student plagiarism but did not provide support for a number of others.
Keywords: plagiarism; Turnitin; cheating; assessment; university
Introduction
Student plagiarism in university assignments has, for some time, been perceived as a growing problem (Hawley 1984; Wilhoit 1994; Ashworth, Bannister, and Thorne 1997; Walker 1998; Macdonald and Carroll 2006) compounded by the rapid spread and uptake of the Internet, which “makes illicit cutting and pasting so easy as to be nearly irresistible" (Scanlon 2003, 161). The Internet has “a free-ranging intimacy” thus, can seem like “a Platonic commons from which information can be cherry-picked at will” (Scurrah 2001, 10). This new threat to academic integrity has spawned a fresh generation of literature on issues such as: the prevention and detection of Internet plagiarism (Scanlon 2003; McLafferty and Foust 2004; Sterngold 2004; Compton and Pfau 2008; Ma, Wan, and Lu 2008), the ethical and philosophical issues surrounding plagiarism in the age of the Internet (Scurrah 2001; Bugeja 2004; Colvin 2007; Wasley 2008; Zwagerman 2008), and the use of online plagiarism detection tools (Foster 2002; Evans 2006; McKeever 2006; Warn 2006; Badge, Cann, and Scott 2007; Robelen 2007; Ledwith and Risquez 2008).
One major issue, however, has not been satisfactorily resolved, namely, that of an accurate measure of the actual prevalence of plagiarism. Traditionally, researchers have relied on student self-reporting of their own and/or their peers’ plagiarising behaviour to obtain such measures (e.g. Hawley 1984; Brown 1995; Scanlon and Neumann 2002; Rakovski and Levy 2007). While useful data may result, this method creates its own paradox: it requires survey participants to provide honest reports of their own dishonesty (Newstead, Franklyn-Stokes, and Armistead 1996). Scanlon and Neumann (2002, 378) admitted that this fact limited the validity of the findings of their study into levels of student Internet plagiarism: “Self-reporting of any behaviour is problematic; self-reporting of dishonest behaviour is even more challenging.” Pickard’s (2006, 221) findings seem to corroborate this view, since a perceived lack of credibility in her self-reported student data on several types of text-tampering associated with plagiarism led her to comment euphemistically: “It is likely that student responses are not concordant with the behaviours actually employed.” Surveys that go one step further by having students rate their own levels of honesty seem only to render the findings from such studies even more implausible. Credibility is further strained by the often sizeable gulf between self-reported plagiarism by individual students and their perceptions of what their peers are doing. For instance, a mere 8% of Scanlon and Neumann’s (2003) sample admitted to copying a text from the Internet without citation, but perceived that over 50% of their peers did so. The problem is compounded by a lack of standardisation of surveys and by blurring with other forms of cheating.
Lecturer estimates have also been used to attempt to measure student plagiarism (e.g. Pickard 2006). The problem with such a method is that until the recent advent of search engines and anti-plagiarism software, there has been no practical means of confirming the accuracy of such estimates through the provision of proof that plagiarism has, or has not, taken place, without many hours of research. For this reason, such staff estimates are likely to be “'the tip of the iceberg' because most plagiarism probably goes undetected” (Park 2003, 477).
their inexperienced status, they are likely to be “unaware of the seriousness of their actions” (Yeo and Chien 2007, 190) when they plagiarise. Thus staff dealing with plagiarising students should “distinguish between students at the start of their academic career and those further advanced” (Macdonald and Carroll 2006, 239). International students for whom English is a second language may also be prone to plagiarising, for academic and/or cultural reasons and/or reasons linked to the pressures of living and studying in an alien environment (Walker 1998). Male students are also commonly cited as generally more prone to cheating in general (e.g. Rakovski and Levy 2007), and more prone to plagiarising in particular (Park 2003). Furthermore, the rapid growth of distance learning involving the Internet provides greater opportunity for distance students to plagiarise, particularly where there is little or no personal contact between students and faculty (Robinson-Zañartu et al. 2005). Additional factors gleaned from the literature by Park (2003) include views that student plagiarists are immature and/or younger, have low academic ability, possess certain personality factors such as feeling under pressure or lacking confidence, find the course subject matter uninteresting, have active social lives and/or involvement in off-campus activities, and/or perceive that there is little risk that they will be caught.
These two issues - who plagiarises, and to what extent - have been the subject of numerous studies reported in the literature, resulting in some useful data. However, partly because of the methods used to obtain the data, uncertainty persists as to the true magnitude and the true nature of the problem. In terms of Internet plagiarism in particular, current perceptions may even amount to “speculation based on hearsay” (Scanlon 2003, 163). The fact remains that anything resembling an accurate picture of the state of student plagiarism can be obtained only through methods based on empirical measurement of plagiarism in student work, rather than on self-reports, perceptions or assumptions. In other words, researchers need to ‘investigate what students do – as opposed to what they say they do’ (Karlins, Michaels and Podlogar 1988, 363). The practical difficulties involved have meant that few such empirical studies have been reported in the literature. The pioneering study by Karlins, Michaels and Podlogar (1988) was one of these. The researchers compared library assignments of succeeding cohorts to establish that 3% of students (n = 666) had copied their assignments from students in the previous class.
With the advent of so-called “plagiarism detection” software such as EduTie, PlagiServe, Moss and Turnitin, the task was made easier. However, as yet, few studies of this type have been reported in the literature. Warn (2006) used TOAST plagiarism software in a detailed analysis of eight scripts containing plagiarism out of a sample of 74 (10.8%). He found rates of verbatim plagiarism ranging from 3.2% to 15.6% of the submitted text. Ledwith and Risquez (2008) used Turnitin’s peer evaluation module to assess two consecutive student assignments (N = 197). They found that incidences of plagiarism showed a statistically significant drop from the first to the second assignment, and that students rated their peers significantly lower when using Turnitin, compared to assessments submitted and corrected on paper. Valuable as these studies are, however, they remain something of a rarity, while limitations of scope prevent them from providing the wide-ranging empirical data sets required to address the issue in full.
allowing the marker to compare the original with the reproduced material, depending on source accessibility. The onus is on the lecturer/marker to evaluate the report and to decide whether, or to what extent, plagiarism has actually taken place. In particular, a lecturer/marker has to decide what proportion of “matched” material is harmless (e.g. contents, reference lists, legitimately sourced quotations) and what proportion is not. This will often depend on the type of assignment, the specifics of the assignment description and the “ground rules” laid down by the person setting the assignment, and is likely to require on the part of the marker experience, insight, content knowledge, familiarity with the students in the class and good judgement. Nevertheless, with such software, university lecturers are now able to do what before was either difficult or impossible, namely, obtain a clearer picture of the extent of plagiarism in a student assignment. Logic also dictates that the use of plagiarism software should have a deterrent effect on plagiarism (Ledwin and Risquez, 2008) as the knowledge that it is being used to identify plagiarists should in theory act as a massive disincentive, assuming that students are aware of what it can do. Furthermore, on being informed of the identification of plagiarism in an assignment, one assumes that the student would learn the lesson, and submit a plagiarism-free assignment next time.
Notwithstanding its potential usefulness, Turnitin does not seem to have been unequivocally embraced by the academic community and something of a backlash against its use appears to be under way (McKeever 2006), particularly against perceived over-moralistic attitudes by academics who are alleged to employ it to control students in a climate of fear (Zwagerman 2008). It has been claimed that the use of software such as Turnitin has the potential to infringe students’ own copyright status (Foster 2002) and it has been the focus of legal action by students in the USA (Young 2008). Turnitin may militate against trusting students to follow honour codes, some lecturers allegedly viewing it merely as a tool for detection and punishment (Ledwin and Risquez, 2008). There are charges that it not only produces inaccurate reports but poisons classroom relationships between lecturer and student (Williams 2008).
Against the last of these claims can be set two empirical studies that have elicited the student standpoint on Turnitin. Dahl (2007), for instance, conducted an attitudinal study of his students, admittedly with a small sample (N = 24), and found that ‘most students in this study were largely positive about Turnitin’ and that the findings strongly supported its more widespread adoption (Dahl 2007, 186). Part of the reason for this might be, as Dahl points out, that Turnitin is not just ‘plagiarism software’ but possesses enhanced functionality in the form of, for instance, electronic submission with digital proof of receipt, peer marking, online marking, and even the option for students to submit draft assignments and use originality reports to redraft. This implies that Turnitin can also be used in a formative, rather than in a mere summative - or even punitive - mode. Ledwin and Risquez (2008, 379) reported that a majority of students (N = 158) found Turnitin easy to use and ‘an effective way of submitting assignments’, trusted its reliability, understood its benefits, and, probably most importantly, felt that it helped them to become more aware of plagiarism.
Research question1
What is the frequency of plagiarism in a university assignment, in aggregate and in terms of individual student categories?
Research question2
What is the nature of plagiarism in a university assignment in terms of the type and the extent?
Research question 3
In terms of the frequency, type and extent of plagiarism in a university assignment, does student behaviour change between assignments?
Research question 4
Methodology
[image:6.594.84.508.159.682.2]The key variables in the study are summarised in Table 1.
Table 1: The key variables in the study
Variables Options Descriptions
Gender Female or Male
Age Four categories 20 and younger, 21-30, 31-40, 41 and older
Nationality New Zealand New Zealand citizens or holders of permanent residency
International Holders of a student visa to study in New Zealand
Mode of study Internal Students studying on campus
Distance Students studying in distance education mode
Years enrolled 1, 2, 3, 4, 5 or more
Duration of the research project
1, 2, 3, 4, 5 The years 2004-2008
Main
plagiarism type
No plagiarism
Sham Citing a source for the material but presenting it as own paraphrase when it is copied verbatim.
Verbatim Copying material verbatim without citing the source
Purloin Copying from a classmate’s assignment or that of a student previously enrolled in the class.
Plagiarism extent Moderate Less than 20% of assignment plagiarised
Extensive 20% or more plagiarised
The measurement process
exporting venture in two stages approximately six weeks apart and involving researching topics such as current market and financial conditions, product specifications, demographics and cultural information. Use of the Internet was encouraged as the main resource. Students submitted their assignments directly to Turnitin. The researcher scrutinised the ensuing originality reports for instances of plagiarism, marked each assignment, and provided students with a personalised grading sheet that included a comprehensive commentary on the positive and negative features. The researcher alerted students to any plagiarism found in their assignments and in serious cases he talked to the students concerned. A key marking criterion was the extent to which students responded to the researcher’s comments, by revising, redrafting and applying lessons learned to the second assignment, including responding to notifications of plagiarism. In theory, then, given an effective response by students, the final version of the business plan should have been relatively free of plagiarism.
Collection of data proceeded as follows: The originality report was checked to ascertain whether the assignment script contained matching material. If so, both the report and the script were closely examined, and reference made to original sources if necessary, in order to determine whether the matching was harmless, or whether plagiarism had taken place. In the case of the latter, the extent of the plagiarism was recorded by allocating the descriptor ‘moderate’ to instances where less than 20% of the assignment was plagiarised and ‘extensive’ where 20% or more of the assignment was plagiarised. This was a subjective choice for which there was no precedent, except the experience of the researcher as lecturer and marker. The researcher did not record isolated instances of plagiarism. For instance, the existence of one or two copied sentences in a document otherwise characterised by correct citing and referencing was taken to demonstrate carelessness on the part of the student rather than deliberate plagiarism. The researcher then assigned a descriptor to the main type of plagiarism in the script. A number of different types of plagiarism have been identified in the literature (e.g. Park 2003). For practical purposes, these were rationalised into three basic named categories (Walker 1998), approximating to the typology described by Warn (2006).
1. Sham: refers to sham paraphrasing, the practice of correctly citing a source but presenting the material as paraphrased, when it is, in fact, a direct quote without the quotation marks. 2. Verbatim: the practice of simply copying material verbatim from a source without citing the source, thus presenting the material as one’s own.
3. Purloining: submitting an assignment that is substantially or entirely, the work of another student with or without that student’s knowledge.
Once all the data had been collected, it was coded, entered into SPSS, and analysed.
The sample
necessarily equate 100% to year of commencement of studies, it does provide an approximate indicator. It can be seen, for example, that most of the class consisted of academically experienced students, since more than 50% were in their fourth year of enrolment or above, whereas only around 19% of the class were in their first or second year of enrolment.
Table 2: Overview of research sample (n = 569)
Gender Nationality Study Mode
Female Male New Zealand International Internal Distance
n 298 271 358 211 327 242
% 52.4 47.6 62.9 37.1 57.5 42.5
Age Year of enrolment
20 & younger
21-30 31-40 41 & older
1st 2nd 3rd 4th 5th +
n 70 385 76 38 17 91 155 138 168
% 12.3 67.7 13.4 6.7 3.0 16.0 27.2 24.3 29.5
Plagiarism awareness and Turnitin
All students received study guides and had access to the Internet and class WebCT. The study guide included a definition of plagiarism, descriptions of specific types of plagiarism, an explanation of why plagiarism is unacceptable and sections on Internet plagiarism and acknowledgement of sources. Students were advised to consult a recommended companion publication on academic writing for advice on how to avoid plagiarism. Students were warned that proven plagiarism would be subject to university sanctions and they were referred to the university policy on plagiarism. A notice on the standard assignment cover sheet drew students’ attention to the plagiarism issue and reminded them to ensure that the work they were submitting was entirely their own effort. The lecturer also communicated personally about plagiarism with internal students and by newsletter and WebCT with distance students. The general tenor of these communications was a fairly serious warning about plagiarism, suggesting ways to avoid it and offering further help and advice, as well as directing students to the support services of the student learning centre. The study guide also informed students about how Turnitin worked and about assignment submission.
Limitations of the study
understated. Statements about the extent of plagiarism in student work should therefore be read with these limitations in mind.
2. Since the measurement process depended to some extent on the marker’s interpretation of the originality report in conjunction with a perusal of the assignment script, absolute objectivity cannot be claimed for the data.
3. The disadvantages of a convenience sample, such as nonrandomness and potential lack of generalisability, are acknowledged.
4. The study is delimited to the New Zealand tertiary context within which the data were collected. While the findings are indicative, they may not be generalisable.
Findings
Table 3 displays an overview of plagiarism frequency in the two assignments. Since not all students submitted both assignments, the total script numbers for each assignment (n1 = 566 and
n2 = 532) do not match the student sample size (N = 569). Plagiarism of some sort was
[image:9.594.82.517.567.754.2]identified in 31.4% of Assignment 1 scripts and 21% of Assignment 2 scripts, giving a mean for both assignments of 26.2%, just over a quarter of scripts. With the exception of the purloin category, plagiarism dropped from Assignment 1 to Assignment 2, representing a reduction overall of 33.1%. A paired samples t-test confirmed that this reduction was statistically significant from Assignment 1(M = 1.44, SD = .73) to Assignment 2 (M = 1.30, SD = .65), t(528) = 4.98, p < .001, η2 = .04, indicating a small to moderate effect size (Cohen 1988). The most common type of plagiarism was sham, constituting 15.7% and 12.8% of Assignment 1 and 2 scripts respectively. Verbatim plagiarism was more evident in Assignment 1 (14.8%), but more than halved in Assignment 2 (7.1%). Purloining was relatively rare; only 11 cases in total were identified, making up 1% of the 1098 scripts submitted.
Table 3: Percentages of plagiarised scripts and plagiarism types out of total submitted
Category Assignment 1 Assignment 2
n % n % Mean %
Sham 89 15.7 68 12.8 14.2
Verbatim 84 14.8 38 07.1 11.0
Purloin 05 0.9 06 01.1 01.0
Plagiarism total 178 31.4 112 21.0 26.2
No plagiarism 388 68.6 420 78.9 73.8
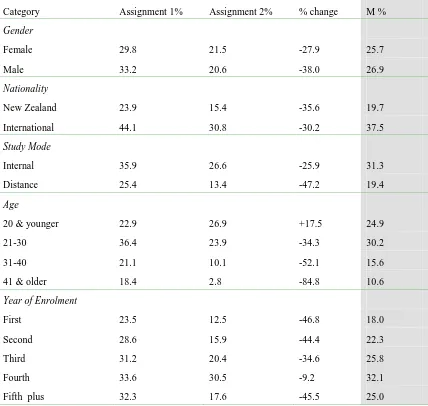
Table 4 presents the percentage of assignments plagiarised in each of the five student categories, gender, nationality, study mode, age and year of enrolment. Across the categories, on average, international students had the highest percentage of plagiarised scripts (M = 37.5%) and students 41 and older had the lowest (M = 10.6%). Only minor differences were apparent on gender, and an independent samples t-test found no statistically significant difference between males and females for either assignment. At around 38%, international students turned in, on average, almost twice as many plagiarised scripts as New Zealand students, the t-test demonstrating a significant difference on both assignments (p < .01, η2 = .03). In the category study mode, the distance student rate of plagiarism (M = 19.4%) was about two-thirds that of internal students (M = 31.3%), the t-test again confirming a significant difference between groups on Assignment 1 (p < .05 and η2 = .01, a small effect size) and Assignment 2 (p < .01,
η2
[image:10.594.82.510.295.701.2]= .03).
Table 4: Percentage of assignments plagiarised in each student category
Category Assignment 1% Assignment 2% % change M % Gender
Female 29.8 21.5 -27.9 25.7
Male 33.2 20.6 -38.0 26.9
Nationality
New Zealand 23.9 15.4 -35.6 19.7
International 44.1 30.8 -30.2 37.5
Study Mode
Internal 35.9 26.6 -25.9 31.3
Distance 25.4 13.4 -47.2 19.4
Age
20 & younger 22.9 26.9 +17.5 24.9
21-30 36.4 23.9 -34.3 30.2
31-40 21.1 10.1 -52.1 15.6
41 & older 18.4 2.8 -84.8 10.6
Year of Enrolment
First 23.5 12.5 -46.8 18.0
Second 28.6 15.9 -44.4 22.3
Third 31.2 20.4 -34.6 25.8
Fourth 33.6 30.5 -9.2 32.1
Fifth plus 32.3 17.6 -45.5 25.0
groups (F(8, 331.3) = 4.5, p = .004, η2 = .02). A similar result was evident for Assignment 2 (F(5.6, 219.1) = 4.5, p = .004, η2 = .03).
In the year-of-enrolment category, newly-enrolled students turned in the fewest plagiarised scripts (M = 18%) and year-four-enrolled students the most (M = 32.1%). The rate of plagiarism rose through years of enrolment two to four, to peak at around 32%, then tailed off in year five plus at 25%. A Pearson two-tailed Correlation could find no statistically significant relationship between rates of plagiarism and year of enrolment. An ANOVA revealed no significant differences between the groups on Assignment 1. However, the Assignment 2 data confirmed a statistically significant difference (F(5.1, 219.5) = 3.1, p = .015, η2 = .02).
[image:11.594.81.511.355.605.2]Table 4 also shows the percentage reduction in the submission of plagiarised scripts between Assignments 1 and 2. This was greatest among 41-and-older students (-84.8%) and lowest among four-year-enrolled students, who recorded a meagre 9.2% reduction. Against the trend, the number of students 20 and younger plagiarising actually increased in Assignment 2 by about 18%.
Table 5: Percentage of scripts plagiarised in gender combination groups
Category Percentage of plagiarised scripts
Assignment 1 Assignment 2 % Change M%
Gender/Nationality
Female New Zealand 23.6 16.3 -30.9 20.0
Male New Zealand 24.7 14.6 -40.9 19.7
Female International 41.0 31.2 -23.9 36.1
Male International 46.3 29.7 -35.9 38.0
Gender/Study Mode
Female Distance 24.3 13.2 -45.7 18.8
Male Distance 27.1 13.6 -49.8 20.4
Female Internal 35.1 29.4 -16.2 32.3
Male Internal 36.6 24.2 -33.9 30.4
The data were recoded to explore in more detail the rates of plagiarism in gender-nationality and gender-study mode combinations (Table 5). Across the eight sub-categories, the highest average incidence of plagiarism was present among male international students (M = 38%) and the lowest among female distance students (M = 18.8%). In terms of gender-nationality, ANOVAs indicated statistically significant differences in mean plagiarism scores for Assignment 1 (F(3, 562) = 6.7, p = .000, η2 = .04) and Assignment 2 (F(3, 528) = 6.0, p = .001,
η2
differences by nationality but not by gender. A conspicuous feature of this data set is that in each of the four pairs, the men students consistently reduced the frequency of submission of plagiarised scripts by a greater percentage than women students, in three of the groups by substantial amounts. For instance, male internal students (-33.9%) reduced their plagiarism by more than double the rate of female internal students (-16.2%).
Table 6 provides an overview of the frequency of specific types of plagiarism in plagiarised scripts across the five student categories. In all categories but one, verbatim plagiarism reduced in Assignment 2. International students had the highest mean rate of sham plagiarism (M = 20.6%) and verbatim plagiarism (M = 14.8%) while students 41 or older had the lowest sham rate (M = 4.1%) and the 31-40 age range had the lowest verbatim rate (M = 4.8%). International students also had the highest rate of purloining (M = 2%) while year-one-enrolled students and those 41 and older recorded no instances. The same statistical findings apply to this data set as that in Table 4. In other words, while there were significant differences in the types of plagiarism used in terms of nationality, study mode and age, gender was not a differentiating factor, and year of enrolment was significant only to a limited extent.
Table 6: Percentages of main types of plagiarism among student groups
Category Assignment 1 % Assignment 2 % M%
Sham Verbatim Purloin Sham Verbatim Purloin Sham Verbatim Purloin
Gender
Female 13.9 14.9 1.0 11.8 7.9 1.8 12.9 11.4 1.4
Male 17.7 14.8 0.7 13.8 6.3 0.4 15.8 10.6 0.6
Nationality
New Zealand 11.5 11.8 0.6 9.5 5.6 0.3 10.5 8.7 0.5 International 22.7 19.9 1.4 18.5 9.7 2.6 20.6 14.8 2.0 Study Mode
Internal 18.7 15.6 1.5 14.9 10.1 1.6 16.8 12.9 1.6
Distance 11.7 13.8 0.0 9.8 3.1 0.4 10.8 8.5 0.2
Age
20 & younger 14.3 7.1 1.4 17.9 7.5 1.5 16.1 7.3 1.5
21-30 17.3 18.3 0.8 14.2 8.3 1.4 15.8 13.3 1.1
31-40 14.5 5.3 1.3 5.8 4.3 0.0 10.2 4.8 0.7
41 & older 5.3 13.2 0.0 2.8 0.0 0.0 4.1 6.6 0.0 Year of Enrolment
First 11.8 11.8 0.0 6.2 6.2 0.0 9.0 9.0 0.0
Second 9.9 17.6 1.1 6.1 9.8 0.0 8.0 13.7 0.6
Third 15.6 14.3 1.3 13.6 6.8 0.0 14.6 10.6 0.7
Table 7 shows the overall extent of moderate and extensive plagiarism in plagiarised scripts submitted for both assignments. Across all sub-categories, year-three-enrolled students had the highest mean rate of extensive plagiarism (M = 48.3%) but students 20 and under were not far behind (M = 47.5%). Students in the two older age categories had the lowest mean extensive plagiarism rates (31-40, M = 20.5%, 41 plus, M = 21.4%). In Assignment 1, mean rates of moderate and extensive plagiarism were almost evenly balanced at around 53% to 47% respectively. However, by Assignment 2, mean extensive plagiarism had dropped by about a third overall to around 32%. On average, around 60% of plagiarism was moderate and around 40% was extensive. In terms of all scripts submitted (N = 1098), this means that just under 16% were moderately plagiarised and just over 10% were extensively plagiarised.
Table 7: Extent of plagiarism in plagiarised scripts
Category Assignment 1 % Assignment 2 % % Change in extensive plagiarism
M%
Moderate Extensive Moderate Extensive Moderate Extensive
Overall 52.8 47.2 67.9 32.1 -32.0 60.4 39.6
Gender
Female 52.3 47.7 70.0 30.0 -37.1 61.2 38.8
Male 53.3 46.7 65.4 34.6 -25.9 59.4 40.6
Nationality
New Zealand 63.5 36.5 71.2 28.8 -21.1 67.4 32.6
International 43.0 57.0 65.0 35.0 -38.6 54.0 46.0 Study Mode
Internal 49.6 50.4 68.3 31.7 -37.1 59.0 41.0
Distance 59.0 41.0 66.7 33.3 -18.8 62.9 37.1
Age
20 & younger 43.8 56.2 61.1 38.9 -30.8 52.5 47.5
21-30 49.6 50.4 68.6 31.4 -37.7 59.1 40.9
31-40 87.5 12.5 71.4 28.6 +128.8 79.5 20.5
41 & older 57.1 42.9 100.0 00.0 -100 78.6 21.4 Year of Enrolment
First 50.0 50.0 100.0 00.0 -100 75.0 25.0
Second 38.5 61.5 69.2 30.8 -49.9 53.9 46.1
Third 50.0 50.0 53.3 46.7 -6.6 51.7 48.3
Fourth 54.3 45.7 82.1 17.9 -60.8 68.2 31.8
In general, extensive plagiarism dropped most among year-one-enrolled students and those 41 and older, who managed a reduction of 100%. The smallest reduction was evident among year-three-enrolled students, a meagre 6.6%. The anomalous 128% increase in extensive plagiarism in the 31-40 age group was due to a halving in the sub-sample size in Assignment 2, the number of extensively plagiarised scripts staying the same as in the first assignment. It was also noted that of the 6.5% of students (N = 37) who submitted the first assignment but not the second, 17 (46%) had plagiarised in the first assignment, and in 12 instances the plagiarism was extensive. In contrast with the previous data sets, statistical tests revealed few significant differences within the categories in terms of plagiarism extent. Gender, study mode and year of enrolment were not identified as significant variables in either of the assignments. Both nationality (p < .01, η2 = .04) and age group (F(3, 174) = 3.0, p = .03, η2 = .05) displayed significance on Assignment 1 only.
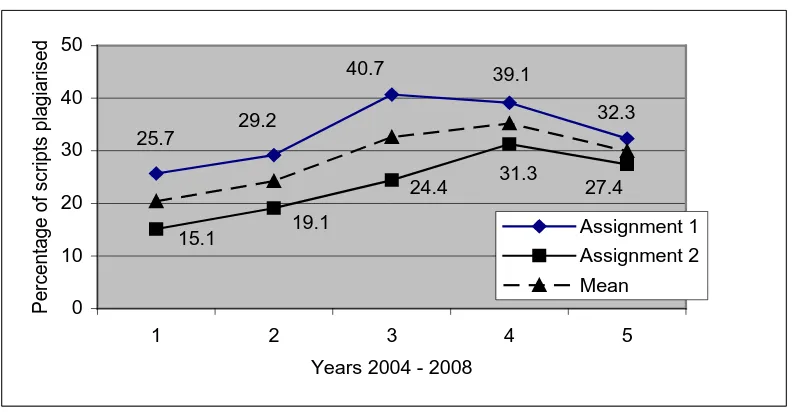
Figure 1: Plagiarism trend over five years
Figure 1 presents the plagiarism trend over the five-year period of the study, the upper trend line denoting Assignment 1 and the lower, Assignment 2. It can be seen that, from a start of 25.7%, the percentage of scripts that contained plagiarism in Assignment 1 rose to 40.7% in the third year, then fell back to finish at 32.3% in the fifth year, an overall rise of 25.7%. The trend was similar for Assignment 2, rising from 15.1% in the first year to 31.3% in the fourth year, then falling back in the fifth year to 27.4%, representing an overall rise of 81.5%
40.7 39.1
25.7 29.2
32.3
15.1 19.1
24.4 31.3 27.4
0 10 20 30 40 50
1 2 3 4 5
Years 2004 - 2008
P
er
c
ent
age
of
s
c
ript
s
plagiar
is
ed
Assignment 1
Assignment 2
Discussion
Research question1
What is the frequency of plagiarism in a university assignment, in aggregate and in terms of individual student categories?
On average, just over a quarter of the assignments submitted contained plagiarism. The belief that student plagiarists tend to be males was not supported by the findings. In terms of the five student variables, gender, nationality, study mode, age and year of enrolment, gender was shown to have no significant influence on whether students plagiarised or not. On average, males turned in only slightly more plagiarised scripts than females. Even when the data were broken down into gender combinations, no statistically significant differences based on gender could be demonstrated, males actually submitting fewer plagiarised scripts than females on two combinations. However, nationality, study mode and age each emerged unequivocally as statistically significant factors in student plagiarism, while year of enrolment was significant to a limited extent.
The findings confirmed the view that international students have higher rates of plagiarism than domestic students. Not only did they have the highest rates across student categories, they also topped the ratings where verbatim plagiarism - outright copying - is concerned, and were among the student categories with the highest rates of extensive plagiarism. Views about the age of typical plagiarists were also substantiated, since younger students tended to plagiarise more frequently than older students and to a considerably greater extent. But, contrary to expectations, students 20 years and younger plagiarised less than students in the 21-30 age bracket, who also had the highest rates of verbatim plagiarism. The belief that distance students are more likely to plagiarise was clearly refuted by the findings reported here. Not only did they plagiarise to a significantly lesser degree than internal students, they also had relatively low rates of verbatim and extensive plagiarism.
From the data presented here, then, it is possible to produce a tentative profile of a student most at risk of plagiarising an assignment for this particular sample. Based on the categories examined, a plagiarising student is either male or female, an international student, studying internally, aged 21-30 and possibly in the fourth year of enrolment at university. Meanwhile, the profile of a student least likely to hand in plagiarised work is either male or female, a domestic student, studying in distance mode, aged 41 or over and possibly in the first year of enrolment.
Research question2
What is the nature of plagiarism in a university assignment in terms of the type and the extent?
The findings showed that sham plagiarism was slightly more prevalent than verbatim plagiarism in Assignment 1. However, in Assignment 2 a shift occurred and the verbatim plagiarism rate more than halved. On being challenged by the lecturer, therefore, students presumably were redrafting the affected material and applying the same principles to new material. However with few exceptions, there was no dramatic drop in the rate of sham paraphrasing. What appears to have happened in many cases is that students cited for verbatim plagiarism in Assignment 1 merely appended a source citation to a plagiarised passage, but made no other changes. This implies either a misunderstanding of proper citing procedures or, perhaps more importantly, an inability to engage cognitively with the context of the plagiarised material in question. The highest rates of all three types of plagiarism were prevalent among international students, but students in their fourth year of enrolment also had comparatively high rates for all three types. Students with the lowest rates of sham and verbatim plagiarism tended to be in the older age groups, while purloining was least prevalent among the newly-enrolled and older students.
Research question 3
In terms of the frequency, type and extent of plagiarism in a university assignment, does student behaviour change between assignments?
The findings confirmed that students appear to alter their behaviour from one assignment to the next when made aware of plagiarism in the first assignment. With the exception of only the under-20 sub-category, fewer plagiarised scripts were submitted for Assignment 2 than for Assignment 1 and there were statistically significant differences between the plagiarism means. This implies that the lecturer comments in assessment feedback reports and plagiarism awareness actions appear to have had some effect. However, given the amount of awareness raising about plagiarism, greater reductions should have been forthcoming. For instance, students in their fourth year of enrolment, that is, rather experienced students, achieved a reduction of only 9%. Internal student plagiarism dropped by only a quarter. In other words, most students in these categories disregarded the lecturer’s advice and continued to plagiarise. Where capacity to change is concerned, males, older students, distance students and novice students were among the most responsive. In their respective categories, the 41 and older age group was most responsive, as were students in their first year of enrolment. The gender combination data showed that male students consistently achieved better rates of plagiarism reduction than their female counterparts, implying a more effective response to lecturer feedback. Although student propensity to plagiarise did, therefore, moderate somewhat, the extent of the reduction in plagiarism between assignments was not nearly as far-reaching as it should have been, under the circumstances.
Research question 4
Is the use of Turnitin a deterrent to plagiarising among university students?
with educational norms and conventions, appeared to have little or no deterrent effect – in fact the opposite seems to be true. Why should this be? There are a number of possible explanations.
First, the lecturer’s message about plagiarism and the potential of Turnitin to identify plagiarism may have been ineffective. Merely informing students about plagiarism both in writing and face-to-face may not be enough and other, more practical methods may be required, such as the student peer marking task run by Ledwin and Risquez (2008).
Second, some students may have given only superficial attention to their studies. Students frequently have to take part time or even full time jobs to support themselves during study. Since attendance at class was not compulsory, it would have been easy to lose touch with the mainstream direction of the programme. A certain section of the class, therefore, may simply have failed to digest or even to ‘tune into’ publicity about Turnitin and therefore did not fully appreciate its potential. Nor might they have bothered to read or act on, the lecturer's feedback on the first assignment.
Third, the remainder of Park’s (2003) descriptors of potential plagiarists might be considered as germane. Did those students who plagiarised believe that they would not be found out? However, it is a mystery why the plagiarising students in this study would think this unless they were ignorant of the possibilities of Turnitin. Did students plagiarise because they found the subject matter of the course uninteresting? Over the five years of the study, independent audits of student opinion of course quality were regularly conducted by the university authorities. Results were consistently very positive about this aspect of the course. Clear answers to these questions, and to those about other descriptors such as lack of confidence, low academic ability and other personal factors, are hard to determine without further research.
Fourth, students may not have believed that, even if Turnitin did detect their plagiarism, the university would take serious action against them. So the risk was worth the gamble. This could be compounded by a ‘fuzzy’ university policy on plagiarism which does not spell out in clear terms what kind of sanctions will be imposed for specific, proven, types of plagiarism, nor makes examples of students involved in the worst cases of plagiarism.
Fifth, international students have an added burden due to language difficulties and problems adapting to a new national and study culture. Comprehension difficulties might have meant they did not fully grasp the significance of plagiarism and/or the potential of software to detect it. However, such an explanation is rather hard to accept. International students enrolled at New Zealand universities must have satisfied a required entry standard in an international English language proficiency test such as IELTS. At least some, possibly a majority of, international students would have completed academic writing courses, which often include modules on plagiarism and its avoidance. Anecdotally, second-language students are actually more aware, if anything, than native speakers of the issue of plagiarism in their university work. This last point is attested to by the fact that almost two-thirds of the international students in the sample, on average, did not plagiarise at all, many of whom obviously put much effort into adhering to the rules by producing assignments characterised not only by good citing and referencing of sources but also by effective paraphrasing of source material.
network resulting in faster, cheaper and more widely available broadband. Furthermore, the university rolled out an extensive IT upgrade, which saw a sharp increase in student workstations - in the central library alone a near 800% increase - and a campus wireless network. There was a proliferation of inexpensive laptops that allowed students to access the Internet any time, and at multiple campus locations. This seamless meshing of study and the Internet meant that not only were students enjoying far better Internet access, they were becoming personally more totally integrated into an IT environment.
Although deterrence of plagiarism is an important issue, it is only one of the functions of plagiarism software. A key feature of software like Turnitin is that it can enable a fairer and more accurate assessment of student work, particularly in terms of determining originality and the nature of sources. Most students do not plagiarise, but make an honest attempt to submit original work that is the product of their own efforts. When plagiarism goes undetected, the students responsible devalue the work of honest students. While such a phenomenon may be merely irksome at an operational level, when extrapolated to the entire student output of an academic institution, upon which the reputation of the institution’s qualifications depends, it is not hard to see how important it is that student work be truly representative of student abilities and that lecturer assessments of student work should be accurate.
Rather than poisoning the relationship between lecturer and student, as has been alleged, software like Turnitin – depending how it is implemented and used – might actually foster trust between the two groups. This is because the lecturer can have far more confidence that their assessment of a student assignment is accurate and that students are in fact worthy of the grade they assign their work. Students, on the other hand, who know they have submitted original work, should be confident to have their work vetted by Turnitin, in the expectation that they are going to get a fair assessment. Furthermore, the documentation created by Turnitin, such as the originality report, can provide a useful paper trail for both student and lecturer in subsequent discussions about a particular assignment submission. Finally, the tools that add functionality to Turnitin support formative actions such as peer marking that can foster among students a better understanding of plagiarism (Dahl 2007, Ledwin and Risquez 2008).
Conclusions
The research described here attempted to fill a gap in the plagiarism literature by generating empirical data on the frequency, type and extent of student Internet plagiarism in a university assignment, based on numerical and statistical analysis, and not on assumptions, guesswork, or student self-reports. Some common assertions about the nature of plagiarism were supported but others were not. International students, for instance, were more prone to plagiarism than domestic students. Younger students tended to plagiarise more than older students. Students did moderate their behaviour between assignments to some extent when challenged about their plagiarising behaviour. However, no evidence was found that men plagiarise significantly more than women. Distance students plagiarised less than internal students. More experienced students appeared to plagiarise more than their novice counterparts, implying the existence of a plagiarism learning effect the longer students are in a tertiary environment. Plagiarism did not decrease as awareness about it became more widespread; it increased. The findings suggested, finally, that Turnitin was not a deterrent to plagiarism.
century unavoidably possess, they themselves have become an integral and interactive component of the virtual environment of the Internet. It is therefore not surprising how readily and how naturally they are prepared to borrow material from the Internet to enhance, complement or even entirely comprise their university work.
This study attempted to settle some of the big questions about the frequency, nature and extent of student plagiarism. No claim is made at this stage for the generalisability of the findings, given the obvious world-wide differences in tertiary strategies, curricula and study climates, not to mention national cultures. It is hoped, however, that the findings will provide researchers with some comparable, empirical data, which may assist with future research of this type in other tertiary jurisdictions. Most of the obvious questions thrown up by the study begin with the word "why". For instance, why do students still plagiarise in the face of massive publicity about plagiarism and the efficacy of plagiarism detection tools? Why do more experienced students plagiarise more? Why does Turnitin not appear to deter plagiarism? Further research is required to provide answers to such questions.
Note
References
Ashworth, P., P. Bannister, and P. Thorne. 1997. Guilty in whose eyes? University students’ perceptions of cheating and plagiarism in academic work and assessment. Studies in Higher Education 22, no. 2: 187-203.
Badge, J. L., A.J. Cann, and J. Scott. 2007. To cheat or not to cheat? A trial of the JISC plagiarism detection service with biological sciences students. Assessment and Evaluation in Higher Education 32, no. 4: 433-439.
Brown, B. S. 1995. The academic ethics of business graduates: A survey. Journal of Education for Business 70, no. 3: 151-156.
Bugeja, M. 2004. Don’t let students “overlook” Internet plagiarism. The Education Digest 70, 2: 37-43.
Cohen, J. 1988. Statistical power analysis for the behavioural sciences. Hillsdale, NJ: Erlbaum. Colvin, B. B. 2007. Another look at plagiarism in the digital age: Is it time to turn in my badge?
Lecturing English in the Two-Year College 35, no. 2: 149-158.
Compton, J., and M. Pfau. 2008. Inoculating against pro-plagiarism justifications: Rational and affective strategies. Journal of Applied Communication Research 36, no. 1: 98-119. Dahl, S. 2007. Turnitin: The student perspective on using plagiarism detection software. Active
Learning in Higher Education 8, no. 2: 173-191.
Evans, R. 2006. Evaluating an electronic plagiarism detection service. Active Learning in Higher Education 7, no. 1: 87-99.
Foster, A. L. 2002. Plagiarism-detection tool creates legal quandary. Chronicle of Higher Education 48, no. 36: A37-38.
Hawley, C. S. 1984. The thieves of academe. Improving College and University Lecturing 32, no. 1: 35-39.
Karlins, M., C. Michaels and S Podlogar. 1988. An empirical example of actual cheating in a large sample of undergraduates. Research in Higher Education 29, no. 4: 359-364. Ledwith, A., and A. Risquez. 2008. Using anti-plagiarism software to promote academic
honesty in the context of peer reviewed assignments. Studies in Higher Education 33, no. 4: 371-384.
Ma, H. J., G. Wan, and E.Y Lu. 2008. Digital cheating and plagiarism in schools. Theory Into Practice 47, no. 3: 197-203.
Macdonald, R., and J. Carroll. 2006. Plagiarism – a complex issue requiring a holistic institutional approach. Assessment and Evaluation in Higher Education 31, no. 2: 233-245.
McKeever, L. 2006. Online plagiarism detection services – saviour or scourge? Assessment and Evaluation in Higher Education 31, no. 2: 155-165.
McLafferty, C. L., and K. M. Foust. 2004. Electronic plagiarism as a college instructor’s nightmare – prevention and detection. Journal of Education for Business 79, no. 3: 186-189.
Newstead, S. E., A. Franklyn-Stokes, and P. Armistead. 1996. Individual differences in student cheating. Journal of Educational Psychology 88, no. 2: 229-241.
Park, C. 2003. In other (people’s) words: Plagiarism by university students – literature and lessons. Assessment and Evaluation in Higher Education 28, no. 5: 471-488.
Pickard, J. 2006. Staff and student attitudes to plagiarism at University College, Northampton. Assessment and Evaluation in Higher Education 31, no. 2: 215-232.
Robelen, E. W. 2007. Online anti-plagiarism service sets off court fight. Education Week 26, no. 36: 1-3.
Robinson-Zañartu, C., E. D. Peña, V. Cook-Morales, A. M. Peña, R. Afshani, and L. Nguyen. 2005. Academic crime and punishment: Faculty members’ perceptions of and responses to plagiarism. School Psychology Quarterly, 20, 3: 318-337.
Scanlon, P. M. 2003. Student online plagiarism: How do we respond? College Lecturing 51, no. 4: 161-165.
Scanlon, P. M., and D. R. Neumann. 2002. Internet plagiarism among college students. Journal of College Student Development 43, no. 3: 374-385.
Scurrah, W. L. 2001. Plagiarism, enclosure, and the commons of the mind. Paper presented at the annual meeting of the Conference on College Composition and Communication, March: 14-17, in Denver, CO.
Sterngold, A. 2004. Confronting plagiarism: How conventional teaching invites cyber-cheating. Change 36, no. 3: 16-21.
Walker, J. 1998. Student plagiarism in universities: What are we doing about it? Higher Education Research and Development 17, no. 1: 89-106.
Warn, J. 2006. Plagiarism software: No magic bullet. Higher Education Research and Development 25, no. 2: 195-208.
Wasley, P. 2008. Anti-plagiarism software takes on the honor code. Chronicle of Higher Education 54, no. 25: A12.
Wilhoit, S. 1994. Helping students avoid plagiarism. College Lecturing 42, no. 4: 161-164. Williams, B. T. 2008. Trust, betrayal and authorship: Plagiarism and how we perceive students.
Journal of Adolescent and Adult Literacy 51, no. 4: 350-354.
Yeo, S., and R. Chien. 2007. Evaluation of a process and proforma for making consistent decisions about the seriousness of plagiarism incidents. Quality in Higher Education 13, no. 2: 187-204.
Young, J.R. 2008. Judge rules plagiarism-detection tool falls under ‘fair use’. Chronicle of Higher Education 54, no. 30: A13.
MASSEY UNIVERSITY
MASSEY RESEARCH ONLINE http://mro.massey.ac.nz/
Massey Documents by Type Journal Articles
Measuring plagiarism: Researching what
students do, not what they say they do
Walker, John
2009-11-17
http://hdl.handle.net/10179/9738