A model for improvement of water heating heat exchanger designs for residential heat pump water heaters : a thesis presented in fulfilment of the requirement for the degree of Master of Engineering at Massey University, Palmerston North, New Zealand
189
0
0
Full text
(2) A model for Improvement of Water Heating Heat Exchanger Designs for Residential Heat Pump Water Heaters. A thesis presented in fulfillment of the requirement for the degree of Master of Engineering at Massey University Palmerston North, New Zealand. Weerawoot Arunwattana B.Sc. in Applied Physics M.Sc. in Thermal Technology 2010.
(3) ABSTRACT. Heat pump water heaters are a promising technology to reduce energy use and greenhouse gas emissions. A key component is the water heating heat exchanger. Two multi-zone models of the double-wall counter-current flow heat exchanger (condenser and gas cooler models) for residential air-source heat pump water heaters were developed. These models were validated against available data in the open literature. They predicted heat exchanger size within -0.8% for a HFC-134a (with oil) condenser and within -14% for a CO2 gas cooler. The multi-zone model was significantly more accurate than one and three zone models. The models for a R410A subcritical heat pump and a CO2 transcritical heat pump were used to investigate the effect of key design parameters by varying water or refrigerant flow channel size for three water heating heat exchanger configurations: circular tube-in-tube, flat tube-on-tube, and twisted tube-in-tube. For the circular tube-in-tube configuration, refrigerant flow in the annulus (case B) performed better than refrigerant flow in the inner tube. The optimal flow channels for the circular tube-in-tube configuration case B with 0.1 mm thick air gap in the double wall were found to be d i (inside diameter of the 1st tube) of 8 mm and annulus [ Di (inside diameter of the 3rd tube) − d 2 (outside diameter of the 2nd tube)] of 1.5 mm for R410A and d i of 7 mm and Di − d 2 of 1.0 mm for R744. The optimal flow channels for the flat tube-on-tube configuration with b1i (major length of the refrigerant flow channel) and b2 i (major length of the water flow channel) both of 9 mm were found to be a1i (minor length of the refrigerant flow channel) and. a2i (minor length of the water flow channel) of 1.5 mm for R410A and a1i of 1 mm and a2 i of 1.5 mm for R744. The optimal flow channels for the twisted tube-in-tube configuration were found to be d i of 7.94 mm and d1 (original inside diameter of twisted tube) of 12.7 mm for R410A and d i of 6.35 mm and d1 of 9.525 mm for R744. At the optimal flow channel size in each configuration, heat exchanger weight of the flat tube-on-tube was lower than the circular tube-in-tube by about 34.4% for R410A and by about 66.6% for R744. This was mainly due to elimination of the air gap resistance with the tube-on-tube configuration. Heat exchanger length, weight, and pumping power of the twisted tube-in-tube with 94% contact were significantly lower than the flat tube-on-tube by about 85%, 62%, and 97% respectively for R410A and by about 65%, 35.7%, and 98% respectively for R744. Overall, the flat tube-ontube and the twisted tube-in-tube configurations are most promising for the water heating heat exchanger in terms of the lowest investment and running costs respectively.. i.
(4) ACKNOWLEDGMENT. Thanks in particular to my Supervisor Prof. Don Cleland and Dr. Jianfeng Wang (School of Engineering and Advanced Technology (SEAT) Massey University, NZ) for guiding the project. Thanks to Ministry of Science and Technology, Thailand for supporting a scholarship. Thanks to Prof. Eckhard A. Groll and Prof. Somchai Wongwises for helping on experimental data.. ii.
(5) CONTENTS. ABSTRACT ACKNOWLEDGMENT CONTENTS LIST OF FIGURES LIST OF TABLES. i ii iii vi x. 1. INTRODUCTION. 1. 2. LITURATURE REVIEW 2.1 Hot Water Heating 2.1.1 Requirements for hot water 2.1.2 Energy consumption 2.1.3 Hot water supply systems 2.2 The Type of Domestic Hot Water Heaters 2.2.1 Conventional storage hot water heaters 2.2.2 Alternative hot water heaters 2.3 Heat Pump System 2.3.1 Air-source heat pump systems 2.3.2 Ground-source heat pump systems 2.3.3 Water-source heat pump systems 2.3.4 Heat pump efficiency 2.4 The Types of Air-Source Heat Pump Water Heaters 2.4.1 Integral unit 2.4.2 Standalone unit 2.5 Vapour Compression Cycles 2.5.1 Subcritical cycles 2.5.2 Transcritical vapour compression cycles 2.6 Other Heat Pump Cycles 2.7 Standards 2.7.1 Standard for the air-source heat pump water heaters 2.7.2 Standard for the heat exchangers 2.8 Refrigerants 2.9 Heat Exchangers for Domestic Hot Water Heating 2.10 Flow Passage 2.11 Heat Exchanger Optimization 2.12 Prediction of Heat Transfer Coefficients and Pressure Drops 2.12.1 Subcritical cooling processes 2.12.1.1 Single-phase flow regions 2.12.1.1.1 Conventional channels with/without fin 2.12.1.1.2 Micro channels 2.12.1.1.3 Curved tubes 2.12.1.2 Condensation (Two phase) flow regions 2.12.1.2.1 Flow maps 2.12.1.2.2 Heat transfer and pressure drop correlations without oil 2.12.1.2.2.1 Conventional channels 2.12.1.2.2.2 Micro-fin channels. 3 3 3 4 7 8 8 10 11 12 12 14 15 16 16 16 18 18 20 23 25 25 26 26 29 32 32 34 34 34 34 36 37 42 42. iii. 44 45 46.
(6) 2.12.1.2.2.3 Micro channels 2.12.1.2.3 Effect of lubricating oil 2.12.2 Transcritical cooling processes 2.12.2.1 CO2 cooling processes without oil 2.12.2.2 Effect of lubricating oil 2.13 Conclusions. 48 49 57 57 58 62. 3. OBJECTIVES. 65. 4. MODELING 4.1 Multi-Zone Model of Water Heating Heat Exchangers 4.1.1 General zone model 4.1.2 Boundary zones 4.1.3 Prediction of heat transfer coefficients and pressure drops of fluid flow without oil in or on smooth tubes 4.1.3.1 Refrigerant side 4.1.3.1.1 Subcritical process 4.1.3.1.1.1 De-superheating region 4.1.3.1.1.2 Transition between de-superheating and condensing 4.1.3.1.1.3 Condensing region 4.1.3.1.1.4 Transition between condensing and sub-cooling 4.1.3.1.1.5 Sub-cooling region 4.1.3.1.2 Supercritical cooling process 4.1.3.2 Water side 4.1.4 Prediction of heat transfer coefficients and pressure drops of fluid flow without oil in or on enhanced tubes 4.1.5 Effect of oil 4.1.6 Configurations of double wall heat exchanger 4.1.6.1 Configuration I: Smooth circular tube-in-tube with small air gap 4.1.6.2 Configuration II: Flat tube-on-tube 4.1.6.3 Configuration III: Twisted tube-in-tube with small air gap 4.2 Vapour Compression Heat Pump Cycle Model 4.2.1 Compressor model 4.2.2 Discharge line model 4.2.3 Expansion model 4.2.4 Evaporator model 4.2.5 Suction line mode 4.2.6 Coefficient of performance and pumping power 4.2.7 Water pump effect 4.3 Calculation Procedure 4.4 Three-Zone Model of Condenser 4.5 One-Zone model of Gas Cooler 4.6 Number of Zones and Accuracy. 66 66 66 70. iv. 70 70 70 70 72 73 76 76 76 78 80 81 81 81 82 83 88 88 89 90 90 91 92 92 93 95 98 100.
(7) 5. MODEL VALIDATION 5.1 Introduction 5.2 Condensation Flow in Horizontal Smooth Tube of Pure Alternative Refrigerants 5.2.1 Heat transfer correlation validation 5.2.2 Pressure drop correlation validation 5.3 Supercritical Flow in Horizontal Smooth Tube for CO2 5.3.1 Heat transfer correlation validation 5.3.2 Pressure drop correlation validation 5.4 Validation of Water Heating Heat Exchanger Models 5.4.1 Available data 5.4.2 Condenser model validation 5.4.3 Gas cooler model validation. 102 102 107 107 109 109 110 111 112 112 114 115. 6. HEAT EXCHANGER DESIGN USING THE MODEL 6.1 Design Conditions 6.2 Criteria for Comparison of Heat Exchanger Design 6.3 Configuration I Design 6.3.1 Effects of flow channel dimensions 6.3.1.1 Configuration I design for case A 6.3.1.1.1 Water flow channel dimensions 6.3.1.1.2 Refrigerant flow channel dimensions 6.3.1.2 Configuration I design for case B 6.3.1.2.1 Water flow channel dimensions 6.3.1.2.2 Refrigerant flow channel dimensions 6.4 Configuration II Design 6.4.1 Effects of flow channel dimensions 6.4.1.1 Water flow channel dimensions 6.4.1.2 Refrigerant flow channel dimensions 6.5 Configuration III Design 6.5.1 R-410A design 6.5.2 R-744 design 6.6 Summary. 117 117 117 118 118 118 118 120 125 125 127 132 132 132 134 138 138 142 145. 7. CONCLUSION AND RECOMMENDATION. 146. REFERENCES. 148. NOMENCLATURE. 158. APPENDIX A1 Software Program for Condenser Design in EES A2 Software Program for Gas cooler Design in EES. 162 162 173. v.
(8) LIST OF FIGURES Figure 2.1: Map of hot water consumption by household by country 3 Figure 2.2: Global primary energy consumption 4 Figure 2.3: Map of global primary energy supply 4 Figure 2.4: The map of the annual CO2 emissions in 2006 5 Figure 2.5: CO2 emissions by sector 5 Figure 2.6: The electricity energy use in New Zealand in 2006 6 Figure 2.7: Energy use in New Zealand households 6 Figure 2.8: Diagram of hot water supply systems 7 Figure 2.9: Sankey diagram for energy loss in hot water supply system 8 Figure 2.10: An electrical storage hot water heater 9 Figure 2.11: A gas storage hot water heater 9 Figure 2.12: The principle of the heat pump system 12 Figure 2.13: A classical air-source vapor compression heat pump system 13 Figure 2.14: A ground-source vapor compression heat pump system 14 Figure 2.15: A classical water-source vapor compression heat pump system 15 Figure 2.16: Schematic diagram of multi-pass heat pump water heating system 17 Figure 2.17: Schematic diagram of one-pass heat pump water heating system 17 Figure 2.18: Subcritical vapour compression cycle on mollier diagram 18 Figure 2.19: Temperature difference profile in a condenser of a subcritical cycle 19 Figure 2.20: Trnascritical cycle on moliar diagram 21 Figure 2.21: Temperature difference profile of gascooler 21 Figure 2.22: An absorption system 23 Figure 2.23: Simplified layout of the Brayton heat pump system 24 Figure 2.24: Ozone depletion potential (ODP) contrasted to global warming potential (GWP) for key single-compound refrigerants 28 Figure 2.25: A tube-in-tube double wall heat exchanger 30 Figure 2.26: A tube-on-tube double wall heat exchanger 30 Figure 2.27: Temperature difference between the refrigerant and the water in the condenser for countercurrent and concurrent configurations 31 Figure 2.28: Temperature difference between the refrigerant and the water in the gascooler for countercurrent and concurrent configurations 31 Figure 2.29: Methodology for heat exchanger optimization 33 Figure 2.30: Flow regimes typically encountered in condensation processes 43 Figure 2.31: The flow regime map of Mandhane et al. (1974) 43 Figure 2.32: Flow regime map of Taitel-Dukler (1976) for horizontal flow with both phases flowing turbulently 44 Figure 4.1: A general zone in the multi-zone model of a double wall heat exchanger 66 Figure 4.2: Circular tube-in-tube with small air gap 81 Figure 4.3: Flat oval tube-on-tube 82 Figure 4.4: Twisted tube-in-tube with small air gap 83 Figure 4.5: Possible twisted tube if small difference in size between the 1st and 2nd tubes 84 Figure 4.6: Possible twisted tube if big difference in size between the 1st and 2nd tubes 85 Figure 4.7: Dimension of twisted tube ( d = d1 ) 85 Figure 4.8: Dimension of twisted tube with 100%contact 86. vi.
(9) Figure 4.9: Relationship between inside radius of twisted tube and %contact Figure 4.10: Dimension of twisted tube for outside wall Figure 4.11: Vapor compression heat pump cycle model Figure 4.12: Three zone model of condenser Figure 4.13: One zone model of gas cooler Figure 4.14: The systematic accuracy of calculation Figure 4.15: Accuracy and calculation time for the subcritical cooling model as a function of number of zones Figure 4.16: Accuracy and calculation time for the super-critical cooling model as a function of number of zones Figure 5.1: Predicted heat transfer coefficients against with the experimental data at G = 200 kg/m2s Figure 5.2: Predicted heat transfer coefficients against with the experimental data at G = 400 kg/m2s Figure 5.3: Predicted heat transfer coefficients against with the experimental data at G = 750 kg/m2s Figure 5.4: Predicted pressure gradient by Zhang and Webb’s correlation against with the experimental data Figure 5.5: Predicted heat transfer coefficient against with the experimental data at G = 200 kg/m2 s, P = 8 MPa, di = 6 mm Figure 5.6: Predicted heat transfer coefficient against with the experimental data at G = 400 kg/m2 s, P = 8 MPa, di = 6 mm Figure 5.7: Predicted heat transfer coefficient against with the experimental data at G = 800 kg/m2 s, P = 8 MPa, di = 4 mm Figure 5.8: Predicted heat transfer coefficient against with the experimental data at G = 800 kg/m2 s, P = 10 MPa, di = 4 mm Figure 5.9: Predicted pressure drop against with the experimental data at G = 800 kg/m2 s, P = 8 MPa, di = 2 mm Figure 5.10: Temperature profiles along the condenser Figure 5.11: Schematic of the test apparatus Figure 5.12: Temperature profiles along the gascooler Figure 6.1: Water flow channel effect of configuration I on pressure drop and heat transfer coefficient for case A Figure 6.2: Water flow channel effect of configuration I on length and heat transfer surface of heat exchanger for case A Figure 6.3: Water flow channel effect of configuration I on weight of heat exchanger for case A Figure 6.4: Water flow channel effect of configuration I on pumping power and COP of the system for case A Figure 6.5: Refrigerant flow channel effect of configuration I on refrigerant pressure drop and heat transfer coefficient for R410A case A Figure 6.6: Refrigerant flow channel effect of configuration I on refrigerant pressure drop and heat transfer coefficient for R744 case A Figure 6.7: Refrigerant flow channel effect of configuration I on LMTD for R410A case A Figure 6.8: Refrigerant flow channel effect of configuration I on LMTD for R744 case A Figure 6.9: Refrigerant flow channel effect of configuration I on length and heat transfer surface of heat exchanger for R410A case A. vii. 87 87 88 95 98 100 100 101 108 108 108 109 110 110 111 111 112 114 115 116 119 119 120 120 121 122 122 122 123.
(10) Figure 6.10: Refrigerant flow channel effect of configuration I on weight of heat exchanger for R410A case A Figure 6.11: Refrigerant flow channel effect of configuration I on length and heat transfer surface of heat exchanger for R744 case A Figure 6.12: Refrigerant flow channel effect of configuration I on weight of heat exchanger for R744 case A Figure 6.13: Refrigerant flow channel effect of configuration I on pumping power and COP for R410A case A Figure 6.14: Refrigerant flow channel effect of configuration I on pumping power and COP for R744 case A Figure 6.15: Water flow channel effect of configuration I on pressure drop and heat transfer coefficient for case B Figure 6.16: Water flow channel effect of configuration I on length and heat transfer surface of heat exchanger case B Figure 6.17: Water flow channel effect of configuration I on weight of heat exchanger for case B Figure 6.18: Water flow channel effect of configuration I on pumping power and COP for case B Figure 6.19: Refrigerant flow channel effect of configuration I on refrigerant pressure drop and heat transfer coefficient for R410A case B Figure 6.20: Refrigerant flow channel effect of configuration I on refrigerant pressure drop and heat transfer coefficient for R744 case B Figure 6.21: Refrigerant flow channel effect of configuration I on LMTD for R410A case B Figure 6.22: Refrigerant flow channel effect of configuration I on LMTD for R744 case B Figure 6.23: Refrigerant flow channel effect of configuration I on length and heat transfer surface of heat exchanger for R410A case B Figure 6.24: Refrigerant flow channel effect of configuration I on length and heat transfer surface of heat exchanger for R744 case B Figure 6.25: Refrigerant flow channel effect of configuration I on weight of heat exchanger for R410A case B Figure 6.26: Refrigerant flow channel effect of configuration I on weight of heat exchanger for R744 case B Figure 6.27: Refrigerant flow channel effect of configuration I on pumping power and COP for R410A case B Figure 6.28: Refrigerant flow channel effect of configuration I on pumping power and COP for R744 case B Figure 6.29: Water flow channel effect of configuration II on pressure drop and average HTC for R-410A Figure 6.30: Water flow channel effect of configuration II on length and mean HTA for R410A Figure 6.31: Water flow channel effect of configuration II on weight of heat exchanger for R410A Figure 6.32: Water flow channel effect of configuration II on pumping power and COP of the system Figure 6.33: Refrigerant flow channel effect of configuration II on pressure drop and average HTC for R-410A Figure 6.34: Refrigerant flow channel effect of configuration II on pressure drop and average HTC for R-744. viii. 123 123 124 124 125 126 126 126 127 127 128 128 128 129 129 130 130 130 131 132 133 133 133 134 134.
(11) Figure 6.35: Refrigerant flow channel effect of configuration II on LMTD for R410A Figure 6.36: Refrigerant flow channel effect of configuration II on LMTD for R744 Figure 6.37: Refrigerant flow channel effect of configuration II on length and mean HTA for R410A Figure 6.38: Refrigerant flow channel effect of configuration II on length and mean HTA for 744 Figure 6.39: Refrigerant flow channel effect of configuration II on weight of heat exchanger for R410A Figure 6.40: Refrigerant flow channel effect of configuration II on weight of heat exchanger for R744 Figure 6.41: Refrigerant flow channel effect of configuration II on pumping power and COP for R410A system Figure 6.42: Refrigerant flow channel effect of configuration II on pumping power and COP for R744 system Figure 6.43: Relationship between %contact and inside diameter of twisted tube having d1 = 12.7 mm for R410A Figure 6.44: Relationship between %contact and inside diameter of twisted tube having d1 = 15.875 mm for R410A Figure 6.45: %contact effect on heat exchanger length and mean heat transfer surface area for R410A Figure 6.46: %contact effect on heat exchanger weight area for R410A Figure 6.47: %contact effect on refrigerant heat transfer coefficient for R410A Figure 6.48: %contact effect on average LMTD for R410A Figure 6.49: %contact effect on pumping power (EP) and COP for R410A Figure 6.50: Relationship between %contact and inside diameter of twisted tube having d1 = 9.525 mm for R744 Figure 6.51: Relationship between %contact and inside diameter of twisted tube having d1 = 12.7 mm for R744 Figure 6.52: %contact effect on heat exchanger length and mean heat transfer surface area for R744 Figure 6.53: %contact effect on heat exchanger weight area for R744 Figure 6.54: %contact effect on refrigerant heat transfer coefficient for R744 Figure 6.55: %contact effect on average LMTD for R744 Figure 6.56: %contact effect on pumping power (EP) and COP for R744. ix. 135 135 136 136 136 137 137 137 139 139 140 140 140 141 141 142 142 143 143 143 144 144.
(12) LIST OF TABLES Table 2.1: The comparison of some characteristics between instantaneous and storage systems Table 2.2: The comparison of some characteristics between the electrical and gas heaters Table 2.3: Comparison of life-cycle costs for different hot water systems Table 2.4: The thermodynamic properties of none-ozone depleting potential refrigerants Table 2.5: Comparison of some characteristics among CFCs, HFCs, and natural Refrigerants Table 2.6: Single phase heat transfer correlations without oil Table 2.7: Single phase pressure drop correlations without oil Table 2.8: Two phase heat transfer correlations without oil Table 2.9: Two phase pressure drop correlations without oil Table 2.10: Transcritical heat transfer correlations without oil Table 2.11: Transcritical pressure drop correlations without oil Table 5.1: Specification of test tubes for condensation heat transfer in/on smooth tube Table 5.2: Specification of test tubes for condensation pressure drop in/on smooth tube Table 5.3: Specification of test tubes for cooling heat transfer and pressure drop of supercritical carbon dioxide Table 5.4: Accuracy for sensors and parameters (Cavallini et al., 2001) Table 5.5: Accuracy for sensors and parameters (Dang and Hihara, 2004) Table 5.6: Available configuration of water heating heat exchanger in the open literature Table 5.7: Comparison of experimented and the predicted lengths of condenser (% difference from experiment in bracket) Table 5.8: Comparison of experimented and the predicted lengths of gascooler (% difference from experiment in bracket) Table 6.1: Copper tube standard for TATMB 280 Copper Tube-ACR Table 6.2: Average thermal resistance in optimal configuration I case B Table 6.3 Average thermal resistance in optimal configuration II Table 6.4 Average thermal resistance in optimal configuration III Table 6.5: Summary of characteristics for three best water heating heat exchanger configurations. x. 7 9 11 22 28 39 41 51 55 60 61 103 105 106 107 109 112 114 115 118 131 138 144 145.
(13) CHAPTER 1 INTRODUCTION Worldwide energy use continues to increase despite limitations in fossil fuel based energy sources. Further, the use of energy generated by fossil fuels contributes to global warming and it is predicted to lead to significant climate change and a large impact to society. As a result, many countries have tried to decrease their energy use. Energy conservation is effective because it decreases total energy use and also it helps extent the life of non-renewable energy sources as well as reducing global warming impact. Residential energy use is a significant fraction of the total nationwide energy use. More than 25% of total energy use goes on residential energy use in most countries. For instance, the residential energy use in New Zealand is about one-third of the total nationwide energy use (BRANZ, 2009). The energy used in the hot water heating systems is a major part of the New Zealand’s residential energy use (BRANZ, 2009). Mostly, the hot water heaters are either electric water heaters or the gas water heaters. Both types use a lot of energy when compared to alternative hot water systems because they are less than 100% energy efficient. Thus, if alternative systems that use smaller amounts of energy are used, instead of the conventional systems, the total energy use in the residential sector will decline. Heat pump water heating system is one alternative system that is interesting because it uses about one third of the energy use for the same heating capacity (Ochsner, 2008). Heat pump water heaters can be used for all climates. In mild or hot climates, airsource heat pump water heaters are suitable. On the other hand, ground source heat pump water heaters are suitable for cold climates. In addition, water source heat pump water heaters are available for mild or hot climates; however, these systems are not convenient unless water sources are readily available. Air-source heat pump water heaters are suitable for New Zealand due to its mild climate. These heaters are able to operate on either a subcritical cycle or transcritical cycle. Both cycles can work either on a one-pass heating system or a multi-pass heating system for domestic applications. The transcritical cycle is most suitable for one-pass heating systems while the subcritical cycle is most suitable for multi-pass heating systems. Air-source heat pump water heaters are not yet successful on the market for New Zealand because their costs are still high. One contributing factor is that water heating heat exchangers have to prevent refrigerant or oil contaminating the hot water supply if it leaked. As a consequence, double wall heat exchangers are used resulting in larger heat transfer area of the heat exchanger and higher cost compared with single wall designs. In addition, water heating heat exchanger for air-source heat pump water heaters is a relatively new field application, so there is limited design and. 1.
(14) manufacturing knowledge. Therefore, these water heating heat exchangers are a priority component to develop for domestic applications. Any heat exchanger design is a trade off between heat transfer performance, pressure drop, and cost. Heat exchanger configuration is the most important factor affecting heat transfer performance and pressure drop of the system. Experimental investigation of alternative heat exchanger designs is very time consuming and expensive. Further, due to ozone depleting and global warming concerns, a range of refrigerants must be considered for heat pump systems. In such a situation, mathematical modelling is an alternative approach as it allows a wide range of alternative refrigerants and heat exchanger designs to be evaluated in a cost-effective manner. In this research, models of water heating heat exchangers based on air-source heat pump water heaters will be developed in order to improve water heating heat exchanger designs for domestic applications in New Zealand.. 2.
(15) CHAPTER 2 LITERATURE REVIEW. In this review domestic hot water heating requirements, energy uses, hot water supply systems, and types of hot water heaters will be discussed. Heat pump water heaters will be discussed in the terms of types of the system, standards for such systems, operating cycles, and refrigerants used. In addition, heat exchangers commonly used for heat exchange between the refrigerant and the water will be briefly discussed. Finally, available correlations or equations for predicting heat transfer coefficients and pressure drops during single-phase flow region, condensation phase flow region, and transcritical phase flow region of working fluids in tubes will be reviewed. 2.1 Hot Water Heating 2.1.1 Requirements for hot water Hot water is widely used for many applications such as processes in industry, medical equipments, commercial buildings, hotels etc. Further, it is provided for household applications. The distribution of the household hot water consumption for some parts of the world is shown in the map (Fig. 2.1). It can be seen that the global hot water consumption for household applications is a significant fraction of the total global hot water consumption. The amount of household hot water consumption is in accordance with the requirement of consumer. In New Zealand, the household hot water requirement is between 40 and 60 litres of hot water per day per people with the water temperature requirement of between 40oC to 80oC, depending on various applications (Williamson, 2001).. : Terajoules/year 2.21 million. 95,172. 6. No data. Figure 2.1: Map of hot water consumption by household by country (NationMaster, 2005): Terajoules/year. 3.
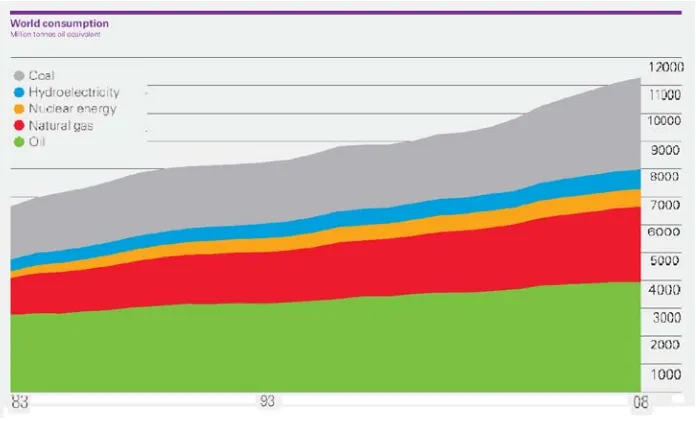
(16) 2.1.2 Energy consumption The global primary energy consumption continues to increase as shown in Fig. 2.2. Mostly the primary energy sources come from fossil fuels. Increase of fossil fuel consumption is a major cause of global warming. The distribution of the global primary energy supply and carbon dioxide emissions are shown in Fig. 2.3 and 2.4 respectively. Greatest primary energy use is in North America and Asia including China causing large amount of carbon dioxide emissions. On the other hand, the amount of primary use of Latin America, Africa and Middle East are quite small. However, the overall primary energy supply and carbon dioxide emissions are still high.. Figure 2.2: Global primary energy consumption (BP, 2009) : Million tonnes oil equivalent. Figure 2.3: Map of global primary energy supply (IEA, 2009): Million tonnes oil equivalent 4.
(17) Figure 2.4: The map of the annual CO2 emissions in 2006 (IEA, 2009): Million tonnes The residential energy use is significantly relative to the primary energy. The carbon dioxide emission from the residential sector is a very significant fraction of the overall carbon dioxide emissions as shown in Fig. 2.5. In New Zealand, about 69% of the total household energy use by fuel type comes from the electricity (Fig. 2.7). Approximately 32% of nationwide electricity energy use is consumed by the residential sector (Fig. 2.6).. Figure 2.5: CO2 emissions by sector (DOE, 2007). 5.
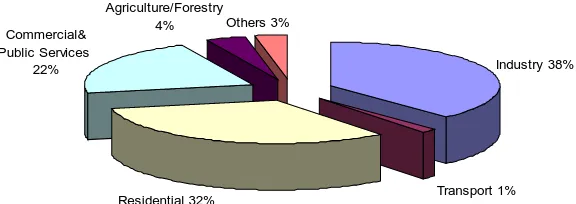
(18) Commercial& Public Services 22%. Agriculture/Forestry Others 3% 4% Industry 38%. Transport 1%. Residential 32%. Figure 2.6: The electricity energy use in New Zealand in 2006 (IEA, 2009). (a) Total energy use by fuel type (b) Total energy use by end-use Figure 2.7: Energy use in New Zealand households (BRANZ, 2006) The energy used for heating water is a major part of total energy use in the residential sector. In New Zealand, approximately 29% of an average household’s energy end-use goes on water heating (Fig. 2.7) (BRANZ, 2006). About one-third of Australian household energy use is consumed by water heating systems (Kenway, 2008). In South Africa, the hot water production is the largest user of energy in the domestic sector (Meyer, 1997). Further, about 30.7% of household energy consumption in Japan is used for hot water supply (Taira, 2008).. 6.
(19) 2.1.3 Hot water supply systems BRANZ (2006) provided an international comparison of the fraction of houses using electric hot water storage systems. New Zealand stood out as having the highest (77%) proportion of such systems. Generally, hot water supply systems are classified into two main groups: instantaneous systems and storage systems. In instantaneous systems the cold water is heated by the water heater and the hot water produced is supplied directly to the user when required (Fig. 2.8). On the other hand, in a storage system the hot water produced by the heater flows into the hot water cylinder (HWC) in order to store it until delivery to the user (Fig. 2.8). If the temperature of hot water stored in the HWC does not meet the requirement, the hot water is heated in order to increase the temperature until needed. The heating capacity of hot water heaters for instantaneous systems must be higher than for storage systems at the same water temperature required because they must produce the peak flow required whereas a storage system allows the water heating to occur over a longer period. Further comparison of some characteristics is presented in Table 2.1. Hot water to user. Hot water to user. Hot water Heater. Cylinder Heater. Cold water Cold water Cold water. (a) instantaneous system. (b) storage system. Figure 2.8: Diagram of hot water supply systems Table 2.1: The comparison of some characteristics between instantaneous and storage systems Items Instantaneous system Storage system • ability to supply • space required in installation • start-up delay • heat source flexibility. continuous small long limited. 7. limited large short flexible.
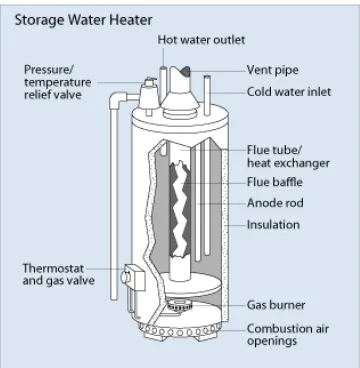
(20) Energy can be lost in all parts of the hot water supply systems, which can be represented as a Sankey diagram as shown in Fig. 2.9.. Figure 2.9: Sankey diagram for energy loss in hot water supply system including a hot water cylinder (HWC). 2.2 The Types of Domestic Hot Water Heaters 2.2.1 Conventional storage hot water heaters At present, most hot water used in New Zealand household applications is produced by electrical hot water heaters. Basically, an electrical hot water heater composes of electrical resistances (elements) submerged inside the HWC, thermostats to control the hot water temperature, and inlet and outlet pipes for cold and hot water as shown in Fig. 2.10. In addition, some consumers use gas water heaters. These heaters usually use natural gas or propane as a heat source. A gas water heater basically operates as same as the electric water heaters, but its heater is a gas burner, instead of the electrical resistance as presented in Fig. 2.11. The comparison for some characteristics between the electrical hot water heaters and gas hot water heaters is shown in Table 2.2. Although electrical hot water heaters have almost no loss in the heat transfer from the resistance element to the water, there are standing losses incurred in maintaining the temperature of the stored water. By comparison modern domestic gas storage systems range between 70% and 80% efficient due to heat losses in the flue gas (Williamson & Clark, 2001).. 8.
(21) Table 2.2: The comparison of some characteristics between the electrical and gas heaters Items • installation & maintenance • venting requirement • supply air • equipment life • initial cost • running cost. Electrical heaters easy no no acceptable cheap expensive. Gas heaters more difficult yes yes acceptable more expensive cheaper. Figure 2.10: An electrical storage hot water heater; no insulation shown (NRC, 2009). Figure 2.11: A gas storage hot water heater (DOE, 2009). 9.
(22) 2.2.2 Alternative hot water heaters Unfortunately, the traditional hot water systems are less than 100% energy efficient leading to higher energy use and increased global warming. Alternative hot water heaters are expected to replace the traditional heaters because they are more energy efficient. At present, alternative systems such as solar hot water systems with or without electric or gas backup, or heat pump water heating systems are available for domestic applications. However, these systems are not highly successful on the market because their costs are still high and they are not convenient to use when compared with the traditional heaters. As a consequence, further research and development is required. In Florida, heat pump water heaters have been developed with a system efficiency roughly twice that of an electrical resistance heater (Merrigan, 1990). Urchueguia (2008) found that a ground source heat pump system is a viable and energy efficient alternative to conventional system for heating and cooling applications in South European regions. For solar systems, Prudhomme and Gillet (1998) found with advanced control technologies that Coefficients of Performance (COPs) of between 1.5 and 1.7 were possible for flat plate solar domestic system in Switzerland. In addition, Biaou and Bernier (2008) compared four systems (a regular electric hot water tank, the desuperheater of a ground source heat pump (GSHP) with electric backup, thermal solar collectors with electric backup, and a heat pump water heater) in terms of energy efficiency. They concluded that heating domestic hot water with thermal solar collectors with an electric back up is the best solution for a zero net energy home (ZNEH) in Canada. Similarly, in Australia, direct solar systems were better performers in the warmer cities (Aye et al., 2002); by contrast, such systems are marginal in the Southern parts of New Zealand in terms of performance (Lloyd & Kerr, 2008). Anderson et al. (1985) measured electrical energy use in New Zealand’s domestic hot water heaters. It was found that a heat pump water heater was able to realize annual average saving of 50 – 58% compared with conventional resistance water heaters. Although the alternative systems have higher energy efficiency resulting in reduced running cost, the investment cost of the systems is still high. Some systems are not convenient to use and not as compact such as the solar systems. Among the alternative systems in terms of the efficiency, the installed cost, and the life-cycle cost (Table 2.3), the heat pump water heater looks promising.. 10.
(23) Table 2.3: Comparison of life-cycle costs for different hot water systems (ACEEE, 2007). 2.3 Heat Pump Systems A heat pump system drives heat from the low temperature source to the high temperature sink by input of work into the system (Fig. 2.12). In practice, this system operates as a cycle (Fig. 2.13). In fact, the system will be charged by a working fluid (refrigerant) in order to absorb heat from the low temperature source and it will be driven to the high temperature sink for rejecting heat. There are many types of heat pump system depending on useful outcome, working fluids, energy input into the system etc. Heat pump systems are widely used for many applications such as refrigerators, airconditioners etc. Heat pump water heating is one application of heat pump systems that is currently of interest because of the concern about the energy use and the environmental impact. Generally, operation of heat pump systems depends on heat source temperatures. As a consequence, air, water, and ground are all often used in as the heat sources.. 11.
(24) Heat sink High temperature. Heat flow into the heat sink. System. Energy input. Heat flow from heat source. Heat source Low temperature. Figure: 2.12: The principle of the heat pump system 2.3.1 Air-source heat pump systems Air-source heat pump systems use the ambient air as the heat source. A simple air-source heat pump water heater is illustrated in Fig. 2.13. The liquid working fluid at low temperature and low pressure absorbs heat from the air leading to its evaporation to the vapour phase. After that it is compressed to high temperature and high pressure. At this state, the vapourised working fluid is cooled by heat exchange with the water in the heat exchanger (condenser) to become a liquid at high pressure. The high pressure liquidworking fluid is reduced to low side pressure and then flows into the heat exchanger (evaporator) in order to absorb heat from the air once again.. 2.3.2 Ground-source heat pump systems A ground-source heat pump system basically operates as same as the air-source heat pump. It is only different in terms of the heat source used. The ground-source heat pump uses the underground as a heat source. A working diagram is presented in Fig. 2.14.. 12.
(25) Figure 2.13: A classical air-source vapor compression heat pump system. The advantages and disadvantages of the air-source heat pump system are listed below: Advantages. Disadvantages. • lower in energy use (1/3 to 1/4 of traditional heaters) • lower in maintenance cost than other types of heat pump system. • still release the greenhouse gases as primary energy used • higher in investment cost than traditional heaters • not suitable for coastal areas (corrosion) • noisy • climate impact on performance (frosting). 13.
(26) Figure 2.14: A ground-source vapor compression heat pump system The ground-source heat pump systems are beneficial in many ways compared with airsource heat pumps as listed below: Advantages. Disadvantages. • quieter • last longer • lower energy consumption • need little maintenance • suitable for the cold climate as almost constant ground source temperature and higher on average than ambient temperature. • very high investment cost for installation. The key disadvantage is the higher cost of the ground heat exchanger.. 2.3.3 Water-source heat pump systems A water-source heat pump system uses water at the low temperature as the heat source. A classical water-source vapor compression heat pump system is show in Fig 2.15.. 14.
(27) Figure 2.15: A classical water-source vapor compression heat pump system The advantages and disadvantages of water-source heat pump water heaters are listed below: Advantages. Disadvantages. • lower energy use than the air-source • available for coastal areas • very flexible to expand into the new zone. • higher investment cost than air-source heat pump. 2.3.4 Heat pump efficiency The theoretical energy efficiency of heat pump water heaters can be related to heat sink temperature and heat source temperature according to the COP of the reverse Carnot cycle: COP reversible =. where. TH TH − TL. TH = heat sink temperature, K. TL = heat source temperature, K. Clearly a small temperature difference is desirable. As a consequence, because the heat sink temperature required is high (hot water temperature), heat source temperature should be high as well. Therefore, air-source and water source heat pump water heaters are most suitable for mild and hot climate regions. On the other hand, the ground-source and water source heat pump waters heaters are suitable for cold climate regions because the ground temperature is almost constant for whole year and it is often higher on average than the ambient air temperature. For these reasons, because New Zealand climate is mild, airsource and water source heat pump water heaters are suitable. However, domestically, there is often not a convenient source of water available. Thus, air-source heat pump water heaters are the most suitable type for New Zealand. 15.
(28) 2.4 The Types of Air-Source Heat Pump Water Heaters The types of air-source heat pump water heaters can be characterized by two types: integral and standalone. 2.4.1 Integral unit All components such as compressor, condenser, evaporator and controller are integrated into the unit which may include a HWC if it is a storage system. Hermetic compressors, finned evaporator, axial or radial fan are often used in the design. Air ducts up to 20 meters in length are acceptable (for radial fans). Optional defrost mechanisms can be used for operation at low outdoor temperatures. A passive immersed condenser with a cross-flow heat exchanger is usually used for this type. As the body of water will consequently be well-mixed and heat up uniformly, the thermal effectiveness of the condenser will be constrained when the bulk temperature of the storage tank approaches the condensing temperature by less than 5oC (Carrington, 1982) The advantages of this type they require small space area for installation and have low cost for installation. However, instantaneous integral units are unsuited for domestic applications because of the highly variable hot water flow rates used by most households. 2.4.2 Standalone unit With standalone (split) hot water units, the heat pump is separate to the hot water storage or hot water cylinder (HWC). A built-in feed pump will circulate water from the heat pump through the HWC. In this way, an existing HWC of any model or capacity can be used. A condenser with counter-current water and refrigerant flow control is a commonly used design. The use of a counter-current condenser offers the possibility of hot water outlet temperature being higher than the condensation temperature and higher than with a crossflow or co-current arrangement. Further, counter-current flow also improves cycle efficiency because it is feasible to sub-cool the refrigerant to close to the water inlet temperature (Carrington, 1982). Heat pump water heaters can produce hot water by two options: ●. Water re-circulation (multi-pass) Water circulates between the heat pump and the hot water cylinder (HWC) until all the water in the HWC is heated to the specified temperature (uniform temperature) as shown in Fig. 2.16. ●. One pass heating The cold water is heated by the heat pump from cold to the specified temperature in one pass and it delivered to the top of the HWC. Because of the decrease in density with 16.
(29) temperature at the top of HWC, the hot water remains above the colder water at the bottom of HWC causing a thermocline in the HWC (stratified storage) as presented in Fig. 2.17. The one-pass systems can deliver hot water to users immediately after start up while the multi-pass systems do not. One-pass system always operates with high condensing temperature but has high potential for refrigerant sub-cooling; hence, its COP is moderate. Multi-pass system operates at lower condensing temperature; thus, at the beginning heating, its COP is high but at the final heating its COP is low due to low potential for sub-cooling. However, overall COP for both systems may not be significantly different.. Figure 2.16: Schematic diagram of multi-pass heat pump water heating system. Figure 2.17: Schematic diagram of one-pass heat pump water heating system. 17.
(30) 2.5 Vapour Compression Cycles The vapour compression cycle can operate either sub-critical or transcritical. 2.5.1 Subcritical cycles Subcritical vapor compression cycle is a cycle that operates below the critical point of the refrigerant for both the cooling process (low pressure side) and the heating process (high pressure side) as shown in Fig 2.18. For the cooling process of the cycle (process 6 → 1 ), a refrigerant evaporates at the evaporator by absorbing heat from the low temperature reservoir (air-source). The refrigerant leaving from the evaporator (state 1) is compressed by the compressor to high pressure side (state 2). Then, the high temperature refrigerant at the high-pressure side will be cooled by the high temperature reservoir (water sink) in the condenser (process 2 → 5 ). In the heating process (at the condenser), the refrigerant heat flow will occur in three processes, de-superheating (process 2 → 3 ), condensation (process 3 → 4 ), and sub-cooling (process 4 → 5 ). Finally, the pressure of the refrigerant (state 5) will be decreased by an expansion device to the low pressure (state 6).. Figure 2.18: Subcritical vapour compression cycle on mollier diagram In the case of design of water heating heat exchanger (condenser) running on the subcritical vapour compression cycle, high heat transfer coefficient of refrigerants, a high degree of subcooling of the refrigerant and low pressure ratio between low side and high side of the cycle are required for high energy efficiency. In the heating process (condenser), the heat transfer coefficient of refrigerant side is generally higher during condensation than in super-heating and sub-cooling processes. In order to improve the rate of heat transfer, condensation pressure may be increased but this increases the pressure ratio of the compressor. The condensation pressure is also limited by the critical point and the desired water temperature. 18.
(31) The water temperature required is limited by the critical temperature of refrigerant used in the cycle. Practical cycles are usually designed to condense at 70% to 90% of the critical temperature (on an absolute temperature basis) and, therefore, at corresponding fractions of the critical pressure (Calm & Didion, 1998). For domestic application, heat pump water heaters can work either on multi-pass or one pass heating. However, for one pass heating, it must produce hot water at the desired temperature leading to use high condensation temperature of refrigerant. This may cause a pinch in heat exchange between the water and refrigerant side at the transition from desuperheating to condensation (Fig. 2.19). In addition, the coefficient of performance of heat pump will be lower due to high pressure ratio of the compressor. For these reasons, multi-pass heating or circulation heating is most suitable for domestic heat pump water heater working on subcritical cycle because this system can operate with low condensation temperature of refrigerant for a large fraction of the time. This allows high coefficient of performance of the system. It can also supply stable hot water temperature to users. However, disadvantages of this system are longer heat pump operating period, the extra cost of the HWC, and slower recovery after a major hot water use.. Figure 2.19: Temperature difference profile in a condenser of a subcritical cycle. Single stage Single stage subcritical cycles which operate with single stage compression require high condensation temperatures in order to produce high hot water temperature. If the heat source temperature is low then the compressor pressure ratio becomes large. Most reciprocating compressors are limited to pressure ratios on the order of 8:1 (Jekel & Reindl, 2008). As a consequence, if the condensation temperature required is high while the evaporation temperature is very low, single stage compression systems have poor energy efficiency.. 19.
(32) Multi-stages Mutiple stages subcritical vapour compression systems are often coupled with multiple stages of liquid expansion and intercooling. Stages of compression represent the number of compression steps required to raise the refrigerant pressure from suction to condensing. A two-stage system will result in lower compression ratio operation on each individual compressor, which improves compressor efficiency compared to a single stage system. However, more compressors mean more maintenance, more floor space and higher cost etc. These trade-offs are relatively complex and plant-dependent; thus, they will affect the total life-cycle cost of the system (Jekel & Reindl, 2008). In the case of domestic air-source heat pump water heaters, ambient temperatures of some regions may be low or one-pass heating systems are required. These result in small temperature approach between inlet refrigerant and hot water in condenser. As a consequence, the heat transfer performance of the condenser will be constrained. Further, heat transfer area of condenser used will be large because heat exchange in the desuperheated zone becomes a large fraction of the total for a single stage system. For these reasons, two-stage compression is useful to increase the temperature approach resulting in high heat transfer performance of the condenser.. 2.5.2 Transcritical vapour compression cycles The transcritical cycle operates between subcritical pressure on the low side pressure and supercritical pressure (above critical point) on the high side as shown in the Fig. 2.20. The cycle is similar to the subcritical cycle, but for the heating process (process 2 → 3 ), the working fluid phase stays in the supercritical phase throughout the heat exchanger (gascooler). Therefore, in the heating process the refrigerant undergoes sensible cooling rather than condensation. Ordinary synthetic refrigerants are unsuited for use in this cycle because their critical temperature is too high (Table 2.4). Carbon dioxide is a natural refrigerant that has a low critical temperature and good thermal stability; thus, it may suit this cycle.. 20.
(33) Figure 2.20: Transcritical cycle on mollier diagram. Figure 2.21: Temperature difference profile of gascooler. The CO2 transcritical vapor compression heat pump systems Single stage Generally, the CO2 transcritical cycle can operate on single stage vapour compression. For the same temperatures CO2 has much higher evaporation pressures than most other refrigerants. Thus, the transcritical CO2 system have a smaller components leading to more compact systems than subcritical vapour compression systems. Also the pressure ratio tends to be low for the same temperature range.. 21.
(34) On the heating process of the cycle, it runs on above the critical point (35 bar). The hot water temperature and heating capacity can be higher than those of the subcritical vapour compression cycle. Further, the irreversibility loss from heat transfer between the refrigerant side and the water side is lower than that of the heating process of the subcritical vapour compression cycle because the temperature difference between the CO2 and the water is almost unchanged (see Fig. 2.21). The pinch effect from heat exchange between the refrigerant side and the water side may be avoided because the refrigerant side is single phase in the gascooler. For those reasons, domestic heat pump water heaters working on the transcritical cycle use one pass heating system. These results in reduced extra cost of the HWC, short periods of heat pump operation, and reduced risk of hot water shortage at times of peak demand. Although, the CO2 transcritical cycle has many benefits, component cost may be still high due to low sales volumes and the high operating pressure. In addition, the specific heat capacity of the carbon dioxide near the critical point is not constant, and this can lead to a pinch effect in the middle of refrigerant cooler. This results in reduced heat transfer in this region. The effect of this pinch point can be reduced by increasing the discharge pressure or by increasing the suction temperature by a recuperator (Yarrell, 1998).. Two-stage Two-stage system may also be essential for transcritical system if the pressure ratio for a single stage system is large.. Table 2.4: The thermodynamic properties of none-ozone depleting potential refrigerants Refrigerants Critical pressure (bar) R134a 40.6 R410A 49.0 R717 113.3 R744 73.8. Critical temperature (oC) 101.1 71.4 132.3 31.0. 22. Saturated pressure at 0 oC (bar) 2.9 8.0 4.3 34.9.
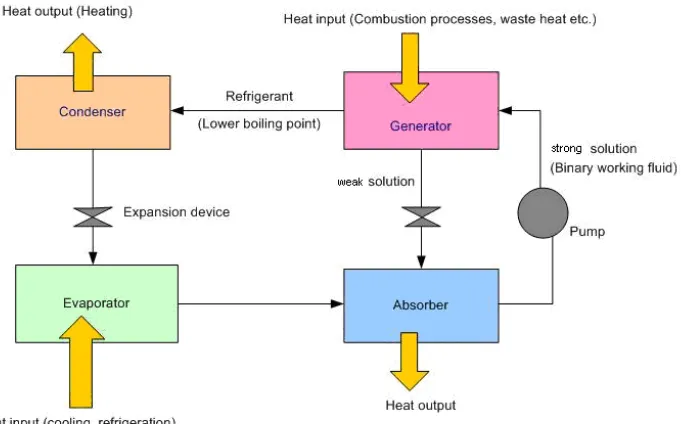
(35) 2.6 Other Heat Pump Cycles Absorption heat pump cycle Basically, an absorption heat pump system operates similarly to the vapour compression system but it is different in energy input into the system and refrigerant used. The absorption system uses the binary-mixture fluids such as LiBr-H2O, NH3-H2O etc. as working fluids in the system. The energy input into the system comes from heat sources such as natural gas combustion, waste heat etc. in order to heat and separate the binary working fluids at the generator. The refrigerant (the fluid having lower boiling point) leaves from the generator at high pressure and temperature to the condenser whereas the weak solution flows into the absorber. The refrigerant is cooled and condensed by the condenser and its pressure is reduced to low side pressure by expansion devices. It flows into the evaporator in order to evaporate. Finally, at the absorber, the weak solution will absorb the refrigerant leaving the evaporator to form a strong solution, and strong solution is then pumped to the generator as shown in Fig. 2.22.. Figure 2.22: An absorption system. The advantage of this system is able to use many heat sources, including waste heat, to operate the system. It can save energy cost. However, it’s energy efficiency is lower than that the vapour compression systems. In addition, the components of system are more complex leading to higher cost and more difficult maintenance.. 23.
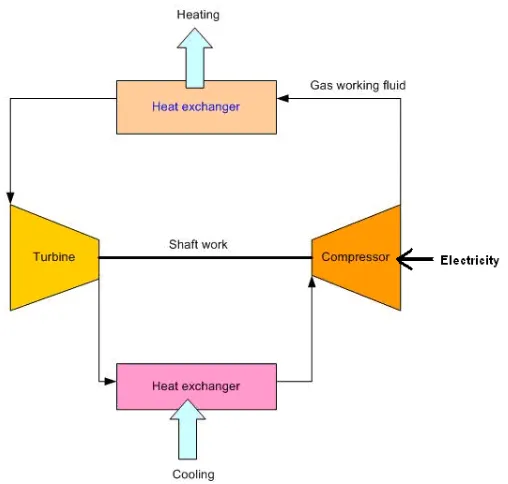
(36) Brayton cycle A Brayton heat pump system operates as in the vapour compression system but operates completely in the superheated gas phase. A gas is drawn into the compressor at state 1 and compressed to state 2. The hot compressed gas then enters a heat exchanger where it is cooled to state 3, thereby delivering heat to the hot water system. The gas is expanded through the turbine to state 4 in order to produce shaft work, which is delivered directly to the compressor. Finally, the gas flows into the heat source heat exchanger to increase the temperature to state 5 before entering the compressor. The simplified layout of the Brayton heat pump system is presented in Fig. 2.23. The advantages of the Brayton heat pump system include that refrigerants used in the Brayton heat pump system are abundant such as the air; the cycle is very simple; there are no refrigerant leak problems and there is no requirement for a low-temperature heat exchanger (White, 2009). However, air-cycle devices have a tendency to be bulky due to the low density and thermal capacity of air, and at conditions typical of central heating systems the cycle has a very low work ratio, making it particularly susceptible to irreversibilities (White, 2009).. Figure 2.23: Simplified layout of the Brayton heat pump system. 24.
(37) 2.7 Standards Standards are a mechanism to ensure system performance can be tested and compared in a consistent manner. Air source heat pump water heater is a product that is attracting attention for its ability to save energy and reduce greenhouse gas emission. It is expected to replace the traditional water heaters. Therefore, standards for air-source heat pump water heater are being developed. Standards for air-source heat pump water heaters have been issued in many countries. For examples, standard codes of residential heat pump water heaters of Canada, EU, and Japan are C745-00, EN255-3, and JRA4050 respectively (C745-00, 2000; EN255-3, 1997; JRA4050, 2005). For New Zealand and Australia, the standard for heat pump water heaters is Australia/New Zealand StandardTM 2712 and 4234 (AS/NZS, 2007). IEA HPP (Heat Pump Programme) Annex 28 consists of eight counties Australia, Canada, Germany, Japan, Norway, Sweden, and USA. The purpose of the Annex 28 were to elaborate recommendations to standardization organizations concerning for heat pump systems (Wemhoener & Afjei, 2006). In addition, heat pumps would need to adhere to the generic refrigeration safety standards such as AS/NZS 16771999 or ASHRAE Standard 15 2010.. 2.7.1 Standards for the air-source heat pump water heaters The AS/NZS 2712, covers the following aspects of air source heat pump water heaters design and construction. ●. System performance - Thermal performance ● Refrigerant - Refrigerant type - Maximum charge of refrigerant ● Design and construction - Materials - Over-temperature protection (thermal cut-out) - System pressure and temperature - Circulating pump construction - Controllers for circulating pump and supplementary heating - Pressure relief - Heat exchangers. 25.
(38) ●. Instruction and Marking - Installation instruction - Marking. 2.7.2 Standards for the heat exchangers In accordance with the AS/NZS 2712, heat exchangers used in transferring heat from heat pumps to the drinking water supply shall be designed to ensure that the heat transfer fluid does not contaminate the drinking water. The regulations issued for design and construction of heat exchangers are include the following aspects. ●. Heat transfer fluid - Stability - Approvals - Indicator colour ● Design and Construction - Materials - Strength of materials - Support - Over-pressure test-Internal - Facilities for drainage and filling - Maintenance of heat transfer fluid level in vented heat exchange systems ● Instruction and marking - Pressure information - Leakage indication - System with non-toxic heat transfer fluids other than water The key outcome of the standard is that double wall water heating heat exchangers are required to prevent contaminated water supplies by refrigerant or oil if the heat exchanger leaks.. 2.8 Refrigerants The main environmental concerns of refrigerants are their emission into the atmosphere causing ozone depletion and the global warming. The cause of ozone layer depletion is from the emission of chlorinated man-made chemicals into the atmosphere (Rowland & Molina, 1974). As a consequence, an intergovernmental agreements to protect the ozone layer was established in 1987 called “the Montreal Protocol”. Amendments to the Montreal Protocol were followed by the London, Copenhagen, Vienna, Montreal and Beijing in 1990, 1992, 1995, 1997 and 1999 respectively. As a result, production and use of chlorofluorocarbon (CFC) refrigerants used in the refrigeration and heat pump systems were banned in industrialized countries (except for essential applications) (McMullan, 2002); however, they are still used in some developing countries. In addition, Hydrochlorofluorocarbon (HCFC) refrigerants will be officially phased out in the near future. 26.
(39) for industrialized countries. Germany has banned the used of HCFC-22 in new plants after the year 2000 (McMullan, 2002). Eventually all refrigerants releasing chlorinated gases will be replaced by alternative refrigerants. Climate change or global warming is caused by the increase of carbon dioxide (CO2) and greenhouse gases in the atmosphere. Normally, the surface of the earth is heated up by about 51% of total incoming solar energy and it is released in the form of infrared radiation, convection and evaporation into the atmosphere. However, the infrared radiation energy can not pass through the atmosphere because it is absorbed by water vapour, carbon dioxide and other infrared absorbers; therefore, heat energy is trapped and the temperature at the surface of the earth is higher than without the insulating blanket of the atmosphere. For that reason, if the atmosphere has an increase of carbon dioxide and other greenhouses gases, the amount of heat trapped will be increased. This causes increase in atmosphere temperatures and consequent long-term climate changes. Two factors used to measure the impact of a greenhouse gases are Global Warming Potential (GWP) and Total Equivalence Warming Impact (TEWI) (Lucas, 1993). The GWP is based on CO2 as reference; thus, calculation has to allow for the lifespan of the molecule in the atmosphere. As a consequence, CFCs have a very high global warming impact. For example, one molecule of R-11 will absorb the amount of heat greater than 10,000 times that absorbed by CO2. TEWI takes into account the direct global warming effect as well as the indirect global warming effect, which depends on the energy used in the process, and thus how much CO2 is produced by the production of electricity to run the equipment over its life. However, this factor will vary from region to region due to various electricity sources. Due to environmental concern about the ozone depleting potential (ODP), important candidates for single-compound refrigerants are hydro-fluorocarbon (HFCs) refrigerants (Fig. 2.24). In addition, some blends and natural refrigerants have zero ODP (Table 2.5). Considered both ODP and GWP, the natural refrigerants are most promising as alternatives (Table 2.5). However, heat pump water heaters using hydro-fluorocarbon refrigerants as working fluid will have very small impact to global warming when compared with the conventional hot water heaters in terms of TEWI measurement. Therefore, both the hydro-fluorocarbon refrigerants and the natural refrigerants can be used as alternative refrigerants in heat pump systems. Beside the environmental data, physical data and safety data should also be considered (Table 2.5).. 27.
(40) Figure 2.24: Ozone depletion potential (ODP) contrasted to global warming potential (GWP) for key single-compound refrigerants (Calm & Hourahan, 2001) Table 2.5: Comparison of some characteristics among CFCs, HFCs, and natural Refrigerants (Kim, Pettersen, & Bullard, 2004; Lorentzen, 1994; Tanaka & Kotoh, 2007) Refrigerants Chemical properties. Thermophysical properties. Global environment properly * **. Synthetic refrigerants CFCs HFCs R-12 R-22 R-134a R-410A ⁄ ⁄ ⁄ ⁄ ⁄ ⁄ ⁄ ⁄ ⁄ ⁄ ⁄ ⁄ ⁄ ⁄ ⁄ ⁄. Natural refrigerants. Capacity per unit volume. ⁄. ⁄. ⁄. ⁄. ⁄. ⁄. ⁄. Theoretical COP. ⁄. ⁄. ⁄. ⁄. ⁄. ⁄. Moderate discharge temperature Ozone layer. ⁄. ⁄. ⁄. ⁄. ⁄ and ×* ⁄. H2 O ⁄ ⁄ ⁄ ⁄ and ×** ⁄ and ×** ⁄. ⁄. ⁄. ⁄. ⁄. × ×. × ×. ⁄ ×. ⁄ ×. ⁄ ⁄. ⁄ ⁄. ⁄ ⁄. ⁄ ⁄. ⁄ ⁄. Toxicity/flammability Material deterioration Chemical stability Moderate boiling point. Warming. Evaluated with air-conditioners/water heaters Evaluated for source-of-heat temperature at low/high. CO2 ⁄ ⁄ ⁄ ×. H2 × ⁄ ⁄ ⁄. NH3 × × × ⁄. Air ⁄ ⁄ ⁄ × ⁄ ×. ⁄ = Acceptable × = Unacceptable. The thermodynamic properties of the alternative refrigerants used in the heat pump water heaters depend on the operating conditions of the systems. Many properties of refrigerants, such as critical pressure, critical temperatures, freezing point, normal boiling point, specific volume etc. should be considered. In addition, the operating pressures, coefficient of performance (COP), specific heat ratio of the system should be carefully considered. A positive pressure in the system is preferred to prevent the air and moisture flowing into the system. Because the required condensation temperature is high, the critical temperature of the refrigerant should be high if a subcritical cycle is desired.. 28.
(41) In order to produce low temperature in the evaporator at positive pressure, boiling point of the refrigerants should be low although too high pressure can increase cost to prevent system rupture. High pressure (low boiling point) can also help reduce the pressure ratio for a given operating temperature range. The system temperatures should also be higher than freezing point of the refrigerants. In order to improve the compressor life, the specific heat ratio of the refrigerants should be low leading to lower discharge temperature. In addition, an indication of the size of the compressor comes from the volume of suction vapour needed per ton of refrigeration (Mohanraj, Jayaraj, & Muraleedharan, 2009). Based on these criteria, CO2 (transcritical), R410A, and R134a appear the most promising refrigerants.. 2.9 Heat Exchangers for Domestic Hot Water Heating Heat exchangers are used for many applications including for water heating. Water heating heat exchangers have many types depending on applications. Common types are tube-in-tube heat exchanger, shell-and-tube heat exchanger, plate heat exchanger, or other compact heat exchangers. Water heating heat exchangers of the residential heat pump water heater must be carefully designed. The contamination cross of water supply must be avoided, according to the AS/NZS 2712 using a double-wall heat exchanger with small air gap. Double wall plate heat exchangers are available for tube-in-tube, tube-on-tube and plate heat exchanger configuration. In addition to preventing the cross contamination of water supply, other desirable features are: • • • •. simple construction and manufacturing, able to be designed for high temperature (up to 200 oC) and high pressure (up to 150 bar), able to be configured in countercurrent mode (allow greatest water temperature rise), and easy to maintain.. Tube-in-tube and tube-on-tube double wall heat exchanger are illustrated in Fig 2.25 and 2.26, respectively.. 29.
(42) Water flow channel. Refrigerant flow channel. Figure 2.25: A tube-in-tube double wall heat exchanger. Water flow channel. Refrigerant flow channel Tube wall 1 Tube wall 2. Figure 2.26: A tube-on-tube double wall heat exchanger For a water heating heat exchanger of a heat pump system, the inlet temperature of refrigerant is relatively high and the mass flow rate is low. In order to heat the water efficiently, the temperature difference between the refrigerant side and water side should be close together along the distance of the heat exchanger (lowest discharge pressure). Also a high water temperature rise is desirable especially for once-through configuration. A heat exchanger operating in countercurrent mode is best as shown in Fig. 2.27 and 2.28.. 30.
(43) Figure 2.27: Temperature difference between the refrigerant and the water in the condenser for countercurrent and cocurrent configurations. Figure 2.28: Temperature difference between the refrigerant and the water in the gascooler for countercurrent and cocurrent configurations. 31.
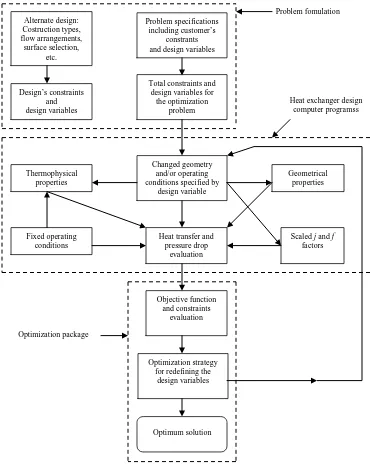
(44) 2.10 Flow Passage The ideal heat exchanger design provides high heat transfer performance with low pressure drop, compactness, a low cost, and is easy to maintain. However, high heat transfer performance of the heat exchanger is often achieved by causing high pressure drop of the water or refrigerant whereas low pressure drop often leads to low heat transfer performance and less compact design. Flow passages in the heat exchanger have a most significant effect on heat transfer performance and pressure drop. Therefore, configurations of the heat exchanger must be carefully considered in the design. Basically, the hydraulic diameter of the flow passage is a primary design factor. In theory, when the hydraulic diameter is decreased, the heat transfer performance will be increased for both sides due to increased mass flux (and therefore increased turbulence) but this will be offset by higher pressure drop for both sides leading to higher pump power for the water side and higher compressor power for the refrigerant side. As a consequence, it is necessary to optimize flow passages for both the refrigerant side and water side based on design conditions.. 2.11 Heat Exchanger Optimization A heat exchanger is designed for its specific application. Basically, heat exchangers designs should be not only workable but also optimal based on consumer requirements. When a consumer requirement is defined quantitatively and it is to be maximized or minimized, it is called objective function in a design optimization. However, the objective function depends on many particular requirements such as allowance pressure drop, required heat transfer, limitation on height, weight and/or length of heat exchanger etc. These requirements are called constraints in design optimization (Shah & Sekulic, 2001). In order to investigate the optimal solution in an objective function, many designers search the solutions by many approaches based on their experience. Configuration of geometry and/or operation of heat exchangers is one approach to search the optimal solution in the objective function. However, the objective function and constraints in this approach should be expressed mathematically. In aiming for an optimized heat exchanger design, two important aspects that can be expressed mathematically are the heat transfer coefficient and pressure drop of working fluids exchanging heat in the heat exchanger. Equations to estimate these aspects are used for evaluation in the optimization (search) technique. However, often these equations have a limitation in use depending on the operating conditions. A methodology for heat exchanger optimization is shown in the Fig. 2.29.. 32.
(45) Problem fomulation Alternate design: Costruction types, flow arrangements, surface selection, etc.. Design’s constraints and design variables. Thermophysical properties. Fixed operating conditions. Problem specifications including customer’s constrants and design variables. Total constraints and design variables for the optimization problem. Changed geometry and/or operating conditions specified by design variable. Heat transfer and pressure drop evaluation. Heat exchanger design computer programss. Geometrical properties. Scaled j and f factors. Objective function and constraints evaluation Optimization package. Optimization strategy for redefining the design variables. Optimum solution. Figure 2.29: Methodology for heat exchanger optimization (Shah et al., 1988). 33.
(46) 2.12 Prediction of Heat Transfer Coefficients and Pressure Drops A heat exchanger design has a trade off between the heat transfer performance and pressure drop. The design needs to be optimized in accordance with the requirements of high heat transfer performance and low pressure drop. If both can be achieved then operating cost and investment cost of the system will be low and the heat exchanger will be also compact. Therefore, in order to search an optimal heat exchanger, the overall heat transfer coefficient and pressure drop of the system must be predicted with high accuracy. This section reviews heat transfer coefficient and pressure drop correlations that might be used for such predictions. 2.12.1 Subcritical cooling processes Heat transfer between the refrigerant side and the water side in the water heating heat exchanger running on a sub-critical vapour heat pump system can be characterized by three zones as previously mentioned. Generally, however, the proposed correlations of heat transfer coefficient and pressure drop depend on the phase flow in the flow channel. Therefore, the correlations for both single-phase flow and two-phase flow (condensation flow) are reviewed. 2.12.1.1 Single-phase flow regions 2.12.1.1.1 Conventional channels with and without fins Heat transfer coefficient correlations without oil. Webb and Zhang (1997) surveyed methods to predict heat transfer coefficients for single phase flow inside plain tubes and micro-fin tubes. They recommended that for turbulent flow in circular tubes the equations of Petukhov (1970) are suitable. Yang (1996) reported R-134a and R-12 data for single phase flow inside extruded aluminium tubes with and without micro-fin. He found that the Petukhov equation reasonably predicted the single-phase heat transfer coefficients. Brognaux et al. (1997) compared heat transfer coefficients between experimental data and predicted data using the Petukhov equation for single phase flow on a 14.9 mm inside diameter round micro-fin tube. They found that the heat transfer coefficient is over predicted by nearly 30%. In addition, they developed an empirical correlation to account for helix angle of the micro-fins. Wang et al. (1996) compared their test results and prediction values by Dittus-Boelter correlation and Gnielinski correlation (Gnielinski, 1976) for water flow in a smooth tube hydraulic diameter of 7.92 mm. The experimental results for heat transfer data agree very well with the Dittus-Boelter correlation for Reynolds number (Re) greater than 10,000, and show a detectable deviation for Re ≤ 9,000 while the Gnielinski correlation,. 34.
(47) which correlates the available data over the range of Prandtl number from 0.5 to 2,000 and the Reynolds number from 2300 to 5 × 10⁶ , gave the best agreement with their experimental data. In addition, because the Dittus-Boelter type correlation is valid only for the higher Reynolds numbers, Wang et al. (1996) proposed an approach to predict heat transfer factors using the heat-momentum transfer analogy and compared it with their experimental data for water flow in microfin tubes with nominal diameter of 9.52, 7.94, and 7.0 mm. They summarized that the heat-momentum transfer analogy be used to correlate the single-phase heat transfer data rather than the the Dittus-Boelter type equation. In the range of 2,500 < Re < 40,000, the proposed heat transfer correlation can predict 85% of the microfin data within 10%. Generally, single phase heat transfer coefficients for micro-fin tubes were higher than that of equivalent smooth tubes from 50 to 100% while a pressure drop increased from 20 to 50% (Schlager et al., 1989).. Pressure drop correlations without oil Webb and Zhang (1997) surveyed methods to predict pressure drops for single phase flow inside plain tubes and micro-fin tubes. They recommended that for turbulent flow in circular tubes the simple empirical Blasius friction equation is suitable. Yang (1996) reported pressure drop data of 134a and R-12 during single phase flow inside extruded aluminium tubes with and without micro-fin. He found that the Blasius equations predicted pressure drops during single phase flow reasonably accurately. Wang et al. (1996) compared test result friction factors and predicted values by the Blasius correlation for water flow in a smooth tube having hydraulic diameter of 7.92 mm. They found that the experimental friction factors are in good agreement with the Blasius equation at the Reynolds number from 7,000 to 25,000, and higher by about 8% at a Reynolds number of 40,000. In addition, as the Blasius correlation is valid only for the higher Reynolds numbers, Wang et al. (1996) proposed an approach to predict friction factors using the roughness Reynolds number correlated as a function of Re and the enhancement dimensions and compared prediction values with their experimental data for water flow in micro-fin tubes with nominal diameter of 9.52, 7.94, and 7.0 mm. They found that, in the range of 2,500 < Re < 40,000, the proposed friction factor correlation can predict 96% of the micro-fin data within 10%.. 35.
Figure

+7


Related documents
Following perfusion with acid compared to saline, all subjects showed significant decreases in FEV1 and PEFR and significant increases in the mean valsalva ratio and heart
We constructed a total of 9 outcome variables from MEPS items that were most relevant to the entire age span (2 to 17 years) and those preventive counseling items that could
Configure WinBind and Samba If you want to authenticate against the Active Directory you need to make some configuration change in your smb.conf.. But first open Yast2 and
Failure of the oral examination will result in failure of the rotation and the student will need to retake the OB/Gyn clinical rotation and retake the NBOME-COMAT following
Prevalence and Characterization of Non-O157 Shiga Toxin-Producing Escherichia coli on Carcasses in Commercial Beef Cattle Processing Plants. producing Escherichia coli in
The research articles about randomized controlled trials (RCTs) published in 2002, 2004, 2006, 2008, and 2010 from journals which had specifically adopted the CONSORT Statement,
However, construction management is often characterized by one-to-many relationships (e.g., one manager/instructor with many workers), which makes personalized
Ferdous, SM, Mahir Asif Mohammad, Farhan Nasrullah, Ahmed Mortuza Saleque & Shahriar Muttalib, ‘Design and Simulation of an Open Voltage Algorithm based Maximum Power
