LIST OF ABBREVIATIONS
TMD Temporomandibular joint disorder
TMD Axis – 1 Temporomandibular joint disorders Axis-1
IADR International association for dental research
RDC Research diagnosis criteria for temporomandibular joint disorder.
DD Disc Displacement
MD Muscle Disorder
3D-CT Three dimensional computed tomography
DICOM Digital imaging and communications in medicine
CD-SUP Condyle superior
GO(INF) Gonial region
ME Menton
ANS Anterior nasal spine
MSP Midsagittal plane
FHP Frankfort horizontal plane
GH Glenoid height
GFA Glenoid fossa anterior
GFP Glenoid fossa posterior
TABLE OF CONTENTS
S.NO
CONTENT
PAGE NO
1 INTRODUCTION 1-2
2 AIM AND OBJECTIVES 3
3 REVIEW OF LITERATURE 4-13
4 MATERIALS AND METHODS 14-29
5 RESULTS 31-47
6 DISCUSSION 48-55
7 SUMMARY 56-57
8 CONCLUSION 58
9 BIBLIOGRAPHY 59-66
LIST OF TABLES
TABLE NO TABLE PAGE NO.
TABLE 1 Distribution of subjects into three groups. 20
TABLE 2 Linear measurements used for this study 22
TABLE 3 Angular measurement used for this study 23
TABLE 4 Distribution of the study population 31
TABLE 5 Gender wise comparisons of study and control groups 31
TABLE 6 Comparison of linear measurement between study and control groups on right side
32
TABLE 7 Comparison of linear measurement between study and control groups on left side
34
TABLE 8 Comparison of angular measurement between study and control groups on right side
36
TABLE 9 Comparison of angular measurement between study and control groups on left side
LIST OF FIGURES
[image:11.595.77.538.92.765.2]FIGURE NO FIGURES PAGE NO
Figure 1
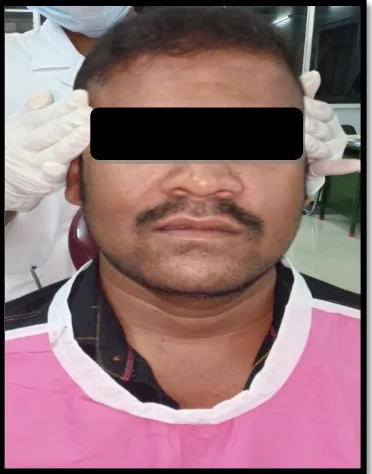
Clinical photograph showing the extra- oral examination of TMJ
15
Figure 2 Intra - Auricular Examination 15
Figure 3 Extra – Auricular Examination 16
Figure 4 Temporalis Muscle Palpation 16
Figure 5 Masseter muscle palpation 17
Figure 6 Sterilized Diagnostic Instruments 19
Figure 7 Positioning of patient during CT examination 21
Figure 8
Right side asymmetry measurement used to calculate craniofacial asymmetry on the reconstructed 3D- CT model
24
Figure 9
Left side asymmetry measurement used to calculate craniofacial asymmetry on the reconstructed 3D- CT model.
24
Figure 10 Both Maxillary Rotation And Mandibular Rotation 25
Figure 11 Glenoid Fossa Height 25
Figure 12 Frontal Ramal Inclination 26
Figure 13 Lateral Ramal Inclination 26
Figure 14 Canting Of Occlusal Plane 27
Figure 15 Maxillary Cant 27
Figure 16 Mandibular Cant 28
Figure 17 Anterior Glenoid Fossa Angulation 28
LIST OF GRAPHS
GRAPH NO
GRAPH
PAGE NO
GRAPH 1 Comparison of mean age of study and control groups 42
GRAPH 2 comparisons of percentage between the gender in study and control groups
43
GRAPH 3 Comparison of linear measurement between study and control groups on right side
44
GRAPH 4 Comparison of linear measurement between study and control groups on left side
45
GRAPH 5 Comparison of angular measurement between study and control groups on right side
46
GRAPH 6 Comparison of angular measurement between study and control groups on left side.
Introduction
1
INTRODUCTION
Temporomandibular joint disorders (TMD) is a collective term used to describe a group of musculoskeletal conditions occurring in the temporomandibular region. (Laskin et al.1983). It is as craniomandibular disorders. 1,2 TMD is the most common orofacial pain condition with manifestations like regional pain in the face and preauricular area, limitations in jaw movements, and noises from the TMJs during jaw movements. 3.
Etiology of temporomandibular joint disorders (TMD) is complex and multifactorial. The innumerable factors that can contribute to TMD includes occlusal factor, trauma, emotional stress, deep pain input, parafuctional activity, psychological factors 4,5.
Dental asymmetry has been a significant etiological factor for temporomandibular joint disorders (Inui, Fushima & Sato, 1994). Many research have been reported on dental asymmetry, but still the relationship between dental asymmetry and facial skeletal asymmetry remains to be clarified, especially in TMD patients.6
Symptoms of TMD include chronic pain which is the enormous reason for what patients look for the treatment. While TMD may also be associated with impaired general health, depression, or other psychological disabilities that affects the patient’s wellbeing and quality of life. TMD distributes the similarities with other chronic pain conditions such as chronic tension-type headache or migraine, low back pain, and fibromyalgia and causes much suffering for the individual. 1
Introduction
2 The conventional diagnosis of craniofacial asymmetry using is generally made on the basis of a clinical and radiological evaluation.8 Conventional radiographic images can be misleading in interpreting the cause of the deviation because complex 3-dimensional (3D) structures are projected into 2- dimensional (2D) surfaces, creating a possible distortion of the images and subsequent magnification errors.
But, Computed tomography (CT) has become an alternative to conventional radiographs methods because it facilitates a high quality image without superimposition as well as it provides 3D reconstruction and 3 dimensional analysis of the TMJ.Thus, enabling to determine the actual morphology and dimensions of the anatomical structures of the TMJ 7-9.
Aim and Objectives
3
AIM AND OBJECTIVES
AIM OF THE STUUDY
To evaluate the Craniofacial asymmetry in Temporomandibular Joint Disorder (TMD) patients using 3D-computed tomography.
OBJECTIVES OF THE STUDY
To measure the Mandibular ramus height, Mandibular body length, Mandibular length, Maxillary height, Glenoid fossa height, Maxillary rotation, Mandibular rotation, Mandibular angle, Frontal ramal inclination, Lateral ramal inclination, Cant occlusal plane, Maxillary cant, Mandibular cant, Anterior and Posterior Glenoid fossa angulation, in temporomandibular joint disorder patients and healthy individuals.
Review of Literature
4
REVIEW OF LITERATURE
Temporomandibular joint disorder is a well known clinical condition affecting most of individuals. It is defined as a group of conditions characterized by pain and dysfunction in temporomandibular joint and / or muscles involved in mastication. 10
Disc displacements in TMD was first reported by a British surgeon in the year 1887. Costen emphasized that early influence of dental malocclusion caused pain around the ear and the TMJs. This was also related to other ear symptoms such as impaired hearing, dizziness, and tinnitus. 11
More recent research recognizes that a single factor is not responsible for temporomandibular joint disorders, but it is a complex disorder with overlapping comorbidities of physical signs and symptoms, as well as changes in behavior, emotional status, and social interaction as manifestations of central nervous system. 12
Sign and symptoms associated with temporomandibular joint disorders vary with presentation involving more than one component of the masticatory system. There are three important signs and symptoms that occur in temporomandibular joint disorders, like pain, limited range of motion, and TMJ sounds.
Pain is usually the main complaint, originating in the temporal area and the cheek, and also affecting the peri-auricular area. Pain is aggravated by provocation, such as chewing, yawning, or talking. The pain can be intermittent or persistent and is of moderate intensity, but may cause severe pain intensity. 13
Most common clinical signs are pain and tenderness upon palpation of the pericranial muscles and TMJ and also associated with other symptoms such as
I. Tension-type headache
II.
Review of Literature
5
III.
Psychosocial distress
IV.
Depression
V.
Anxiety .14
PREVALENCE:
Age- and gender-specific prevalence rates in adults:
Review of Literature
6
K.Fushima, M. Inui & S. Sat. (1999)had researchedon dental asymmetry in
temporomandibular disorders. In this study, 34 female patients having internal derangement of temporomandibular joint (TMJ) were included. These patients exhibited TMJ noise or limitation of mouth opening sometimes with pain on clinical examination. Disk displacement in one or both TMJs was assessed by MRI findings, and disturbance or limitation in the sagittal and horizontal condylar tracings by axiograph and findings were seen. The median deviation and the molar relationship were examined. The results showed that positive value of Molar Difference (D-O) found with subjects, had a more distal occlusal relationship of the first molar on the displaced side compared with the opposite side. They concluded that the midline discrepancy and the right–left difference in the molar relationship are important occlusal characteristics of the patients with TMD.16
Eun - Sun Byun, et al. (2005) conducted a study on relationship between
internal derangement of the temporomandibular joint and dentofacial morphology in women with anterior open bite. Study comprised of Fifty-one women with anterior open bite. The sample was divided into 3 groups based on magnetic resonance imaging of bilateral TMJs: normal disk position, disk displacement with reduction and disk displacement without reduction with respect to the cephalometric variables. They concluded that cephalometric characteristics, such as a decrease in posterior facial height, decrease in ramus height and backward rotation and retruded position of the mandible, are associated with TMJ internal derangement in women with anterior open bite. 17
Kazuhiro Ooi, et al. (2013) conducted a study to determine the factors related
Review of Literature
7 the mandibular condyle in temporomandibular joints (TMJs) of patients with dentofacial deformity exhibiting facial asymmetry. This study was carried out among 70 female patients with facial asymmetry and those who had undergone orthognathic surgery were examined with magnetic resonance imaging of the cephalometric analysis. Results reported that, in facial asymmetry. The prevalence of ADDwoR, and bony changes were more frequently found and also concluded that distance between upper incisal midpoints and lower incisal midpoints were related to the prevalence of ADDwoR and bony changes in TMJs of patients with dentofacial deformity.18
J Koyama et al. (2007) conducted a study to assess the condylar bony
changes using helical computed tomography in patients with temporomandibular joint disorders. The condylar bony changes in 1032 joints from 516 subjects with incidence and type of bone changes in the temporomandibular joint (TMJ) were investigated in this study and alteration of the change in patients with temporomandibular disorders (TMD) during follow- up were noted. The condylar bone changes were further classified into five types on multiplanar reformatted (MPR) images of helical CT. Results revealed that condylar bone change were seen in 617 (63.7%) of 1032 joints and in 70 (68.6%) of 102 follow-up patients and concluded that CT should be consider as first choice, especially in detecting bony changes of temporomandibular joint disorders compared to conventional radiographs. 19
Jaime Gateno et al. (2004) conducted a studyto determine the position of the
Review of Literature
8 millimeters between the geometric centers of the glenoid fossa and the condyle. 2) calculating the antero-posterior joint space ratio. (P = .001) and concluded that ADD group were noted 2.4 times more in posterior condyle displacement compared to superior condyle displacement.20
Biljana Trpkova, et al (2000) to evaluate the temporomandibular Joint
Internal Derangement in female adolescents using a posteroanterior cephalogram. In this study, craniofacial asymmetry among 80 female orthodontic patients with unilateral or bilateral TMJ internal derangement (TMJ ID) were examined with the age range of 10 to 17 years patient received bilateral TMJ magnetic resonance imaging. Results reported that fourty-seven percent of patients had TMJ ID. Twenty-nine percent had unilateral TMJ ID (16% involving the right TMJ and 13% involving the left TMJ), whereas 19% had a bilateral TMJ ID and it was concluded that females with bilateral TMJ ID had greater vertical mandibular asymmetry than do females with a unilateral TMJ ID or females with normal TMJs.21
Masahito Maeda et al. (2006) conducted a study to evaluate the symmetrical
features of patients with facial deformities using 3-dimensional-computed tomography (3D-CT). This study was carried out on ninety-six patients who were diagnosed with maxillofacial deformities and underwent orthognathic surgery. All patients were preoperatively examined by CT to simulate the surgery. The results stated that asymmetry was observed most frequently in the mandibular body region and it was concluded that 3D- CT for facial asymmetry has the potential to replace the conventional method of using cephalograms because it permits more detailed evaluation.22
Kazuhiro Yamada et al. (2001) evaluated the condylar bony changes, disk
Review of Literature
9 orthognathic surgery. The results showed that 24.4% of the joints showed condylar bony change which occured unilaterally and bilaterally respectively. A statistically significant association was seen between craniofacial deformity and condylar bony change along with disc displacement.They concluded that craniofacial deformity might be related to TMJ disorders. 23
Sug-Joon Ann, et al. (2005) did a study to evaluatethe relationship between
temporomandibular joint internal derangement and facial asymmetry in women and analyzed by using posteroanterior cephalometric variables, and finally compare this findings with the results of magnetic resonance imaging (MRI).They reported that subjects with unilateral ID or bilateral TMJ ID with greater severity of the unilateral side have greater vertical facial asymmetry. It was concluded that facial asymmetry due to mandibular asymmetry is a clinical sign in patients with TMJ ID. 24
B. Buranastidporn et al. (2006) studied about the temporomandibular joint
Review of Literature
10
Anker et al. (1990) conducted a study on computerized axial tomography in
the diagnosis of internal derangements of the temporomandibular joint. This study composed of fourteen patients with classical TMJ complaints of pain, clicking and locking, together with a variety of associated symptoms, including headache, neck- ache and otalgia were examined clinically by using computerized axial tomography. Results was reported that 12 patients of temporomandibular joints disorders the CAT scan findings correlated accurately (87 per cent) with the surgical findings with respect to meniscal position and degenerative change. In two patients false negative findings were obtained at surgery. It was concluded that computerized axial tomography proved to be highly accurate in diagnosing actual internal derangements of the temporomandibular joint. 26
Hyeon - Shik Hwang Chung Hyon Hwang et al. (2006) studied about
Review of Literature
11 concluded that both 3D and 2D images are useful for better understanding of asymmetrical structures, but 3D was more accurate analysis of chin deviation. 27
Marcel G.P. Cavalcanti et al. (1999) conducted a studyonthree-dimensional
computed tomography landmark measurement in craniofacial surgical planning.Study consisting of nine samples of adult cadaver heads, five males and four females aged between 58 to 70 years, cadaver heads that were placed into an impact force by a special device to promote blunted traumatic craniofacial fractures and were consequently scanned by a spiral CT scanner. Later the linear measurements were used for visualization using software for generating 3D volumetric images.. The results demonstrate that no statistical significant difference between 3D-CT and the physical measurements. Concluded that measurement of skull and facial bone landmarks was accurately detected by 3D images for analysis of surgical planning and treatment evaluation of craniofacial fractures. 28
MGP Cavalcanti, et al. (2004) to assess craniofacial measurements based on
Review of Literature
12
Sun - Hyung Park, et al. (2006) stated thatthree-dimensional (3D) analysis is
essential for making a precise diagnosis of craniofacial morphology. This study sample consisted of 16 men and 14 women. CT images were made with a CT Hi- speed. The subjects were positioned with the Frankfort horizontal (FH) of the CT machine. 3D model reconstructed from axial images. To assess reproducibility of the landmarks, a subject was chosen at random, and 19 landmarks were identified 5 times in 1 session by an operator. Result stated that the measurements were compared with korean normal averages, and no statistically significant differences were found and was concluded that three-dimensional computed tomography can provide information for use in early diagnosis and treatment planning. 30
Janalt Damstra, et al. (2013) evaluated and compared the postero-anterior
Review of Literature
13
R-M yáñez-Vico et al. (2012) on the association between craniofacial
asymmetry and unilateral temporomandibular joint sounds in adult patients using 3D-computed tomography among fourty-one reconstructed 3D-CT models of adult subjects to analyze craniofacial asymmetry. Subjects were divided into two groups based on the presence (n = 20) or absence (n = 21) of unilateral joint sounds.The anatomical 3D-CT measurements were analyzed for both linear and angular measurements. Results reported that asymmetries in the maxillary and mandibular structures were statistically significant (P < 0.05) for subjects with unilateral TMJ sounds and for controls, except in the case of rotation of maxillary jaw and ramus height of mandibular jaw (P > 0.05).
Materials and Methods
14
MATERIALS AND METHODS
SOURCE OF DATA
The present study was a case control study done to evaluate the craniofacial asymmetry in temporomandibular joint disorder patients using 3D-computed tomography. This study was conducted at Vivekanandha Dental College For Women, Elayamapalayam, Tiruchengode, Namakkal Dist, and Tamilnadu, India.
ETHICLAL CLEARANCE
A detailed protocol about the aim and procedures of the present research was approved by the Institutional Ethical Committee, Vivekanandha Dental College for Women, the study was carried out after obtaining ethical clearance.
INCLUSION CRITERIA
Temporomandibular joint disorder patients between the age group of 20-40 years with disc displacement and muscle disorders were included in the study.
The CT images were selected retrospectively as control group for assessing asymmetry index.
EXCLUSION CRITERIA
Maxillofacial injury without fracture
Individuals with missing teeth
Congenital Maxillofacial deformities like chandler aplasia, hypoplasia, and hyperplasia.
Maxillofacial surgery involving TMJ.
Endocrine disorders like hypothyroidism, hyperthyroidism, Hypopitutarism, hyperpitutarism.
Materials and Methods
[image:31.595.222.404.80.347.2]15
Fig 1 Clinical photograph showing the extra- oral examination of TMJ
[image:31.595.216.411.413.675.2]Materials and Methods
[image:32.595.215.411.83.362.2]16
Fig: 3 Extra – Auricular Examination
[image:32.595.221.407.421.658.2]Materials and Methods
[image:33.595.193.437.116.467.2]Materials and Methods
18
MATERIAL USED:
Examination of subjects:
1. Dental chair with good light attachment 2. Disposable gloves and mask
3. Stainless steel kidney tray
4. Disposable paper cups with water 5. Sterilized diagnostic instruments
I. Mouth mirror II. Straight probe III. Explorer IV. Tweezers
V. Cotton rolls VI. Gauze pads
Materials and Methods
[image:35.595.129.501.108.420.2]19
Materials and Methods
20
METHODOLOGY OF THE STUDY
Based on research, diagnostic criteria / Temporomandibular disorders Axis-1 proposed at International Consensus Workshop at International Association for Dental Research (IADR) in the conference conducted at San Diego (2011) as
Group I- Disc displacement Group II-Muscle disorders. Group III - Control group
TABLE: 1 A total of 40 subjects were included and categorized into three
groups.
Group No. of cases Criteria for inclusion
Group I- Disc Displacement 10
Patients diagnosed with temporomandibular joint disorders included in the study group.
Group II - Muscle Disorder 10
Patients diagnosed with muscle tenderness included in the study group.
Group III - Control group 20
[image:36.595.102.533.388.680.2]Materials and Methods
21
PROCEDURES:
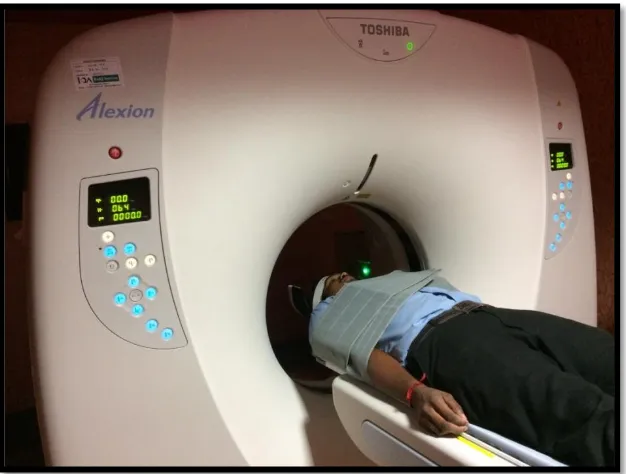
[image:37.595.158.471.221.458.2]The patient asked to bite in centric occlusion and mid-sagittal plane of the patient will be centered during CT.
Fig: 7 Positioning of patient during CT examination
Materials and Methods
22
Evaluation of craniofacial asymmetry:
[image:38.595.122.511.299.721.2]Craniofacial asymmetry was assessed based on the previously reported procedures (R-M Yáñez-Vico 2012). The anatomical 3D-CT measurements that were analyzed as contributory factors of craniofacial asymmetry. A total of 15 measurements were taken, of which 15 were bilaterally evaluated.
TABLE 2- Linear Measurements used for this study:
Measurement Definition
Mandibular ramus height
The distance between the highest point of the condyle head (Cd-sup) and the lowest point of the gonial region (Goinf) (cm)
Mandibular body length
The distance between the most posterior point of the gonial region (Go-post) and the lowest point of the mandibular symphysis (Me); (cm) Mandibular length The distance between Cd-sup and Me (cm)
Maxillary height
From the pulp cavity of the upper first molars (Fm-sup) to the Frankfort horizontal plane (Po-Or-Po) (cm)
Maxillary rotation
The distance between anterior nasal spine (ANS) and the mid-sagittal reference plane (cm)
Mandibular rotation The distance between menton (Me) and the mid-sagittal reference plane (cm)
Glenoid fossa height
Materials and Methods
23
TABLE 3 - Angular Measurementsused for this study:
Frontal ramal inclination
The angle formed by Cd lat-Gonial lateral to the mid-sagittal reference plane (passing through a reference point located equidistant to the points located in the centre of each foramen spinosum –ELSA- and the mid-dorsal point of the foramen magnum –MDFM
Lateral ramal inclination
The angle formed by the most posterior points of the condyle head and the gonial region (Condyle
posterior-Gonial posterior ) with the Frankfort plane
Maxillary cant The angle formed by the most concave points of the maxilla and ANS and mid-sagittal reference plane
Mandibular cant The angle formed by the bilateral Goinf and Me and the mid-sagittal reference plane
Canted occlusal plane
The angle formed by the occlusal plane (passing through the occlusal surfaces of the first molars and first bicuspids) to the mid-sagittal reference plane
Anterior glenoid fossa angulation
The angle formed by the most superoposterior point of glenoid fossa (Glenoid Fossa posterior superior) and the most inferior point of the articular tubercle (Glenoid Fossa anterior ) with the Frankfort plane
Posterior glenoid fossa angulation
The angle formed by the most superoposterior point of the glenoid fossa (Glenoid Fossa posterior
Materials and Methods
[image:40.595.187.446.79.297.2]24
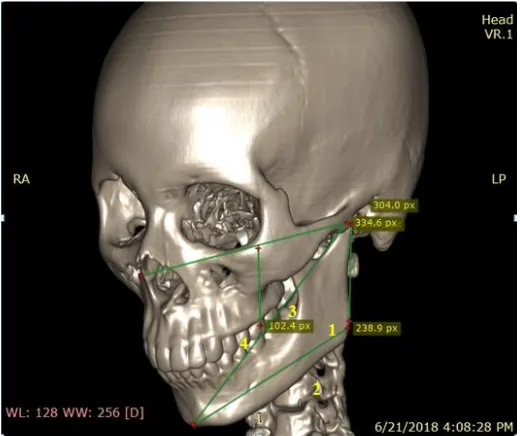
FIG: 8 Right side asymmetry measurement used to calculate craniofacial asymmetry on the reconstructed 3D- CT model. Note linear measurements in the picture:1) Mandibular ramus height; (2) Mandibular body length; (3) Mandibular
length; (4) Maxillary height.
Fig: 9 Left side asymmetry measurement used to calculate craniofacial asymmetry on the reconstructed 3D- CT model. Note linear measurements in the picture:1) Mandibular ramus height; (2) Mandibular body length; (3) Mandibular length; (4)
[image:40.595.187.447.405.623.2]Materials and Methods
[image:41.595.192.440.144.354.2]25
Fig: 10 Both Maxillary Rotation And Mandibular Rotation
[image:41.595.195.439.445.649.2]Materials and Methods
[image:42.595.174.460.145.390.2]26
Fig: 12 Frontal Ramal Inclination
[image:42.595.165.465.448.696.2]Materials and Methods
[image:43.595.171.469.126.371.2]27 .
Fig: 14 Canting Of Occlusal Plane
[image:43.595.169.466.429.678.2]Materials and Methods
[image:44.595.163.469.103.360.2]28
Fig: 16 Mandibular Cant
[image:44.595.162.473.413.672.2]Materials and Methods
[image:45.595.176.458.101.342.2]29
Fig: 18 Posterior glenoid fossa angulation
Reliability of the method:
Statistical Analysis
30
STATISTICAL ANALYSIS
Results
31
RESULTS
Table: 4 Distribution of the study population
The total sample composed of 40 subjects, with 20 in study group and 20 in control groups age range were between 20 - 40 years with mean in the study group (28.20) ±7.36) , and (28.60) ± 6.69 ) in control group . p - value of age between the groups was 0.858 with indicates that there was no statistically significant difference between the age of both groups.
Group N Mean SD SE T p
Age
Control group 20 28.60 6.69 1.50
[image:48.595.127.506.291.396.2]0.18 0.858 Study group 20 28.20 7.36 1.65
Table: 5 Gender wise comparisons of study and control groups
Group
Gender
Total
Male Female
N % N %
Control group 16 80 4 20 20
Study group 5 25 15 75 20
[image:48.595.115.514.446.625.2]Total 21 53 19 47 40
Results
32
Table 6: Comparison of linear measurement between study and
control groups on right side.
LINEAR MEASUREMENT:
Right side N Mean SD SE ANOVA P
Mandibular ramus Height
Control group 20 2.20a 0.51 0.11
42.25 0.001** Disc Displacement 10 3.79 b 0.56 0.12
Muscle Disorder 10 3.50 b 0.68 0.15 Total 40 3.16 0.91 0.12 Mandibular body
length
Control group 20 2.77 a 0.61 0.14
49.71 0.001** Disc Displacement 10 5.18 b 0.90 0.20
Muscle Disorder 10 4.75 b 0.90 0.20 Total 40 4.23 1.33 0.17
Mandibular length
Control group 20 3.71 a 1.24 0.28
91.61 0.001** Disc Displacement 10 7.82 b 1.01 0.23
Muscle Disorder 10 7.83 b 1.07 0.24 Total 40 6.45 2.24 0.29
Maxillary Height
Control group 20 2.33 a 0.61 0.14
0.35 0.703 Disc Displacement 10 2.47 b 0.56 0.13
Muscle Disorder 10 2.45 b 0.56 0.13 Total 40 2.42 0.57 0.07
Glenoid fossa height
Control group 20 0.17 a 0.09 0.02
0.49 0.614 Disc Displacement 10 0.20 b 0.10 0.02
Muscle Disorder 10 0.20 b 0.10 0.02 Total 40 0.19 0.10 0.01
Maxillary rotation
Control group 20 0.61 a 0.16 0.04
1.36 0.264 Disc Displacement 10 0.51 b 0.26 0.06
Muscle Disorder 10 0.51 b 0.26 0.06 Total 40 0.54 0.23 0.03
Mandibular rotation
Control group 20 0.86 a 0.22 0.05
0.07 0.933 Disc Displacement 10 0.83 b 0.38 0.08
Muscle Disorder 10 0.83 b 0.38 0.08 Total 40 0.84 0.33 0.04 * Significant at 5 %; ** Significant at 1 %
Results
33 The mean value of mandibular ramus height in disc displacement cases was (3.79 ± 0.56), and in muscle disorders was 3.50 ± 0.68, while control group showed mean values of 2.20 ±0.51, and the p- value was statistically significant (0.001**).
The mean value of mandibular body length in disc displacement was (5.18) ± 0.90 and in muscle disorder cases 4.75 ± 0.90, while control group showed mean values of 2.77 ± 0.61, and the p- value was statistically significant (0.001**) using ANOVA test.
The mean value of mandibular length in disc displacement was (7.82) ± 1.01and in muscle disorder cases 7.83 ± 1.07, while control group showed mean values of 1.24. ± 0.28, and the p- value was statistically significant 0.001**
The mean value of maxillary height in the disc displacement was (2.47) ± 0.56 and in muscle disorder cases was 2.45 ± 0.56, while control group showed mean values of 2.33 ± 0.61, and the p- value was not statistically significant 0.703.
The mean value of glenoid fossa height in disc displacement was (0.20) ± 0.10 and in muscle disorder cases was 0.20 ± 0.10, while control group showed mean values of 0.17 ± 0.09, and the p- value was not statistically significant 0.614.
The mean value of maxillary rotation in disc displacement was (0.51) ± 0.26 and in muscle disorder cases was 0.51 ± 0.26, while control group showed mean value of 0.61 ± 0.16, and the p- value was not statistically significant 0.264.
Results
34
Table:7 Comparison of linear measurement between study and
control groups on left side
LINEAR MEASUREMENT:
Left side N Mean SD SE ANOVA P
Mandibular ramus Height
Control group 20 2.429a 0.668 0.149
11.74 0.001** Disc Displacement 10 3.659 b 1.024 0.229
Muscle Disorder 10 3.623 b 1.007 0.225 Total 40 3.237 1.068 0.138 Mandibular
body length
Control group 20 3.018 a 0.932 0.208
45.17 0.001** Disc Displacement 10 5.160 b 0.754 0.169
Muscle Disorder 10 5.135 b 0.755 0.169 Total 40 4.438 1.292 0.167 Mandibular
Length
Control group 20 3.569 a 0.768 0.172
124.05 0.001** Disc Displacement 10 7.678 b 1.045 0.234
Muscle Disorder 10 7.629 b 1.004 0.225 Total 40 6.292 2.153 0.278 Maxillary
Height
Control group 20 1.885 a 0.370 0.083
29.93 0.001** Disc Displacement 10 2.602 b 0.314 0.070
Muscle Disorder 10 2.588 b 0.317 0.071 Total 40 2.358 0.471 0.061 Glenoid
fossa height
Control group 20 0.134 a 0.015 0.003
10.14 0.001** Disc Displacement 10 0.224 b 0.087 0.020
Muscle Disorder 10 0.217 b 0.084 0.019 Total 40 0.192 0.081 0.010 Maxillary
Rotation
Control group 20 0.258 a 0.073 0.016
4.39 0.017* Disc Displacement 10 0.590 b 0.495 0.111
Muscle Disorder 10 0.571 b 0.475 0.106 Total 40 0.473 0.421 0.054 Mandibular
Rotation
Control group 20 0.534 a 0.250 0.056
15.11 0.001** Disc Displacement 10 1.078 b 0.405 0.091
[image:51.595.85.549.167.666.2]Results
35 Table 7 showed the linear measurement of craniofacial asymmetry in left side showed that the mean value of mandibular ramus height in disc displacement was (3.659) ± 1.024, and in muscle disorders was 3.623 ± 1.00, while control group showed mean value of 2.429 ± 0.668, and the p- value was statistically significant 0.001**.
The mean value of mandibular body length in disc displacement was (5.160) ± 0.754 and in muscle disorder was 5.135 ± 0.755,while control group showed mean values of 3.018± 0.932, and the p- value was showed statistically significant 0.001**.
The mean value of mandibular length in disc displacement was (7.678) ± 1.045 and in muscle disorder was 7.629 ± 1.004, while control group showed mean values of 3.569. ± 0.768, and the p- value showed statistically significant 0.001**
The mean value of maxillary height in disc displacement was (2.602) ± 0.314 and in muscle disorder cases was 2.588 ± 0.317, while control group showed mean values of 1.885 ± 0.370, and the p- value was statistically significant 0.001**.
The mean value of glenoid fossa height in disc displacement was (0.224) ± 0.087 and in muscle disorder cases was 0.217 ± 0.084, while control group showed mean values of 0.134 ± 0.015, and p- value was not statistically significant 0.001**.
The mean value of maxillary rotation in disc displacement was (0.590) ± 0.495 and in muscle disorder cases was 0.571 ± 0.475, while control group showed mean values of 0.258 ± 0.073, and the p- value was statistically significant 0.017*.
Results
36
Table: 8 COMPARISON OF ANGULAR MEASUREMENT
BETWEEN STUDY AND CONTROL GROUPS ON RIGHT SIDE
ANGULAR MEASREMENT:
Right N Mean SD SE ANOVA P
Mandibular Angle
Control group 20 92.98 12.18 2.72
82.17 0.001** Disc
Displacement
10 124.24 6.52 1.46 Muscle disorder 10 123.14 6.24 1.40 Total 40 113.45 16.95 2.19
Frontal ramal inclination Control group 20 10 10 20.57 22.40 21.61 4.08 3.91 3.86 0.91 0.87 0.86
1.08 0.346 Disc
Displacement Muscle disorder
Total 40 21.52 3.96 0.51
Lateral ramal inclination Control group 20 10 10 55.24 87.67 85.92 13.61 4.38 4.91 3.04 0.98 1.10
87.32 0.001** Disc
Displacement Muscle disorder
Total 40 76.27 17.29 2.23
Cant Occlusal Plane Control group 20 10 10 50.10 83.16 81.46 5.49 4.59 4.51 1.23 1.03 1.01
290.68 0.001** Disc
Displacement Muscle disorder
Results
37 Maxillary cant
Control
group 20 71.76 14.04 3.14
3.66 0.032* Disc
Displacement
10 89.18 20.28 4.54 Muscle
Disorder
10 81.63 25.34 5.67
Total 40 80.86 21.32 2.75
Mandibular cant
Control
group 20 64.10 89.56 20.03
0.06 0.945 Disc
Displacement
10 59.76 16.07 3.59 Muscle
Disorder
10 58.76 15.72 3.52
Total 40 60.87 52.45 6.77
Anterior glenoid Fossaangulation
Control
group 20 22.56 8.29 1.85
4.76 0.012* Disc
Displacement
10 29.47 7.45 1.67 Muscle
Disorder
10 28.57 7.34 1.64 Total 40 26.87 8.18 1.06 Posterior
glenoid fossa angulation
Control
group 20 86.91 23.47 5.25
22.06 0.001** Disc
Displacement
10 122.8 16.47 3.68
Muscle
Results
38 Table 8 showed the angular measurement of craniofacial asymmetry in right side showed that the mean value of mandibular angle in disc displacement 124.24 ± 6.52, and in muscle disorder was 123.14 ± 6.24, while control group showed mean values of 92.98 ± 12.18, and the p- value was statistically significant 0.001**.
The mean value of frontal ramal inclination in disc displacement was 22.40 ± 3.91, and in muscle disorder cases was 21.61 ± 3.86, while control group showed mean values of 20.57 ± 4.08, and the p- value was not statistically significant 0.346.
The mean value of lateral ramal inclination in disc displacement was 87.67± 4.38, and in muscle disorder cases was 85.92 ± 4.91, while control group showed mean value of 55.24 ± 13.61, and the p- value was statistically significant 0.001**.
The mean value of cant occlusal plane in disc displacement was 83.16± 4.59, and in muscle disorder cases was 81.46 ± 4.51, while control group showed mean values of 50.10 ± 5.49, and the p- value was statistically significant 0.001**.
The mean value of maxillary cant in disc displacement was 93.10 ± 7.11, and in muscle disorder cases was 91.90 ± 7.19, while control group showed mean values of 57.41 ± 10.86, and the p- value was statistically significant 0.001**.
The mean value of mandibular cant in disc displacement was 54.88 ± 9.01, and in muscle disorder cases was 53.08 ± 8.84, while control group showed mean values of 64.10 ± 89.56, and the p- value was not statistically significant 0.775.
The mean value of anterior glenoid fossa angulation in disc displacement 31.61 ± 12.52, and in muscle disorder was 30.19± 12.11, while control group showed mean values of 22.56 ± 8.29, and the p- value was not statistically significant 0.028.
Results
39 showed mean values of 86.91 ± 23.47, and the p- value was statistically significant 0.001**.
Table: 9 Comparison of angular measurement between study and
control groups on left side
Left side N Mean SD SE ANOVA P
Mandibular angle
Control group 20 87.06 11.13 2.49
119.37 0.001** Disc
Displacement 10 120.44 4.99 1.12 Muscle
Disorder 10 118.54 5.29 1.18 Total 40 108.68 17.18 2.22
Frontal ramal inclination
Control group 20 19.08 6.23 1.39
9.34 0.001** Disc
Displacement 10 26.80 4.39 0.98 Muscle
Disorder 10 24.75 6.69 1.50 Total 40 23.54 6.63 0.86
Lateral ramal inclination
Control group 20 47.23 4.22 0.94
401.87 0.001** Disc
Displacement 10 84.78 5.13 1.15 Muscle
Disorder 10 83.38 4.85 1.08 Total 40 71.79 18.14 2.34
Cant Occlusal Plane
Control group 20 49.38 5.22 1.17
156.85 0.001** Disc
Displacement 10 81.75 7.24 1.62 Muscle
Disorder 10 81.00 7.13 1.59 Total 40 70.71 16.53 2.13
Maxillarycant
Control group 20 71.76 14.04 3.14
3.66 0.032* Disc
Displacement 10 89.18 20.28 4.54 Muscle
Disorder 10 81.63 25.34 5.67 Total 40 80.86 21.32 2.75
Mandibular cant
Control group 20 64.10 89.56 20.03
0.06 0.945 Disc
Displacement 10 59.76 16.07 3.59 Muscle
Results
40 Anterior glenoid
fossa angulation
Control group 20 22.56 8.29 1.85
4.76 0.012* Disc
Displacement 10 29.47 7.45 1.67 Muscle
Disorder 10 28.57 7.34 1.64 Total 40 26.87 8.18 1.06
Posterior glenoidfossa angulation
Control group 20 86.91 23.4 5.25
18.37 0.001** Disc
Displacement
10 118.2 15.7 3.53
Muscle Disorder
10 116.3 14.4 3.22
Total 40 107.1 23.1 2.98 * Significant at 5 %; ** Significant at 1 %
Table 9 showed the angular measurement of craniofacial asymmetry in left side showed that the mean value mandibular angle in disc displacement cases was 120.44 ± 4.99, and in muscle disorder cases was 118.554 ± 5.29, while control group showed mean values of 87.06 ± 11.13, and the p- value was statistically significant 0.001**.
The mean value of frontal ramal inclination in disc displacement was 26.80 ± 4.39, and in muscle disorders was 24.75 ± 6.69, while control group showed mean values of 19.08 ± 6.23, and the p- value was statistically significant 0.001**.
[image:57.595.108.531.73.419.2]Results
41 The mean value of cant occlusal plane in disc displacement was81.75± 7.24, and in muscle disorder cases was 81 ± 7.13, while control group showed mean values of 49.38 ± 5.22, and the p- value was statistically significant 0.001**.
The mean value of maxillary cant in disc displacement was 89.18 ± 20.28, and in muscle disorder cases was 81.63 ± 25.3, while control group showed mean values of 71.76 ± 14.04, and the p- value was not statistically significant 0.032.
The mean value of mandibular cant in disc displacement was 59.76 ± 16.07, and in muscle disorder cases was 58.76 ± 15.72, while control group showed mean values of 64.10± 89.56, and the p- value was not statistically significant 0.945.
The mean value of anterior glenoid fossa angulation in disc displacement 29.47 ± 7.45, and in muscle disorder cases was 28.57± 7.34, while control group showed mean values of 22.56 ± 8.29, and the p- value was not statistically significant 0.012*.
The mean value of posterior glenoid fossa angulation in disc displacement of 118.24± 17, and in muscle disorder cases was 116.33± 14.42, while control group showed mean values of 86.91 ± 23.47, and the p- value was statistically significant 0.001**.
Results
52
Graph:1 Comparison of mean age of study and control groups.
28 28.1 28.2 28.3 28.4 28.5 28.6
Control group
Study group 28.6
28.2
M
e
an
Results
53
Graph:2 comparisons of percentage between the gender in study and
control groups
0 10 20 30 40 50 60 70 80
Male Female
80
20 25
75
Per
ce
n
tage
Results
54
Graph: 3 Comparison of linear measurement between study and
control groups on right side
2.20 2.77 3.71 2.33 0.17 0.61 0.86 3.79 5.18 7.82 2.47 0.20 0.51 0.83 3.50 4.75 7.82 2.45 0.20 0.51 0.83
0.00 1.00 2.00 3.00 4.00 5.00 6.00 7.00 8.00 9.00 Mandibular ramus Height
Mandibular body length Mandibular length Maxillary Height Glenoid fossa height Maxillary rotation Mandibular rotaion
Mean
Right side
Results
55
Graph:4 Comparison of linear measurement between study and
control groups on left side
2.43 3.02 3.57 1.89 0.13 0.26 0.53 3.66 5.16 7.68 2.60 0.22 0.59 1.08 3.62 5.13 7.63 2.59 0.22 0.57 1.08
0.00 1.00 2.00 3.00 4.00 5.00 6.00 7.00 8.00 9.00 Mandibular ramus Height
Mandibular body length Mandibular length Maxillary Height Glenoid fossa height Maxillary rotation Mandibular rotaion
Mean
Left side
Results
56
Graph: 5 Comparison of angular measurement between study and
control groups on right side.
92.98 20.57 55.24 50.10 57.41 64.10 22.56 86.91 124.24 22.40 87.67 83.16 93.10 54.88 31.61 122.88 123.14 21.61 85.92 81.46 91.90 53.08 30.19 120.88
0.00 20.00 40.00 60.00 80.00 100.00 120.00 140.00 Mandibular angle
Frontal ramal inclination Lateral ramal inclination Can’t Occlusal Plane Maxillary cant Mandibular cant Anterior glenoid fossa angulation Posterior glenoid fossa angulation
Mean
Right side
Results
57
Graph: 6 Comparison of angular measurement between study and
control groups on left side.
19.08 47.23 49.38 71.76 64.10 22.56 86.91 26.80 84.78 81.75 89.18 59.76 29.47 118.24 24.75 83.38 81.00 81.63 58.76 28.57 116.33
0.00 20.00 40.00 60.00 80.00 100.00 120.00 140.00 Frontal ramal inclination
Lateral ramal inclination Can’t Occlusal Plane Maxillary cant Mandibular cant Anterior glenoid fossa angulation Posterior glenoid fossa angulation
Mean
Left side
Discussion
48
DISCUSSION
Internal derangement due to TMJ disc displacement (DD) is a common disorder in the general population. The etiology of the internal derangements of the TMJ is still unclear. 33 Prevalence of TMD has been reported in various literatures, Matsuka revealed 46%, Maglione 27%, Riva 26%, Gesch 25%, and Ageberg 20% of the prevalence of TMD noted. 34 Correlating the clinical symptoms of TMJ disorders, the cause for it is still controversywhich is given by Widmalm et al, 1992 35.
Mandibular asymmetry due to many factors like morphological disorder, growth disharmony, and trauma, tumors, or condyle or hemimandibular hypertrophy.36 Functional factors, such as bruxism, masticatory dysfunction or occlusal abnormalities, may also play a role.37
Boring was first to note skeletal alteration in adolescents with temporomandibular dysfunction (TMD) 38. Later in 1977, Maglione found an increase in divergence of the basals and the sella-nasion (SN) plane, mainly due to an increase in the gonial angle, involving posterior shortening of the face 39. Dibbetts confirmed similar findings. 40
In 1985, a study on dysfunctional patients with disc displacement by Katzberg, et al. First reported an association between maxillary asymmetry and internal derangement in a series of pediatric patients. 41
Discussion
49 But abnormality in the shape and size of the mandibular ramus and body leads to mandibular asymmetry in TMD (Ahn et al, 2005). The interference of occlusal problem is also one of the reasons for facial asymmetry.
According to Akimoto et al, Buranastidporn et al, 2006 suggested that the cause for facial asymmetry is the difference in masticatory activity. But Fushima et al put forward that difference in condylar movement is the reason for facial asymmetry.
Temporomandibular joint disorder like internal derangement can result in mandibular asymmetry, given by (Schellhas KP, Gidarakou IK, Schellhas KP, Piper MA) 43,44,45
Trpkova et al also reported that using frontal radiographs in females with bilateral TMJ-ID had significantly greater asymmetry in the vertical position of the antigonion. Panagiotis Kambylafkasa did a study to evaluate the association between unilateral degenerative joint disease (UDJD) and concluded that group with disease affected on right side, did not exhibit significant differences compared with the controls. 46
Based on previous studies, the deviation in dentofacial morphological changes in mandible was detected by using conventional radiographs. But recently (Inui M, Fushima K, Sato S 1999 et al), the deviation in temporomandibular joint disorder was investigated with reconstructed 3D computed tomography. (Yanez -Vico et al, 2010) The measurements of the present study were made with reconstructed 3D computed tomography.
Discussion
50 concluded that adult patients with unilateral joint sounds may have skeletal jaw asymmetry and a canted occlusal plane.
The total sample of 40 subjects comprising 20 study groups and 20 control groups age range of 20 - 40 years and mean values of the study group was found to be (28.20) ±7. 36, and control group was found (28.60) ± 6.69 and p–value showed 0.858 which indicated that there was no statistical significant difference between the gender of both groups. (Table 1)
In this study linear parameters like mandibular ramus height, mandibular body length, mandibular length, maxillary height, glenoid fossa height, maxillary rotation, mandibular rotation were taken, which was measured on both right and left sides. The linear parameters which showed highly statistically significant with p < 0.001. In the present study were mandibular ramus height, mandibular body length, and mandibular length on right side , whereas linear parameters like mandibular ramus height, mandibular body length, mandibular length, maxillary height, glenoid fossa height, and mandibular rotation showed high statistical significance with p value < 0.001 on left side.
Legrell and Isberg ,1999 conducted a study on mandibular length and midline asymmetry after experimentally inducing temporomandibular joint disc displacement in rabbits and concluded that disc displacement in growing rabbits cause asymmetry of mandibular length with midline shift to the ipsilateral side. But in our study mandibular length show statistically significant differences between study and control group. 47
Discussion
51 showed that the mean values of ramus height were 4.96 ± 1.04 which was not statistical significant. In our study, we found the mean values of 3.16 ± 0.91 with statistical significance were reported. 48
Eun-Sun Byun, Sug -Joon Ahn, and Tae - Woo Kim (2005) conducted a study on the relationship between internal derangement of the temporomandibular joint and dentofacial morphology in women with anterior open bite. They concluded that cephalometric characteristics, like decrease in ramus height, and backward rotation and retruded position of the mandible, are associated with TMJ internal derangement in women with anterior open bite. The present study was not conducted in relation to any open bite patients.
A similar study was done by Rosa María Yánez -Vico et al (2013) on evaluating the craniofacial asymmetry using computed tomography and the parameters used for linear measurements were mandibular body length, mean values were found to be 0.9 ± 0.33968, ramal height with mean values of 0.3473 ± 0.2566 and maxillary height with mean values of 0.0782 ± 0.03868 and concluded that there was statistically significant differences with (p<0.05) was found between symmetric and asymmetric patients. But in our study maxillary height does not showed any statistically significant differences.
Discussion
52 asymmetry. But in our study, the mean value was found in all three linear parameters showed statistically significant difference except maxillary height on the right side, whereas left side showed significant association.
Hyung - Joo Choia et al conducted a study in (2011) to evaluate the relationship between temporomandibular joint disk displacement and mandibular asymmetry in skeletal Class III patients. Their results reported that the mandibular ramus height had a mean value of (56.4 ± 3.6) and mandibular body length found to be mean value of 81.9 6 ± 7.2. 49
Michael L. Riolo, et al conducted a study association between occlusal characteristics and signs and symptoms of TMJ dysfunction in children and young adults. Their results showed that functional shift was negatively associated with TMJ and muscle tenderness, open bite was positively associated with TMJ and muscle tenderness; but present study showed positively associated with disc displacement and followed by muscle disorders group. 50
Paula Furlan Bavia et al conducted a study in the year 2016, investigated the association between craniofacial morphology and temporomandibular joint disorder in adults. In their study results showed that with TMD (painful and non-painful) of mean value was 27.8 (6.1) and without TMD was 25.9 (5.2) and concluded that TMD is not associated with vertical craniofacial morphology. The present study is contrast to above in which there is association between craniofacial asymmetry and temporomandibular joint disorder which is found on the left side of the jaw. 51
Discussion
53 left glenoid fossa could be a contributory factor in TMJ disorder. 52 It is similar to the present study which showed that mean value of glenoid fossa height was found to be 0.224 ± 0.087 and the p- value was statistically significant on left side (Takahashi, 1991) 53
Angular parameters which were used on the right side are mandibular angle, lateral ramal inclination, cant occlusal plane, maxillary cant, anterior glenoid fossa and posterior glenoid fossa angulation and the angular parameters showed highly statistically significant with p < 0.001. (Table 5)
Angular parameters which were used on the left side are mandibular angle, frontal ramal inclination, lateral ramal inclination, cant occlusal plane, posterior glenoid fossa followed by anterior glenoid fossa and angulation, maxillary cant showed highly statistical significance on left side (Table 6).
Discussion
54 Another study done by Rosa Maria Yanez -Vico in 2010 in which three-dimensional evaluation of craniofacial asymmetry was done using computed tomography and stated that lateral inclination of the mandibular ramus was shown to had the greatest asymmetrical deviation, followed by the frontal inclination of the mandibular ramus. But it is contrast to the present study showed that lateral ramal inclination showed highest deviation followed by frontal ramal inclination on both sides.
Tallents RH,1991 conducted a study on angular and linear comparisons with unilateral mandibular asymmetry and concluded that there was no significant difference between with unilateral mandibular condylar hyperplasia and unilateral internal derangement. But in our study it was found that there is highly statistical significant on both sides of temporomandibular joint disorders.54
Olcay Sakar et al conducted a study on evaluation of the effects of temporomandibular joint disc displacement and its progression on dentocraniofacial morphology in symptomatic patients using lateral cephalometric analysis, and concluded that dental and soft tissue measurements did not reveal any differences, but variables related to the mandible showed statistically significant differences. 55
Discussion
Summary
56
SUMMARY
A study tilted of “Evaluation of craniofacial asymmetry in temporomandibular joint disorders using 3D - computed tomography”was conducted in department of oral medicine and radiology at Vivekanandha Dental College For Women between 2016 to 2018.It was a cross sectional study with 10 cases in the temporomandibular joint disorder patients, 10 cases in the muscle disorder group , 20 cases were taken in the control groups.
The temporomandibular joint disorder patients between the age group of 20-40 years with disc displacement and muscle disorders were included in the study. All the patient were scanned using spiral computed tomography and the images were reconstructed into 3D format using DICOM software.Linear and angular parameters of craniofacial structures were measured to assess to craniofacial asymmetry.
The following inferences were made in the present study:
There was no statistically significant difference in age between study and control both groups.( p-value 0.858)
On comparing right side linear measurements between study and control groups, mandibular ramus height, mandibular body length and mandibular length was statistically significant (p-value 0.001**)
Summary
57
On comparing right side angular measurements between study and control groups, mandibular angle, lateral ramal inclination,cant occlusal plane, posterior glenoid fossa angulation were highly significant ( p -value 0.001**).
On comparing left side angular measurements between study and control groups, mandibular angle,frontal ramal inclination, cant occlusal plane, posterior glenoid fossa angulation were highly significant (p-value 0.001**).
Conclusion
58
CONCLUSION
To sum up, the present study was done to assess the asymmetry index in temporomandibular joint disorders patients, and compare with healthy subjects using 3D computed tomography.The results showed that craniofacial asymmetry can be used as a effective predictor for diagnosis of temporomandibular disorders which can be utilized in the management of this condition at on early stage.
Bibilography
59
BIBLIOGRAPHY
1. List T, Jensen RH. Temporomandibular disorders: Old ideas and new concepts. Cephalalgia. 2017 Jun; 37 (7): 692–704.
2. LeRescheL.Epidemiology of Temporomandibular Disorders: Implications for the Investigation of Etiologic Factors. Crit Rev Oral Biol Med. 1997 Jul; 8 (3): 291–305. 3. Hall HD: Intra-articular disc displacement Part II: Its significant role in temporomandibular joint pathology.1995 J Oral Maxillofac Surg 53:1073, 1995 4. Carlson CR, Okeson JP, FalaceDA, et al: Etiology of functional disturbances in the masticatory system. Textbook.2013 7 (3): 102-110.
5. Wilkes CH: Internal derangements of the temporomandibular joint: Pathological variation. Arch. 1989; Otolaryngol Head Neck Surg 115:469.
6. Corner bd, Richtsmeeer jt. Morphometric analysis of craniofacial growth in Cebus appella. American Journal of Physical Anthropology1991; (84)323-342.
7.Fearon, C.G., Serwatka, W.J. A common denominator for nonorganic TMJ pain-dysfunction. J.Prosthet. Dent. 1983; 49, 805–808.
8. Ciancaglini R, Colombo-Bolla G, Gherlone EF, Radaelli G. Orientation of craniofacial planes and temporomandibular disorder in young adults with normal occlusion. J Oral Rehabil. 2003 Sep;30(9):878-86. [Medline: 12950968] [doi: 10.1046/j.1365-2842.2003.01070.x
Bibilography
60 Population around Patna: A Population Based Study. Ann. Int Med. Den. Res. 2017; 3 (4): DE16-DE18.
11.Ohrbach R and Dworkin SF. The evolution of TMD diagnosis: Past, present, future. J Dent Res 2016; 95: 1093–1101.
12.Slade GD, Ohrbach R, Greenspan JD, et al. Painful temporomandibular disorder: Decade of discovery from OPPERA studies. J Dental Res 2016; 95: 1084–1092. 13.Schiffman EL, Truelove EL, Ohrbach R, et al. The research, diagnostic criteria for temporomandibular disorders. I: Overview and methodology for assessment of validity. J Orofac Pain 2010; 24: 7–24.
14.Velly AM, List T and Lobbezoo F. Comorbid pain and psychological conditions in patients with orofacial pain. In: Sessle BJ (end) Orofacial pain. Recent advances in assessment, management, and understanding of mechanisms. Washington, DC: IASP Press, 2014, pp.53–73.
15.Drangsholt M. Temporomandibular Pain. In: Crombie I, Croft P, Linton S, et al. (Ends) Epidemiology of pain. Seattle: IASP Press, 1999, pp.203–234.
16.Fushima K, Inui M, Sato S. Dental asymmetry in temporomandibular disorders. J Oral Rehabil 1999; 26: 752–756.
17.Eun-Sun Byun, Sug-Joon Ahn, and Tae-Woo Kim. Relationship between internal derangement of the temporomandibular joint and Dentofacial morphology in women with anterior open bite.(Am J Orthod Dentofacial Orthop 2005; 128:87- 95)
Bibilography
61 the temporomandibular joint in patients with facial asymmetry. Oral Science International 10 (2013) 65– 69.
19.J Koyama, H Nishiyama and T Hayashi. Follow-up study of condylar bony changes using helical computed tomography in patients with temporomandibular disorder. Dentomaxillofacial Radiology 2007; 36, 472–477
20.Jaime Gateno et al. A Comparative Assessment of Mandibular Condylar Position in Patients With Anterior Disc Displacement of the Temporomandibular Joint. American Association of Oral and Maxillofacial Surgeons J Oral Maxillofac Surg 2004; 62:39-43.
21.Trpkova B, Major P, Nebbe B, Prasad N.Craniofacial Asymmetry and temporomandibular joint internal derangement in female adolescents: A posteroanterior cephalometric study. Am J Orthod Dentofacial Orthop. 2000; 123: 512-520.
22.Masahito Maeda et al 3D-CT evaluation of facial asymmetry in patients with maxillofacial deformities. (Oral Surg Oral Med Oral Pathol Oral Radiol Endod 2006;102:382-90)
23. Kazuhiro Yamada, et al. Condylar bony change, disk displacement, and signs and symptoms of TMJ disorders in orthognathic surgery patients. Oral Surg Oral Med Oral Pathol Oral Radiol Endod 2001; 91:603-10.
Bibilography
62 joint internal derangement in mandibular asymmetry. What is the relationship?.Eur J Orthod 2006; 28: 83 –88.
26.A. H. Anker. Computerized axial tomography in the diagnosis of internal derangements of the temporomandibular joint. Australian Dental Journal 1990; 35 (3):253-7
27.Hwang H-S, Hwang CH, Lee KH, Kang BC. Maxillofacial 3dimensional image analysis for the diagnosis of facial asymmetry. Am J Orthod Dentofacial Orthop. 2006; 130:779–785
28.Cavalcanti MG, Haller JW, Vannier MW Three dimensional computed tomography landmark measurement in craniofacial surgical planning: experimental validation in vitro. J Oral Maxillofac Surg 1999 ; 57:690–694.
29.Cavalcanti MG, Rocha SS, Vannier MW Craniofacial measurements based on 3D-CT volume rendering: implications for clinical applications. Dentomaxillofac Radiol. 2004 May; 33(3) :170-176.
30.Sun-Hyung Park, Hyung-Seog Yu, Kee-Deog Kim, Kee-Joon Lee, and Hyoung-Seon Baik. A proposal for a new analysis of craniofacial morphology by 3-dimensional computed Tomography. Am Orthod Dentofacial Orthop 2006;129:600.e23-600.e34.
31.Damstra J, Fourie Z, Ren Y. Evaluation and comparison of posterior-anterior cephalograms and cone-beam computed tomography images for the detection of mandibular asymmetry. Eur J Orthod. 2013; 35: 45-50.
Bibilography
63 temporomandibular joint sounds in adult patients using 3D-computed tomography. Oral Diseases (2013) 19, 406-414.
33. Horacio O. Maglione. Temporomandibular Dysfunction: Internal Derangement Associated with Facial and/or Mandibular Asymmetry Horacio O. Maglione, D.D.S., Ph.D. The journal of craniomandibular & sleep practice. october 2013, VOL. 31, NO.4
34.. Matsuka Y, Yatani H, Kuboki T, amashita A: Temporal disorders in the adult population of Okayama City, Japan. J Craniomandib Pract1996; 14:158-162.
35.Widmalm SE, Westesson PL, Brooks SL, Hatala MP, Paesani D. Temporomandibular joint sounds: correlation of joint structure in fresh autopsy specimens. Am J Orthod Dentofac Orthop. 1992; 101: 60-61.
36.Kawakami M, Yamamoto K, Inoue M, Kawakami T, Fujimoto M, Kirita T. Morphological differences in the temporomandibular joints in asymmetrical prognathism patients. Orthod Craniofac Res 2006; 9: 71–76.)
37.Inui M, Fushima K, Sato S. Facial asymmetry in temporomandibular joint disorders. J Oral Rehabil 1999; 26: 402–406.)
38.Boering G: Arthrosis deformans van het kaakgewricht[thesis].Stafleu en Tholen, Leiden) 1966.
Bibilography
64 40.Dibetts J, Van Der L: Symptoms of TMJ dysfunction indicators of growth patterns? J Pedodont1985; 9:265-284)
41.Katzberg R, Tallents R, Hayakawa K, Millar T, Gaske M, et al.: Internal derangement of the temporomandibular joint: finding in the pediatric age group. Radiology1985; 154:125-127.
42.VF Ferrario, C Sforza, A Miani, Jr, and G Serrao. A three-dimensional evaluation of human facial asymmetry.J Anat. 1995 Feb; 186 (Pt 1): 103–110.
43.Schellhas KP, Piper MA, Omlie MR. Facial skeleton remodeling due to temporomandibular joint degeneration: an imaging study of 100 patients. Cranio. 1992;10:248–259.
44.Gidarakou IK, Tallents RH, Kyrkanides S, Stein S, Moss M. Comparison of skeletal and dental morphology in asymptomatic volunteers and symptomatic patients with bilateral degenerative joint disease. Angle Orthod. 2003;73:71–78. 17.
45.Schellhas KP, PiperMA, Bessette RW, Wilkes CH. Mandibular retrusion, temporomandibular joint derangement, and orthognathic surgery planning. Plast Reconstr Surg. 1992;90:218–229.
46.Panagiotis Kambylafkasa; Stephanos Kyrkanides; Ross H. Tallents. Mandibular Asymmetry in Adult Patients with Unilateral Degenerative Joint Disease. Angle Orthod 2005;75:305–310.
Bibilography
65 49.Hyung-Joo Choia; Tae-Woo Kimb; Sug-Joon Ahn; Shin-Jae Lee; Richard E. Donatellid. The relationship between temporomandibular joint disk displacement and mandibular asymmetry in skeletal Class III patients. (Angle Orthod. 2011;81:624– 631.)
50.Michael L. Riolo, Douglas Brand& and Thomas, TenHave, M.P.H. Associations between occlusal characteristics and signs and symptoms of TMJ dysfunction in children and young adults. (Am J Orthod Dentofac Orthop 1987;92:487-77.)
51.Paula Furlan Bavia and Renata Cunha Matheus Rodrigues Garcia. Vertical Craniofacial Morphology and its Relation to Temporomandibular Disorders. J Oral Maxillofac Res. 2016 Apr-Jun; 7(2):6
52.Tanaka T, Morimoto Y, Tanaka Y et al. Radiographic examination of the mandibular (glenoid) fossa in ancient and modern man. Oral Disease 2004; 10: 369– 377.
53.Takahashi (1991).Morphological study on the temporomandibular joint disorder of the modern Japanese.JAnthropSocNippon 1991;(99)77–92.
54.Tallents RH, Guay JA, Katzberg RW, Murphy W, Proskin H. Angular and linear comparisons with unilateral mandibular asymmetry. J Craniomandib Disord. 1991; 5: 135–141.