“COMPARISON OF VARIOUS IMAGING MODALITIES FOR
TARGET VOLUME DELINEATION, TREATMENT
RESPONSE ASSESSMENT USING PERCIST CRITERIA AND
PROGNOSTICATION ALGORITHM FOR PREDICTING
REPONSE TO TREATMENT IN HEAD AND NECK
CANCERS”
DEPARTMENT OF RADIATION ONCOLOGY CHRISTIAN MEDICAL COLLEGE
VELLORE, TAMIL NADU
DISSERTATION SUBMITTED IN PARTIAL FULFILLMENT OF MD – RADIATION ONCOLOGY (BRANCH IX)
EXAMINATION MAY 2019
CERTIFICATE
This is to certify that the dissertation entitled “COMPARISON OF VARIOUS IMAGING
MODALITIES FOR TARGET VOLUME DELINEATION, TREATMENT RESPONSE
ASSESSMENT USING PERCIST CRITERIA AND PROGNOSTICATION ALGORITHM
FOR PREDICTING RESPONSE TO TREATMENT IN HEAD AND NECK CANCER” is a
bonafide work done by Dr. GOUTHAM SUNNY, Post Graduate Student in the Department
of Radiation Oncology, Christian Medical College, Vellore during the period from April
2016 to April 2019 and is being submitted to The Tamil Nadu Dr. M. G. R Medical
University in partial fulfilment of the MD Branch IX Radiation Oncology examination
conducted in May 2019.
Guide
Dr. Subhashini John
Professor
Department of Radiotherapy
CERTIFICATE
This is to certify that the dissertation entitled “COMPARISON OF VARIOUS IMAGING
MODALITIES FOR TARGET VOLUME DELINEATION, TREATMENT RESPONSE
ASSESSMENT USING PERCIST CRITERIA AND PROGNOSTICATION ALGORITHM
FOR PREDICTING RESPONSE TO TREATMENT IN HEAD AND NECK CANCER” is a
bonafide work done by Dr. GOUTHAM SUNNY, Post Graduate Student in the Department
of Radiation Oncology, Christian Medical College, Vellore during the period from April
2016 to April 2019 and is being submitted to The Tamil Nadu Dr. M. G. R Medical
University in partial fulfilment of the MD Branch IX Radiation Oncology examination
conducted in May 2019.
Dr. Simon P Pavamani
Principal Prof and Head of Department
Christian Medical College Department of Radiation Oncology
Vellore, India- 632004 Christian Medical College
CERTIFICATE
I, Goutham Sunny, PG Registrar, Department of Radiation Oncology, Christian
Medical College Vellore hereby declare that the dissertation titled “COMPARISON
OF VARIOUS IMAGING MODALITIES FOR TARGET VOLUME
DELINEATION, TREATMENT RESPONSE ASSESSMENT USING PERCIST
CRITERIA AND PROGNOSTICATION ALGORITHM FOR PREDICTING
RESPONSE TO TREATMENT IN HEAD AND NECK CANCER” is a bonafide
work done by me for partial fulfilment towards MD Radiation Oncology (Branch IX)
Degree examination of the Tamil Nadu Dr M G R Medical University to be held in
May 2019
Dr. Goutham Sunny
PG Registrar
Department of Radiation Oncology
OFFICE OF RESEARCH
INSTTTUTIONAL REVIEW BOARD (IRB) CHRISTIAN MEDICAL COLLEGE, VELLORE. INDIA Dr. B.J. Prashantham, M.A., M.A, Dr Min (Clinicali
Director, Christian Counseling Center, Chairperson, Ethics Comm ittee.
Dr. Anna Benjamin Pulimood, M B.B.s., MD., ph.D. Chairperson, Research Committee & hincipal Dr. Biju George, M.B B.S , MD, DM.,
Deputy Chairperson,
Secretary, Ethics Committee, IRB Additional Vice-Principal (Research) December 13,2016
Dr. Goutham Sunny, PG Registrar,
Department o1' Rad iation Therapy, Christian Medical College,
Vellore 632 004.
Sub: Fluid Research Grant NEW PROPOSAL:
Comparison of various imaging modalities for target volume delineation, treatment
response assessment using PERCIST criteria and prognostication algorithm for predicting response to treatment in Head and Neck cancers.
Dr. Goutham Sunny, Employment number _ 29533, PG Registrar, Dr. Subhashini John, Employment Number: 01426, Professor, Dr. Rajesh I, Employment Numbe 120297, Associate professor, Dr. Rajesh, B, Emp. No: 20305, Associate professor, Dr. paul Ravindran, Emp. No: 10031, professor, Mr. Henry Finlay Godson, Emp. No: 31512, Department of Radiology, Dr. David Mathew, Emp. No: 2g304,Asst. prof, Dr, Devakumar, Emp.No: 30045, Associate Prof, Dr. Aparna | , Emp. No: 28382, professor, Department o Nuclear Medicine, Dr. Rajiv Michael, Emp. No: 20085, Professor, Dr. Rajan Sundaresan, Emp.No: 20356, Asso. prof, Dr. Rita Ruby, Emp. No: l0gl7,
Professor, Dr. Suma Susan, Emp. No: 14423, Professor, Department of ENT.Tunny Sebastian, Lecturer, Biostati stics.
Ref: IRB Min No: 10258 IOBSERVE] dated 05.09.2016 De:ar Dr. Goutham Sunny,
I enclose the following
documents:-l. Institutional Review Board approval 2. Agreement
Could you please sign the agreement and send it to Dr. Biju Ceorge, Addl. Vice principal (Research), so that the grant money can be released.
Wiith best wishes,
Acknowledgement
I would like to sincerely thank my guide, Dr. Subhashini John for her invaluable
guidance, constant encouragement, valuable ideas and innumerable hours spent on the
dissertation without whose help, this dissertation would not be possible. I would like
to thank my co guide Dr Devakumar Devadas for his encouragement, creative and
comprehensive advises and logistical support. I would like to thank my co guide Dr.
Rajesh Isiah for his constant support, mentorship, invaluable encouragement and
timely inputs and insights for making this dissertation possible. I would also like to
thank my co guide and head of department Dr. Simon P Pavamani for his continuous
support, guidance and encouragement during every step of my dissertation.
I would like thank my co guides, Dr. Manu Mathew, Dr. Rajesh B, Dr David Mathew,
Dr. Paul Ravindran, Dr. Henry Finlay Godson, Dr. Aparna I, Dr Rajiv Micheal, Dr.
Rajan Sundaresan, Dr Rita Ruby and Dr. Suma Susan. Without their help, the
completion of this work would have been immeasurably more difficult.
I would like to thank my patients who consented and were part of this study for
contributing their extra bit towards science in the midst of their hardships and enabled
research to happen.
I would like to thank all the support staff in the Nuclear Medicine Department who
helped me with my data collection and all technical assistance.
I express my gratitude to all my colleagues especially my co registrars and senior
residents who went out of their way to help me with the dissertation.
I would also like to thank the Department of Biostatistics for their help in the
statistical evaluation. I would also like to thank all members of the department and
Table of Contents
ABSTRACT 21
AIM 23
OBJECTIVES 24
INTRODUCTION 25
ANATOMY 27
ORAL CAVITY 28
OROPHARYNX 29
HYPOPHARYNX 30
LARYNX 30
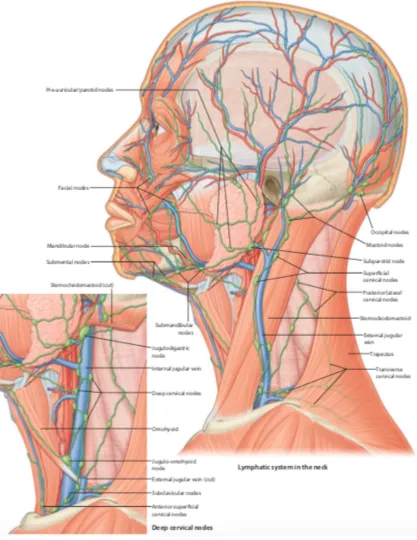
LYMPHATICS OF THE HEAD AND NECK 32
EPIDEMIOLOGY 39
ETIOLOGY 42
HISTOLOGY - HEAD AND NECK SQUAMOUS CELL CARCINOMA 46 IMAGING IN HEAD AND NECK SQUAMOUS CELL CARCINOMA 50
ULTRASOUND 51
COMPUTED TOMOGRAPHY 52
MAGNETIC RESONANCE IMAGING 53
POSITRON EMISSION TOMOGRAPHY – COMPUTED TOMOGRAPHY WITH FLUORINE 18 DEOXY D GLUCOSE 53
DIAGNOSIS OF AN UNKNOWN PRIMARY TUMOR 59
STAGING 59
RADIOTHERAPY PLANNING AND TUMOR VOLUME DELINEATION 62
PET SIGNAL CHANGES DURING THERAPY 64
DOSE ESCALATION 65
RESPONSE ASSESSMENT 66
PETCTBIOMARKERS 67
PERCIST CRITERIA 75
RECIST CRITERIA 86
METHODS AND MATERIALS 90
PREPARATION OF PARTICIPANTS FOR PET IMAGING: 91
IMAGE ACQUISITION: 92
TUMOR DELINEATION: 92
PERCIST RESPONSE CLASSIFICATION: 94
RESULTS 96
BASELINE CHARACTERISTICS 96
COMPARISON OF VOLUMES 101
RESPONSE ASSESSMENT 101
DISCUSSION 113
ROLE IN IDENTIFICATION OF CLINICALLY AND CT WISE UNKNOWN PRIMARY AND NEGATIVE NECK NODES. 113
ROLE IN VOLUME DELINEATION 114
CONCLUSION 121
LIMITATIONS 122
REFERENCES 123
LIST OF FIGURES
Figure 1. Sagittal section - Anatomy of head and neck ... 27
Figure 2 Coronal section - Anatomy of pharynx ... 28
Figure 4 A. Drawing shows anatomy pertinent to nodal classification. B, Drawing shows specific margins of anatomy seen in A that relate to definitions of classification levels. ... 33
Figure 5 GLOBOCAN worldwide incidence of malignancies - site wise ... 39
Figure 6 GLOBOCAN worldwide mortality of malignancies - site wise ... 40
Figure 7 Leukoplakia ... 43
Figure 9 Erythroplakia ... 44
Figure 11 Oral Lichen Planus ... 45
Figure 13 HPV associated squamous cell carcinoma ... 47
Figure 14 Verrucous squamous cell carcinoma ... 47
Figure 15 Papillary squamous cell carcinoma ... 48
Figure 16 Basaloid squamous cell carcinoma ... 48
Figure 17 Sarcomatous squamous cell carcinoma ... 49
Figure 18 Spaces in head and neck – cross sectional CT image ... 51
Figure 20 CT, MRI and PET CT for imaging a carcinoma of oral cavity obscured by dental
artifact ... 52
Figure 21 Combined imaging in evaluation of a patient with right tonsil adenoid cystic carcinoma ... 54
Figure 22 Preoperative detection of occult lymph node by PET CT ... 61
Figure 23 Discordant CT and PET-CT GTV ... 63
Figure 24 James’s equation for calculation of lean body mass ... 76
Figure 25 Initial segmentation to identify are with maximum SUV uptake ... 93
Figure 26 Delineated tumor using adaptive threshold technique ... 94
Figure 27 Distribution of age ... 96
Figure 28 Distribution of primary site ... 97
Figure 29 Distribution of T stage ... 97
Figure 30 Distribution of stage group ... 98
Figure 31 Distribution of concurrent systemic treatment ... 98
Figure 32 Variation in SUV at baseline ... 99
Figure 33 CT and PET CT volume comparison ... 101 Figure 34 Percentage decrease in SUV value in patients with partial metabolic response . 109
LIST OF TABLES
Table 1 Hopkins criteria for PET CT response assessment ... 67
Table 2 Scenarios for Target and Non-target lesions showing different responses at follow up and overall response synthesis ... 82
Table 3 Comparison between RECIST 1.1, EORTC and PERCIST ... 89
Table 4 Patient characteristics and treatment details ... 100
Table 5 Response according to NPL scopy and clinical assessment ... 102
Table 6 Response according to RECIST ... 102
Table 7 Response according to PERCIST SUL ... 103
Table 8 Response according to PERCIST TLG ... 103
Table 9 Response according to PERCIST SUVMAX ... 103
LIST OF ABBREVIATIONS USED
HPV Human papilloma virus
IJV Internal jugular vein
CUP Carcinoma unknown primary
WHO World health organisation
ICMR Indian council of medical research
NRCP National cancer registry program
UV Ultraviolet
SCC Squamous cell carcinoma
GTV Gross tumor volume
CTV Clinical target volume
PTV Planning target volume
OAR Organ at risk
USG Ultrasonography
CT computed tomography
MRI Magnetic resonance imaging
IV Intravenous
NPL Nasopharyngolaryngeal
RECIST Response evaluation criteria in solid tumors
PERCIST Positron emission tomography response criteria in solid tumors
SUV Standardized uptake value
SUL SUV normalized to lean body mass
MTV Metabolic tumor volume
TLG Total lesion glycolysis
CMR Complete metabolic response
PMR Partial metabolic response
SMD Stable metabolic disease
PMD Progressive metabolic disease
CR Complete response
PR Partial response
SD Stable disease
PD Progressive disease
RTOG radiation therapy oncology group
EORTC European organization for research and treatment of Cancer
IMRT Intensity modulated radiation therapy
SEER Surveillance, Epidemiology and End result program
VMAT Volumetric arc therapy
NTCP Normal tissue complication probability
TCP Tumor control probability
MU Monitor units
EGFR Epidermal growth factor receptor
SBR Source or signal to background ratio
LFFS Local failure free survival
DMFS Distant metastasis free survival
PFS Progression free survival
DFS Disease free survival
LC Local control
OS Overall survival
BED Biological equivalent dose
VOI Volume of interest
ABSTRACT
OBJECTIVE
To compare tumour volumes created using F 18 FDG PET CT scan before
starting treatment and after completion of chemo radiation/radical radiotherapy
to assess treatment response using PERCIST criteria in Head and Neck cancers
and to create a prognostication algorithm to predict treatment response.
METHODS
This was a prospective cross-sectional study done in the Department of
Radiation Oncology at Christian Medical College, Vellore. Patients with
squamous cell carcinoma of the oral cavity, oropharynx, hypopharynx and
laryngopharynx planned for radical irradiation with or without concurrent
systemic treatment were recruited and underwent a PET CT scan in planning
position. These patients underwent a response assessment PET CT 12 weeks
following treatment. Baseline diagnostic and staging advantage of PET CT, its
role in RT planning, PET CT biomarkers were analysed. Response assessment
was done by clinical examination and NPL scopy, RECIST and PERCIST and
response assessment was analysed.
RESULTS
PET CT was beneficial in diagnosis, staging and detection of metastatic
disease. It was useful in delineation of tumor volume and reduction in volumes.
SUL had good correlation with response. The patients who had complete
metabolic response had a high negative predictive value suggestive of absence
of disease. PET CT helped to differentiate abnormal scopy findings from
diseased scopy by assessing decline in SUL value. PERCIST PMR patients
with a normal scopy and complete response in RECIST had a significant drop
in SUL, TLG and SUVmax compared to stable and progressive metabolic
response. Change in TLG was a good marker to prognosticate response to
treatment. Change in MTV was a prior biomarker to assess response.
CONCLUSION
PET CT was of use in diagnosis, staging, RT planning and response
assessment. Baseline TLG was the best biomarker to prognosticate response to
AIM
Comparison of tumour volumes created using F 18 FDG PET CT scan before starting
treatment and after completion of chemo radiation/radical radiotherapy to assess
treatment response using PERCIST criteria in Head and Neck cancers and to create a
OBJECTIVES
Primary Objective
• To compare tumour volumes using PET CT before starting and after
completion of treatment to assess treatment response using PERCIST
criteria.
Secondary Objective
• Evaluate the changes in target volume and staging due to addition of
PET to CT and MRI
• To compare metabolic volumes created using PET with anatomic
volume created using CT and MRI
• To create a prognostication algorithm for response prediction using
PERCIST
• To look at whether there is any association between the aggressiveness
INTRODUCTION
Intensity Modulated Radiation Therapy (IMRT), is presently considered the standard
of care in managing head and neck malignancies. With the use of IMRT the dose to
the primary tumor can be escalated while keeping the dose to the adjacent normal
structures at the minimum. Precise delineation of target volume and organs at risk is
required for planning purpose. Conventionally Radiation Oncologist utilize CT and
MRI to delineate the gross tumour volumes. Anato-metabolic imaging using
18F-fluoro-deoxyglucose positron emission tomography/computed tomography
(FDG-PET/CT) is used in the diagnosis, initial staging, and response assessment in various
malignant tumors with high diagnostic accuracy. The advantages of PET/CT in
radiotherapy planning is that it improves tumor delineation, reducing intra-observer
and inter-observer variability and making treatment volumes more standard across
individuals and institutions.
This research work will be carried out on head and neck cancer patients (oral cavity,
oropharynx, hypopharynx and larynx) undergoing radiation therapy by intensity
modulated radiation therapy with planning PET CT. In this study, the eligible patients
planned for treatment with IMRT will be prospectively recruited from December 2016
to Aug 2018 and will undergo a planning PET CT. The PET CT will be taken in the
treatment position with head and neck ray cast. In the PET CT image, metabolic
with radiologist and nuclear medicine consultant according to current guidelines.
Comparison of the volumes will be done and patients will be treated according to
tumour volume based GTV. PET CT data will also be used to assess if there is any
change in staging when compared to CT scan based staging.
The patient will be followed up 3months after treatment completion with PET CT and
comparison of pre and post treatment tumour volumes will be done and treatment
response will be assessed using PERCIST criteria and also will create a
prognostication algorithm to predict treatment response.
Study will also assess the impact of PET scan on staging – change in nodal staging,
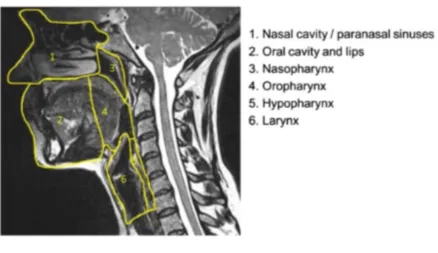
ANATOMY
Head and neck squamous cell carcinomas originate from the mucosa of the following
anatomic locations, namely the nasopharynx, the oral cavity, the oropharynx, the
hypopharynx and the larynx. The need to identify these critical areas and its
boundaries is to identify the site of origin so as tailor treatment as it varies for various
subsites and has significant role in the choice of management modality, treatment
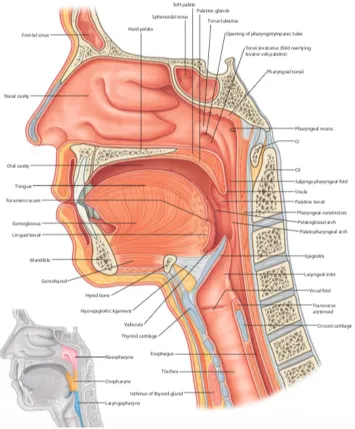
[image:27.595.80.435.290.719.2]Figure 2 Coronal section - Anatomy of pharynx
Oral Cavity
The intersection between the vermillion (red lip) and skin forms the anterior border of
the oral cavity, laterally, buccal mucosa or the cheek forms its walls, the posterior
limit is the junction between soft and hard palate superiorly and inferiorly it is the
circumvallate papillae of the tongue which forms a V-shaped line. The various
2. Buccal Mucosa
3. Lower alveolar ridge
4. Upper alveolar ridge
5. Retromolar trigone
6. Floor of mouth
7. Hard palate
8. Oral Tongue
It is critical to understand these subsites and the boundaries, especially the posterior
boundary to differentiate between an oral cavity and oropharyngeal primary.
Oropharynx
The intersection between the hard and soft palate forms the anterior boundary of
oropharynx superiorly and inferiorly it is formed by the circumvallate papillae of the
tongue, an imaginary horizontal plane through the soft palate separates it from the
nasopharynx superiorly and inferiorly, a similar horizontal plane through the hyoid
separates it from the hypopharynx. The various oropharyngeal subsites are
1. Palatine Tonsils
2. Base of Tongue
3. Oral surface of soft palate and Uvula
4. Posterior pharyngeal wall
5. Lateral pharyngeal wall
7. Glossotonsillar Sulcus
Human Papilloma Virus associated squamous cell carcinoma of the oropharynx most
commonly originates from the lymphoid tissue of lingual and palatine tonsils.(2)
Hypopharynx
An imaginary horizontal plane through the hyoid bone separates hypopharynx from
the oropharynx superiorly and another imaginary horizontal plane through the cricoid
cartilage sets the lower limit of hypopharynx. The various anatomical subsites are
1. Pyriform Sinus
2. Lateral pharyngeal wall
3. Posterior pharyngeal wall
4. Post-cricoid region
Larynx
Larynx or the voice box is a complex structure that can be further sub classified into
three separate regions; the supraglottic larynx, glottic larynx and subglottic larynx.
The superior extent of supraglottic larynx is lingual surface of epiglottis and the
inferior extent is the laryngeal ventricle just above true vocal folds. The junction
between the base of tongue and lingual surface of epiglottis is the vallecula.
2. Infrahyoid epiglottis
3. Laryngeal surface of aryepiglottic folds
4. Arytenoids
5. False vocal folds and ventricles
The subsites of glottic larynx are
1. Anterior commissure
2. Posterior commissure
3. True vocal folds
The subglottic larynx is a space below the true vocal folds with an imaginary
horizontal plane through the inferior border of cricoid cartilage as lower limit. (2)
The four layers of the pharynx from within outwards are
Mucous membrane that continues with the eustachian tubes and the nasal, oral
and laryngeal cavities
Fibrous coat that is the thickest in the superior part and forms a median raphe
in the posterior aspect
Muscular coat formed by 2 layers of muscular tissue – external constrictors and
internal levators
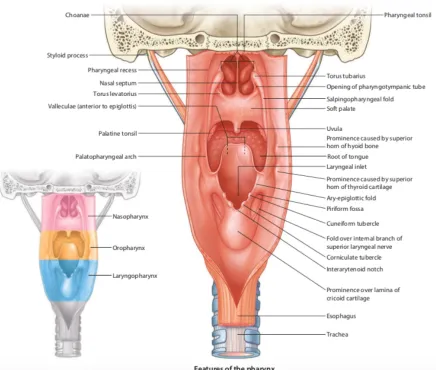
Figure 4 A. Drawing shows anatomy pertinent to nodal classification. B, Drawing shows specific margins of anatomy seen in A that relate to definitions of classification levels (3).
(3)
Level Ia
The location of level Ia nodes is the median region between the anterior bellies of the
digastric muscles
It drains the skin of the chin, mid and lower lip, tip of tongue and the anterior part of
floor of mouth.
Level Ib
The location of Level Ib nodes is the space between inner aspect of mandible laterally
and digastric muscles medially. It extends anteriorly up to symphysis menti and
posteriorly up to submandibular glands.
It drains the Level Ia, lower part of nasal cavity, soft and hard palate, mandibular and
maxillary ridges, cheek, the upper and lower lips and the anterior tongue.
Highest risk of nodal metastasis to Level Ib is from malignancy of oral cavity, anterior
nasal cavity, soft tissue structures of the middle of the face and submandibular gland.
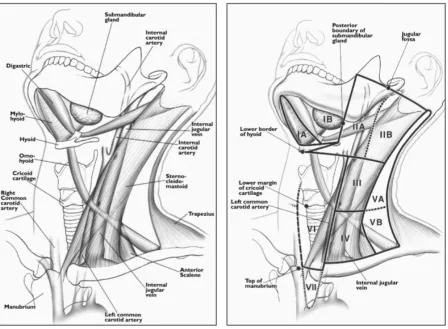
Level II
Level II is also known as the upper jugular nodes and its location is around the upper
one third of internal jugular vein and upper spinal accessory nerve. It lies between
medial surface of sternocleidomastoid muscle laterally and the internal carotid and
scalenius muscle medially from the lateral process of first cervical vertebrae to the
caudal edge of hyoid bone. It is further subdivided into Level IIa and IIb by the
posterior edge of internal jugular vein.
It drains face, parotid gland and the submandibular, submental and retropharyngeal
lymph nodes. It also drains the nasal cavity, pharynx, larynx, external auditory canal,
middle ear, sublingual and submandibular salivary glands.
Highest risk of nodal metastasis to level II is from malignancy of nasal cavity, oral
Level III
Level III is also known as the middle jugular nodes and is located around the middle
third of the IJV. It is the inferior extension of Level II. Its superior margin is caudal
edge of the body of hyoid bone and extends inferiorly till the caudal edge of cricoid
cartilage. Anteriorly it extends till anterior edge of sternocleidomastoid or posterior
one third of thyrohyoid muscle and posteriorly the posterior edge of
sternocleidomastoid. Laterally it is limited by deep surface of sternocleidomastoid and
medially the medial edge of common carotid artery and scalenius muscle.
It drains the base of tongue, tonsils, larynx, hypopharynx and thyroid gland. It also
receives lymphatics from the level II, V, retropharyngeal, pretracheal and recurrent
laryngeal nodes.
Highest risk of nodal metastasis to Level III is from the oral cavity, nasopharynx,
oropharynx, hypopharynx and larynx.
Level IV
Level IVa is also known as the lower jugular nodes and is located around the lower
third of the IJV. It is the inferior extension of Level III nodes and extends to a limit set
arbitrarily as 2 cm above the sternoclavicular joint. Its anterior extent is the anterior
edge of the sternocleidomastoid muscle superiorly and body of sternocleidomastoid
muscle inferiorly. Its posterior extent is posterior edge of sternocleidomastoid muscle
superiorly and scalenius muscle inferiorly. Laterally it is limited by medial border of
margin is medial border of common carotid artery, medial margin of thyroid gland
and scalenius muscle and medial border of sternocleidomastoid in the inferior aspect.
It drains the larynx, hypopharynx and thyroid gland and also received efferent from
level III and V, recurrent laryngeal, pretracheal and retropharyngeal nodes.
Level IVb is also known as the medial supraclavicular nodes. It located in
continuation of Level Iva and extends down to the superior edge of manubrium
sternum. Its anterior extent is the deep surface of sternocleidomastoid muscle.
Superiorly the posterior extent is anterior border of scaleneus muscle and inferiorly it
is formed by apex of lung, brachiocephalic vein and artery, common carotid artery,
subclavian artery. The medial extent is level VI and medial edge of common carotid
while lateral limit is lateral edge of scaleneus muscle.
It drains the esophagus, larynx, hypopharynx, trachea and thyroid gland and receives
efferent lymphatics from Level Iva, Vc, recurrent laryngeal nodes and pretracheal
nodes.
Level V
Level V nodes are also known as posterior triangle nodes and it is located posterior to
the sternocleidomastoid muscle. It is located around the inferior part of spinal
accessory nerve and the transverse cervical vessels. The superior extent is an
imaginary horizontal plane drawn at the level of cranial edge of hyoid bone and
inferiorly an imaginary plane crossing transverse cervical vessels. The lateral extent is
set at anterior border of the trapezius muscles. It is further subdivided into level Va
and Vb by the caudal edge of cricoid cartilage.
It drains the parietal and occipital scalp, skin of lateral and posterior neck and
shoulder, oropharynx, nasopharynx, thyroid gland and efferent lymphatics from
retroauricular and occipital nodes.
Highest risk of nodal metastasis to level V is from malignancies of the nasopharynx,
oropharynx and thyroid gland.
Level Vc is the lateral supraclavicular nodes which are located in continuation with
the posterior triangle nodes (Level Va and Vb) from the transverse cervical vessels
down to an arbitrarily set limit of 2 cms superior to manubrium sternum.
Level VI nodes are also known as the anterior compartment nodes. Superficially it is
called as the anterior jugular nodes (Level VIa) and in the deep previsceral space,
pre-tracheal, pre-laryngeal and para-tracheal (recurrent laryngeal nerve) nodes (Level
VIb).
Level VIIa
Leve VIIa nodes are also called as the retropharyngeal nodes. It extends superiorly
from the upper edge of first cervical vertebrae to cranial edge of body of hyoid
inferiorly. Its anterior margin is formed by the pharyngeal constrictor muscles and
posteriorly by the longus capitus and longus colli muscles. It is bounded on the lateral
margin by the medial edge of internal carotid artery.
The other nodal groups which have been described are the Level VIIb which is known
as retro-styloid nodes, level VIII which are known as the parotid nodes, Level IX
which are known as the bucco-facial and Malar nodes, Level Xa which are known as
the retroauricular nodes and the Level Xb which are known as the occipital group of
EPIDEMIOLOGY
Head and Neck cancers are the sixth most prevalent cancer world over. Statistics
estimate about 6.3 lakh patients are newly diagnosed yearly which leads to 3.5 lakh
deaths annually. (5) More than 90% of all head and neck cancers diagnosed comprise
of squamous cell carcinoma. The worldwide distribution of squamous cell carcinoma
of the head and neck shows great variation and various demographic variation in
tobacco and alcohol consumption could be attributed as the main cause for this.
The WHO GLOBOCAN Report 2012 also showed a very high 5-year prevalence rates
for head and neck cancers in India. The 5-year prevalence rate of lip and oral cavity
was 12.6%, while for Laryngeal cancers it was 6.8%, nasopharynx 1.1% and
oropharynx 7%. This clearly points out the high burden of head and neck cancers in
[image:39.595.79.507.507.695.2]India with 5-year prevalence rates of nearly 27% (6)
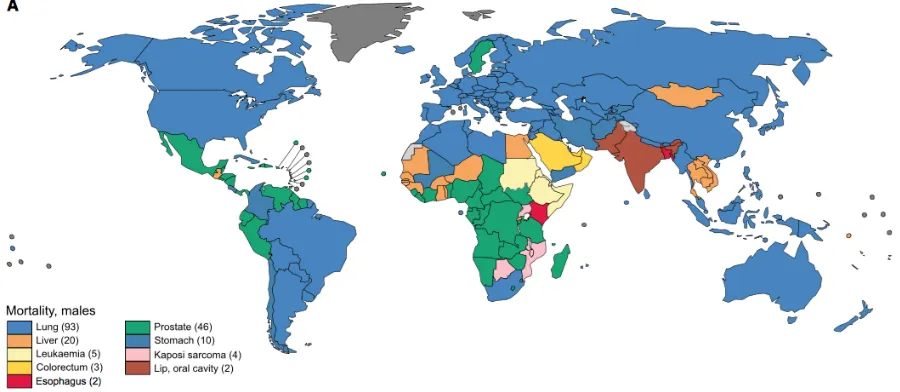
Figure 6 GLOBOCAN worldwide mortality of malignancies - site wise
GLOBOCAN data on incidence and mortality 2018 (7)
The decreasing incidence of oropharyngeal squamous cell carcinoma and laryngeal
squamous cell carcinoma in the US and other developed nations has been attributed to
the decreased use of tobacco products and smoking. Meanwhile there is an increasing
trend of oropharyngeal squamous cell carcinomas in these regions which are
associated with high risk subtypes of human papilloma virus. (8)
Four decades ago the incidence of HPV associated carcinomas of the oropharynx was
about 16% but currently it stands at about 75%. The HPV associated head and neck
squamous cell carcinoma has been attributed to more than 25% increase in the
incidence of head and neck squamous cell carcinoma in the united states in the last 10
years. (9) HPV associated oropharyngeal squamous cell carcinoma has been
recognized as a unique subset due to its unique etiology, molecular pathogenesis,
The Indian Council of Medical Research (ICMR) started the National Cancer Registry
Program (NCRP) in 1981. (12) There are 28 cancer registries located throughout India
and these are hospital based and population based registries. Head and neck squamous
cell carcinomas accounted for about 30% of all cancers in males. The most common
cancer was the oral cavity and tongue followed by pharyngeal cancers. The reason for
the high incidence of oral cavity cancers is estimated to be due to tobacco use which is
ETIOLOGY
The factors that contribute to development of squamous cell carcinoma of head and
neck includes diet, habits, geographical location and genetic background. The most
important of the above-mentioned side effects are tobacco use and alcohol
consumption and these both have shown to have a synergistic effect. (14) Human
Papilloma Virus infection with high risk sub-types (16,18,31 and 33) play a major
causal role in the development of oropharyngeal squamous cell carcinoma with very
typical clinical and molecular features. This subset of oropharyngeal squamous cell
carcinoma associated with HPV has been linked to an improved outcome and survival.
(15) But when it has developed in a person with concurrent tobacco habit the survival
benefit doesn’t seem to be significant. Other contributing factors for head and neck
squamous cell carcinoma are chronic exposure to sun light or UV radiation for SCC of
lips, iatrogenic immunosuppression following solid organ transplant, family history of
head and neck squamous cell carcinoma, diseases like Plummer-Vinson syndrome,
Fanconi anemia and dyskeratosis congenita, diets deficient in anti-oxidants and older
age.(10)(16)
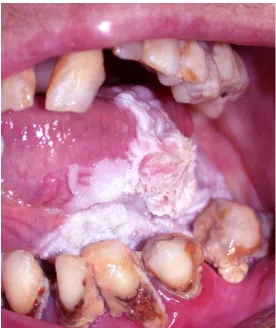
The Precursor lesions and conditions of Head and neck squamous cell carcinoma are
Leukoplakia – white patch or plaque that cannot be rubbed off and cannot be
Figure 7 Leukoplakia
Progressive verrucous leukoplakia – multifocal, proliferative and progressive
form of leukoplakia which usually begins as simple keratosis and becomes
verrucous and multifocal involving large contiguous sites.
Figure 8 Progressive verrucous leukoplakia
Erythroplakia – well defined, raised, velvety plaque that cannot be clinically
[image:43.595.246.384.358.522.2]Figure 9 Erythroplakia
Oral submucous fibrosis – chronic and progressive condition characterized by
diffuse mucosal rigidity. It occurs due to dense fibrosis within the lamina
propria that may extend to underlying skeletal muscle.
Figure 10 Oral submucous fibrosis
Oral lichen planus – most common autoimmune chronic auto inflammatory
disorder of the mucosa of oral cavity that can affect about 1-2% of all adults in
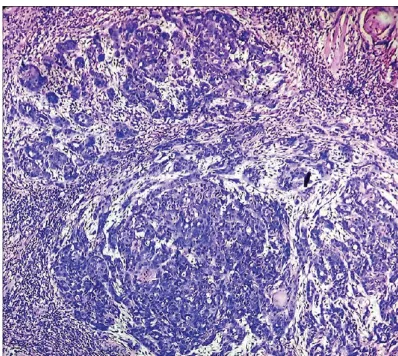
HISTOLOGY
- HEAD AND NECK SQUAMOUS CELL CARCINOMA1. Conventional/ keratinizing – Majority of all squamous cell carcinomas in
the head and neck found outside the oro and nasopharynx belong to this
subtype. The grading of conventional SCC is based on cytological
maturation, extent of keratinization and the growth pattern into well,
moderately and poorly differentiated squamous cell carcinoma. The use of
tobacco and or alcohol most commonly leads to this particular subtype of
SCC. (17)
Figure 12 Keratinizing squamous cell carcinoma
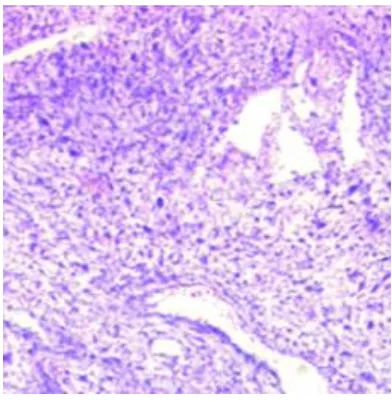
2. HPV associated SCC – They are more monotonous in appearance with
limited keratinization compared to the conventional subtype. The most
distinct morphological feature of this type of SCC also applies to lymph
nodal metastasis if any. They are most often cystic by imaging and on
Figure 13 HPV associated squamous cell carcinoma
3. Veruccous SCC – Locally aggressive subtype that shows a broad pushing
growth downwards and has an exophytic warty appearance. Histologically
the cells are bland with minimal alteration. Since they do not usually
metastasize, it has to be differentiated from the more aggressive hybrid or
conventional SCC. Complete evaluation of these lesions requires full
excision with adjacent normal mucosa.
Figure 14 Verrucous squamous cell carcinoma
4. Papillary SCC – Rare subtype seen more commonly in the nasal cavity and
larynx. Histologically they have long papillary fronds lined by neoplastic
requires clinical correlation as determination of invasion is difficult on
[image:48.595.215.414.494.672.2]biopsies due to little underlying stroma.
Figure 15 Papillary squamous cell carcinoma
5. Basaloid SCC – High grade histological variant that overlaps between solid
adenoid cystic carcinoma and neuroendocrine carcinomas morphologically.
It often requites immunohistochemical confirmation. This variant arising in
the oropharynx is commonly associated with HPV but not at other sites.
(18)
Figure 16 Basaloid squamous cell carcinoma
which exhibit frequent mitosis and may grow as an exophytic or polypoid
[image:49.595.217.413.137.338.2]mass. (19)
IMAGING IN HEAD AND NECK SQUAMOUS CELL CARCINOMA
To visualize tumors located in the mucosa of upper aero digestive tract both clinical
examination and endoscopy are usually adequate. But all areas are not well visualized
by these methods and in addition imaging is necessary to visualize submucosal and
deeper tumors and to evaluate the loco-regional extent of tumors. The role of imaging
is as follows
Detection or exclusion of tumors
If present to identify its extent and delineate its size
Identify adjoining structures affected
Identify spread to lymph nodes
Identify perineural or perivascular spread
Identify bony invasion
Detect distant metastasis
Stage the tumor with all the available information
It can also be used for identifying tissue for targeted biopsy, for planning radiation
therapy, for adaption during radiation therapy, to evaluate response to treatment after
completion of treatment, to identify recurrence while on follow up to offer salvage to
improve clinical outcome. It should also be able to identify synchronous primaries or
second primary malignancy that is common in head and neck region due to field
The imaging modalities available include ultrasound, computed tomography (CT),
magnetic resonance imaging (MRI) and positron emission tomography with CT (PET
[image:51.595.79.517.356.609.2]– CT).(20)
Figure 18 Spaces in head and neck – cross sectional CT image
Figure 19 Radiological anatomy of head and neck – CT image
Ultrasound
It is widely available, portable and relatively cheap. Though it has limited application
Its major disadvantage is the operator dependency and its limited application due to
limited transmission through bone and air.
Computed Tomography
It is widely available, used extensively and has become the main stay for imaging and
staging of primary disease. It is quick and easy to perform, produces reproducible
results and provides a wide range of information. It is excellent for bony detail like
mandibular erosion or skull base involvement. It allows high resolution multiplanar
reconstructions which provides more information than conventional imaging
modalities.
Its disadvantage is the use of radiation and its exposure, poorer soft tissue contrast and
information compared to MRI, need for IV contrast for improved resolution and side
effects associated with contrast, artefacts in the presence of metal objects like dental
amalgam if present.
Magnetic resonance imaging
It uses the principle of proton density identified by magnet to reflect biochemical
tissue characteristics and identification of tissue structures. The advantage of MRI
scan is the soft tissue contrast, evaluation of blood vessels without using contrast,
multiplanar scanning and no radiation exposure. It can also be used to perform
functional imaging like diffusion weighted imaging, perfusion and dynamic
enhancement studies with the development of various magnetic gradients.
The disadvantage of MRI is the higher cost, limited availability, longer acquisition
times and lack of compatibility with metal implants. In head and neck imaging,
movement and swallowing artefacts and air pockets can cause distortions and degrade
image quality. It requires complex algorithms for reconstruction, production of
multiple sequences and requires expertise for interpretation.
Positron emission tomography – computed tomography with fluorine 18 deoxy D glucose
PET CT makes use of the metabolic nature of tumor to identify the tumor and its
extension. The radiolabeled tracer is preferentially transported to the tumor by normal
circulation which is detected by a gamma camera array. It is coupled with a CT for
better resolution and anatomic visualization. The advantage of PET CT is the
evaluation of whole body to identify the tumor in addition to lymph nodal and
metastatic disease and exclusion of same.
The main drawback is the non-specific nature as uptake is increased in cases of
inflammation also. It is also more expensive, time consuming, requires fasting with
physiologic uptake in the head and neck region like tonsil, tongue and vocal
cords.(21)
For accurate and precise management of head and neck malignancy, imaging is
essential. Oral, oropharyngeal, laryngeal and hypopharyngeal lesions are initially
imaged with a CT scan as it helps to acquire images fast and reduces artefacts. For
better soft tissue delineated and identification of muscle invasion, MRI is useful in
cases of tongue cancer. It is also useful to identify pre-vertebral muscle involvement
in hypopharyngeal tumors to decide on operability. In early glottic lesions to identify
minute para-glottic extension (where higher soft tissue resolution is required) MRI can
be useful. For sinonasal, nasopharyngeal and salivary gland tumors MRI is more
useful than CT to better identify tumor extent. PET CT is very useful in all these cases
to identify extent of disease and identify occult metastasis. It is also recommended in
cases of unknown primary with cervical nodal metastasis. PET CT also helps in early
[image:54.595.78.387.514.664.2]identification of post treatment residual and recurrent disease while on follow up. (22)
MANAGEMENT
Management of locally advanced squamous cell carcinoma of the head and neck
region consists of radiation therapy with concurrent chemotherapy. (23) Initial
treatment used to be radical radiotherapy without the use of chemotherapy. Southwest
Oncology group (SWOG) in co-operation with RTOG and ECOG undertook an
intergroup phase III randomized trial in the late 1990s by Al-Sarraf who compared
chemoradiotherapy and radiotherapy in advanced nasopharyngeal cancer. The trial
was able to prove without the doubt the benefit with addition of chemotherapy to
radiation therapy in the form of better 3 year PFS, median survival and overall
survival. (24) MACHNC meta-analysis in 2009 (25) and its update in 2011
demonstrated an absolute improvement of 4.5% in 5-year overall survival for patients
who received chemotherapy. Among these patients a 6.5% benefit was observed for
patients who received concurrent platinum based chemotherapy. (26) Among all
subsites, maximum benefit was observed in oropharynx and laryngeal cancers.
Radiation therapy techniques have evolved from the Telecobalt era to present state of
high precision radiotherapy. With the advent of treatment planning systems and
multi-leaf collimators in 1990s conformal radiotherapy became a viable option. This has
resulted in highly targeted and conformal dose distribution inside target volume and at
the same time sparing normal tissue in the adjacent area. This has in turn contributed
to achieving better local control with lesser treatment related morbidity. The inverse
(IMRT) has further improved dose delivery and also treatment outcome. (27) There
are various studies that have convincingly demonstrated the benefit of improved dose
volume parameters for critical structures, xerostomia scores and quality of life scores
for patients treated with IMRT in comparison with conventional (2D) or conformal
(3D) treatment. (28–30)
The use of IMRT has also allowed dose escalation to tumor volumes and also relative
acceleration of dose delivery in addition to the initial goal of sparing normal tissues.
SEER database analysis has revealed that use of IMRT has resulted in cause specific
survival compared to non IMRT techniques. (31) The studies which looked at cost
effectiveness of IMRT used a Markov model to look at the incremental cost per
quality of life year (QALY) gained by making use of IMRT. It demonstrated
substantial cost effectiveness with lesser xerostomia and similar local control. (32)
There have been various studies that looked at the advantage and disadvantage of step
and shoot IMRT in comparison with volumetric modulated arc therapy (VMAT). A
multi-institutional study compared the quality of VMAT plans with IMRT. It was
observed that the double arc plans were superior to step and shoot technique. It was
also observed that the dose to organs at risk were significantly better and the treatment
time was decreased by at least 50% with the use of VMAT. (33) Another NTCP/ TCP
spinal cord and also a significant reduction in MU. Both techniques had similar PTV
coverage with no significant differences in homogeneity and conformity index. (34)
The ideal concurrent chemotherapy regime has been debated since the time MACH
NC meta-analysis reported the benefit of chemotherapy. This difficulty in choosing
the optimal regime has been mostly due to the different ways of combining
chemotherapy and the heterogeneity of various study designs.(35) It has been
observed the ultimate limiting factor in intensifying treatment is patient related,
disease specific and related to the environment and the intensification most likely
results in high acute morbidity requiring intensive support. The three weekly
chemotherapy regimen with 100 mg/m2 cisplatin delivered concurrently with
radiation has been established in the historic trials as the standard of care. (36–38) A
more recent randomized control trial from Tata Memorial Hospital was able to
demonstrate the superiority of 3 weekly cisplatin over weekly cisplatin schedule. (39)
However the toxicity of this has resulted in more than 60% patients not receiving the
full recommended chemotherapy which eventually translates to poor outcome in view
of sub optimal treatment. (40) This is more challenging in a resource limited country
like India. An alternate regimen with weekly low dose cisplatin has been used
commonly which has resulted in lesser requirement for supportive care, increased
dose intensity, lesser toxicity and also better radio-sensitization and decreased risk of
The role of epidermal growth factor receptor (EGFR) has been extensively researched
once it’s over expression has been brought to the attention of researchers world
over.(42) It’s over expression has been consistently associated with poorer response to
radiation therapy and resistance and an overall poorer prognosis. (43) A molecule of
particular interest was a monoclonal antibody with anti EGFR effect called
Cetuximab. Its use concurrently with radiation therapy was studied in a phase III
randomized control trial for locally advanced head and neck cancer. It was observed
that its use resulted in significantly better 5 year overall survival compared to
radiotherapy alone. (44) These results lead to an early adoption of the drug in clinical
practice in spite of increased toxicity. (45) The search for a less toxic alternate drug
has resulted in the development of a humanized form of the drug called
Nimotuzumab. It binds to the extracellular domain of EGFR receptor and inhibits
receptor – ligand binding. This has been associated with far less incidence of adverse
events. A phase II study had reported that the drug was safe and well tolerated for
concurrent administration with radiation and provided long term survival benefit. (46)
Most recent data have looked into the role of immunotherapeutic agents like
ROLE OF PET CT IN HEAD AND NECK CANCERS
18 FDG PET CT is being increasing utilized in the management of head and neck
malignancies. Its applications include diagnosis by directing biopsy, staging, detecting
primary in occult nodal metastasis, defining tumor volumes, treatment response
assessment and in detecting local and distant metastasis post treatment while on
follow up. The most important and indispensable role has been in detecting an
unknown primary and early detection of recurrence or a residual disease. (47)
Diagnosis of an unknown Primary Tumor
The clinical presentation of 5-10 % patients is cervical lymphadenopathy without an
obvious primary tumor detected on clinical examination and routine imaging. Studies
by Rusthoven et al and Zhu et al have demonstrated added detection rate with 18 FDG
PET CT with high sensitivity and moderate specificity compared to conventional
imaging modalities. Benefits of detection of a possible primary tumor site include
option of targeted biopsy, surgical excision of identified primary and also reduction in
volume of radiation target volume. (48)
Staging
Initial staging of the disease is very important to plan treatment and determine
prognosis. 18 FDG PET CT can provide accurate information regarding primary tumor,
Staging of Primary Tumor (T)
For evaluation of primary tumor, 18 FDG PET CT is more effective than CT or MRI. It
can provide more information and has higher sensitivity compared to CT or MRI. The
metabolic information obtained from PET scan supplements the anatomic information
from CT scan. To identify mandibular invasion, PET CT had better sensitivity and
specificity than CT scan alone. (49) Another advantage of PET CT is in the
identification of synchronous primary malignancies which can arise due to field
cancerization seen commonly in head and neck malignancies. False negative results
can occur when small or superficial tumors are being evaluated and false positive
results occur when the location of tumor is in areas of high physiological uptake. For
example, in an oral cavity primary, if the location of the tumor is close to dental
amalgam filling the presence of artifacts can make it difficult to identify the tumor and
delineate it accurately. Limited spatial resolution of 18 FDG PET restricts the ability to
accurately delineate the tumor and its relationship with surrounding structures but, on
combining with an anatomic imaging modality like CT or MRI improves this pitfall.
Hence it is always advised to combine 18 FDG PET with contrast enhanced CT or MRI
for accurate information.
Staging of Nodal Disease (N)
Nodal metastasis can significantly affect staging, treatment plan, prognosis and
overall survival. It is the most important factor affecting prognosis in head and neck
clinically node negative neck it was found that 18 FDG PET CT was superior to CT
and MR imaging in detecting occult metastasis. Its use decreased probability of occult
nodal metastasis by up to 12% compared to clinical examination, CT or MRI alone.
(51) The significant advantage that 18 FDG PET CT has over conventional imaging
modalities is that it can detect morphologically normal but metabolically active
lymphadenopathy. These would have been identified as normal if either CT scan or
MRI was used for staging purpose. In primary lesions of oral cavity, oropharynx and
supraglottic larynx with clinically N0 neck, risk of occult nodal metastasis is about
20-30%.(52) The decision to electively radiate the neck or undergo neck dissection
depends on this and the utility of 18 FDG PET CT to identify this early improves the
[image:61.595.80.519.408.554.2]prognosis for the patient.(48)
Metastasis (M)
18 FDG PET CT is also useful in detecting distant metastasis. Though the incidence of
distant metastasis in head and neck squamous cell carcinoma is low compared to other
primaries the incidence of the same increases with locally advanced disease (T3-T4)
or (N2-N3), perineural invasion and extracapsular extension in the involved lymph
nodes and would influence the treatment modality. The national comprehensive
cancer network (NCCN) recommends that 18 FDG PET CT be done for primary
evaluation of advanced stage (III and IV) primaries of oral cavity, nasopharynx,
oropharynx, larynx, mucosal melanoma and unknown primary. It is because distant
metastasis was commonly seen when etiological causes like alcohol or tobacco use
was implicated. 18 FDG PET CT detected these distant metastases with much better
accuracy as compared to conventional imaging modalities. (50) PET CT biomarkers
identified in the pre-therapy or diagnostic scan like maximum SUV (SUVmax),
metabolic tumor volume (MTV) and total lesion glycolysis (TLG) have been reported
to be associated with worse patient outcomes.(53–55)
Radiotherapy planning and tumor volume delineation
Radiation therapy had made tremendous progress from previous conventional open
field RT to precision radiotherapy using techniques like IMRT. This progress
demands accurate tumor identification which in turn helps to identify target volumes
and organs at risk better. These advancements have led to achievement of better
therapeutic ratio by improvement in tumor coverage with the potential for dose
acquires co-registered PET and CT images allows the acquisition of the whole body
anatomic and functional images during the same procedure. (56) 18 FDG PET CT
derived Gross Tumor Volume (GTV) is usually smaller than conventional GTV and is
more accurate. When a comparison was made between GTVs obtained from PET-CT,
CT and MRI, PET-CT had 97% accuracy compared to 69% for CT only and 40% for
MRI alone. In another study when volumes were compared, the GTV obtained from
CT alone differed significantly from the GTV obtained from PET-CT in 56% of
patients and in 46%, there was a 20% change in PTV. It was observed that
inter-observer variability was also significantly less when PET-CT was used. (57) Different
methods could be used to delineate the PET-CT tumor volume like Source to
background ratio (SBR) segmentation, border criterion of 50% of the maximum
[image:63.595.79.453.461.704.2]standardized uptake value (SUV50), visual interpretation and auto-segmentation.
In general, the tumor volume delineated by using PET-CT information was much
smaller than the CT volume but this varies greatly with the segmentation or
delineation strategy used. Therefore it could also be the same size or even bigger than
GTV identified on CT with significant non-overlap of the GTV PET volume with
GTV CT volume and this was attributed to be due to presence of peri-tumoral
inflammation. ref To mitigate this difference some authors had also proposed a
background-subtracted relative threshold level method which obtained reliable
thresholds independent of the signal-background ratios.
Some authors had compared the PET volumes with pathological specimen using
frozen specimens and volumetric assumption strategy. This method also failed to
identify the most appropriate method to delineate the tumor volume accurately but
was able to adequately prove that 18 FDG PET was the most accurate modality when
compared to CT and MRI. (58) In spite of all hypothesis the current segmentation
techniques does not approximate tumor volume accurately and what has been
suggested is an integration of both signal to background ratio and threshold SUV
based strategy. (59)
PET Signal changes during therapy
Historical data has identified that anatomic changes that occur during the standard
course of radiotherapy that extends for 5-7 weeks. PET-CT done during the course of
radiotherapy has demonstrated that beyond fourth week of radiation the reliability of
PET CT to identify tumor cells decreased. This was because the number of viable
showed an increasing trend with the increase in glucose avid macrophages in the
surrounding regions showing a high SUV uptake.
Dose escalation
Dose escalation in radiation therapy of the head and neck regions have been shown to
provide better local control which may in turn improve the outcomes of treatment.
The main problems which arise when we consider dose escalation is the higher dose
of radiation that the normal surrounding tissue receives. 18 FDG PET provides biologic
information regarding the tumor in addition to the anatomic data which promotes
accurate delineation and identification of the tumor separating it from the surrounding
normal tissue. Integration of 18 FDG PET CT in IMRT planning is beneficial by
treatment individualization and dose escalation. The volume delineated obtained by
integrating 18 FDG PET CT is usually smaller and it leads to better dose distribution
and escalation in dose to tumor alone and this in turn helps to better spare OARs like
parotid gland. Due to this dose escalation with significant reduction in toxicity was
possible and was carried out by a method called dose painting. Dose painting was
defined as locally boosting the tumor to increase locoregional control based on
functional imaging. It facilitates mapping of dose prescription to non-uniform
distribution of biochemical, metabolic and molecular abnormalities within the tumor.
When a higher BED of 92.9-95.8 Gy was delivered to tumor by dose painting, it was
associated with better complete response rates and lower risk of local residual disease
associated with better LFFS, DMFS and OS compared to the group that received a
BED of 85.9-88.6 Gy. Though the dose escalated group did report increased acute
since the volume to which escalated dose was delivered was small. Late toxicities
were found to be similar between the groups.(60)
Response assessment
Concurrent chemotherapy has been considered as standard of care for treatment of
head and neck squamous cell carcinoma since it can provide better locoregional
control and survival when compared to radiotherapy alone. Even with improved
results compared to radical radiotherapy alone about 20-30% and 10-15% develop
recurrences in the primary site or neck respectively within first 2 years of follow up.
The estimated median survival if a patient develops recurrence is dismal with a
survival less than 1 year if left untreated. Hence it becomes paramount to assess
response to treatment and detect recurrences early to administer appropriate treatment,
either salvage surgery or best supportive care. The need for a post treatment
evaluation tool that reliably predicts patient’s clinical evolution in the first years of
follow up was therefore important and in view of its higher sensitivity and specificity
there probably is no technique better suitable for this than 18 FDG PET CT. (61,62)
Conventional imaging modalities utilize size and other anatomic parameters to assess
response to treatment. In view of this, non-surgical treatments can cause significant
distortion to tumor shape and size and other anatomic parameters due to edema,
fibrosis and vascular changes, it cannot measure the viability of the tumor which
should be the ideal parameter to assess response. It is here that 18 FDG PET CT that
co-when a response assessment PET CT was done 12 weeks after treatment completion
and the results were compared to histology in case of residual disease, the sensitivity,
specificity, positive predictive value and negative predictive value were 86.7%, 90%,
76.5% and 93.1% at the primary site and 100%, 97.2%, 87.5% and 100% in the neck.
They concluded that 18 FDG PET CT was effective in detecting residual disease and in
predicting recurrent disease within the first 2 years of follow up after non-surgical
[image:67.595.72.518.308.471.2]treatment(61)
Table 1 Hopkins criteria for PET CT response assessment
Hopkins criteria shown above was one of the earliest criteria used for response
assessment before biomarkers were incorporated (63)
PET CT Biomarkers
Standardized Uptake Value
Standardized Uptake Value (SUV) is a semi-quantitative measure of the normalized
and the value can be used as a surrogate marker for the metabolism in the tumor. An
association can also be made between the SUV value and tumor burden or stage.
Aggressive tumors in general have high tumor burden and as a result high metabolism
correlated by higher SUV value. This has correlated with treatment outcome even for
different tumors of the same stage and size. Thus, in addition to tumor stage or burden
it also expresses some intrinsic biological characteristic of the tumor.(64)
SUV measurement can be done in a 2D region of interest (ROI) or 3D volume of
interest (VOI). The radioactivity measured at the ROI of interest has to be normalized
to the average radioactivity concentration in the patient’s body. The average
radioactivity concentration is approximated as the injected dose divided by the
patient’s body size, weight or body surface area. SUV is the ratio of tissue
radioactivity concentration and injected activity divided by the weight of the patient.
The value was influenced by various factors such as tissue activity, tissue state, time
from injection to imaging and normalization factors. Instead of body weight, some
authors also use lean body weight or body surface area.
SUVmax
The highest voxel value within a VOI or ROI is referred to as SUVmax. SUVmax is the
most commonly used parameter to measure metabolic tumor activity in oncological
imaging. It is usually measured by surrounding the target lesion with a 3D VOI or
drawing multiple 2D ROIs in different axial slices and interpolating it to detect the
highest activity. The advantage of SUVmax over SUVmean is that it is more reproducible
management for example, at baseline, during treatment, early and late post treatment
and during follow up of patients.
Baseline SUVmax
Factors that showed correlation with the baseline SUVmax value were T, N stage, local
control and DFS; higher value leading to poorer outcome. It was also found that
higher baseline SUVmax was associated with poor tumor differentiation, extracapsular
spread, skin invasion and absence of perineural invasion. (54)(64)
Multiple studies have shown that baseline SUVmax has been consistently associated
with advanced stage, large tumor size poor differentiation and outcome but the
association between baseline SUVmax and tumor recurrence has not been well
established. In a retrospective study that analyzed baseline SUVmax with respect to
survival in head and neck squamous cell carcinoma treated with radiotherapy with or
without chemotherapy, Machtay et al found that 2 year DFS rates varied between 76%
for patients with SUVmax <9.0 and 37% for patients with SUVmax >/= 9.0 (p=0.007).
The difference in outcome between the groups were as significant as the difference
seen with respect to tumor, node and metastasis stage. This suggested that SUVmax can
be used as a valuable biomarker that can help predict response and survival and thus
guide the aggressiveness of therapy. (53)
The cut-off for significant SUVmax value for high and low varied between studies
mostly due to the heterogeneous patient population and the intrinsic variability in PET
CT Scanners. It has been observed in general that an SUVmax > 9 has been consistently
more aggressive treatment and the ones with less < 9 should receive less aggressive
treatment. (53) But this is yet to be validated in large prospective trials.
SUVmax and therapy response
Post treatment 18 FDG PET CT is useful to decide subsequent management as it can
predict pathological response and long-term survival. Change in SUV as a surrogate to
response assessment was studied by Lowe et al. He prospectively studied mean SUV
change between pre-therapy and post-therapy PET scan and it was 34% in patients
with residual disease and 82% in patients having pathologically complete response.
(65) Prospective data using PET CT for evaluation revealed a significant difference
between DFS and OS between complete metabolic responders and non-responders.
Analysis of predictive value of post treatment SUVmax done, revealed that patients
with low primary tumor SUVmax in the post treatment period had a reduced risk of
progression and death by 83% and 72% respectively. It was also observed that change
in the SUVmax of primary tumor was a better parameter than change in nodal SUVmax
in assessing response to treatment. Though the absolute degree of change in SUVmax
has not been ratified, it has been well proven that change in SUVmax is a better
predictor of response and outcome when compared with other biomarker parameters.
Patients with change in SUVmax of 60-100% and post treatment SUVmax < 3 have been
found to have better overall and disease free survival and local control at 2 years. (66)
SUVmax and follow up
The role of 18 FDG PET CT in follow up is high due to its ability to detect local
recurrence, regional lymphatic spread and distant metastasis. The accuracy for same
varies based on the time interval between treatment completion and imaging. It is
generally recommended to do response assessment scan beyond 12 weeks rather than
immediately after treatment completion. A meta-analysis compared diagnostic
accuracy of scans done less than 12 weeks after treatment and more than 12 weeks
after treatment. For the evaluation of primary tumor, there was no significant
difference was seen (p=0.1266), but for the evaluation of nodal disease, scans
obtained after 12 weeks showed better accuracy. The sensitivity and specificity in
scans prior to 12 weeks was 62.5% and 85.1% respectively. But it increased to 90.4%
and 94.3% when the imaging was done after 12 weeks post treatment. (p=0.0003) (67)
SUVmean
SUVmean was a concept developed to negate the effects of SUVmax. It uses information
from multiple voxels thereby making it less sensitive to image noise. But this makes it
subject to both intra and inter observer variability since it depends on the voxels
which were chosen to calculate the average and ROI. Due to this it is not as
commonly used as a metabolic biomarker as SUVmax and there are limited data only
available to support its use. Studies have shown that high SUVmean at baseline and
change in SUVmean post treatment correlates well with survival and locoregional
SUVpeak
SUVpeak is a hybrid SUV measurement that includes a local average SUV value in a
group of voxels surrounding the voxel with highest demonstrated activity. This
concept was developed to maintain the high reproducibility of SUVmax while reducing
noise with improved statistics. In clinical imaging with noise properties typically
associated with whole body studies SUVpeak was shown to be a more robust
alternative to SUVmax to assess the most metabolically active tumor region. It has not
yet been used in a standardized way and has not been used for routine reporting yet.
Metabolic Tumor Volume
Metabolic tumor volume (MTV) is defined as the volume of tumor that demonstrates
FDG uptake. It is a combined metabolic and volumetric biomarker that can estimate
the volume of tumor based on the distribution of metabolic activity. The usual
biomarkers like SUVmax is a single pixel representation of maximum FDG uptake
whereas MTV can quantify the overall tumor burden. Volume based parameters were
sought to identify methods that can more accurately identify true tumor burden, better
predict outcome and hence prognosticate disease. There are different methods
mentioned to accurately and appropriately segment MTV. The most commonly used
methods include an absolute or fixed percentage SUVmax threshold and gradient or
adoptive segmentation methods. (66)
Various studies have demonstrated that baseline MTV correlated with short term
outcome including residual disease and recurrence, local control rates and even