Economic Performance of
Organic Farms in Europe
Organic Farming in Europe:
Economics and Policy
Volume 5
The individual contributions in this publication remain the responsibility of the authors.
Economic Performance of Organic Farms in Europe / Frank Offermann and Hiltrud Nieberg.- Stuttgart-Hohenheim: 2000
(Organic Farming in Europe: Economics and Policy; 5) ISBN 3-933403-04-9
ISSN 1437-6512
Edited by Prof Dr Stephan Dabbert
Department of Farm Economics, University of Hohenheim, Germany
Dr Nicolas Lampkin
Welsh Institute of Rural Studies, University of Wales, Aberystwyth, United Kingdom
Dr Johannes Michelsen
Department of Policy Studies, University of Southern Denmark, Esbjerg, Denmark
Dr Hiltrud Nieberg
Institute of Farm Economics and Rural Studies, Federal Agricultural Research Centre, Braunschweig (FAL), Germany
Prof Dr Raffaele Zanoli
Dipartimento di Biotecnologie Agrarie ed Ambientali, University of Ancona, Italy
Technical
editor: Dr Matthias Stolze and Anna Häring
Published by: Prof Dr Stephan Dabbert University of Hohenheim
Department of Farm Economics 410A
D-70593 Stuttgart
Germany Tel: +49 (0)711 459-2541 Fax: +49 (0)711 459-2555
E-mail: ofeurope@uni-hohenheim.de
http://www.uni-hohenheim.de/~i410a/ofeurope/
© University of Hohenheim/Department of Farm Economics 410A, 2000. All rights reserved. No part of this publication may be reproduced, stored in a retrieval system, or transmitted, in any form or by any means, electronically, mechanically, by photocopying, recording or otherwise, without the prior permission of the copyright owners.
The authors gratefully acknowledge financial support from the Commission of the European Communities, Agriculture and Fisheries (FAIR) specific RTD programme, FAIR3-CT96-1794, „Effects of the CAP-reform and possible further development on organic farming in the EU“.
Frank Offermann and Hiltrud Nieberg
Federal Agricultural Research Centre (FAL) Institute of Farm Economics and Rural Studies Bundesallee 50
D-38116 Braunschweig Germany
Tel: +49 (0)531 596 551 Fax: +49 (0)531 596 357 Email: hiltrud.nieberg@fal.de http://www.bal.fal.de
_______________________________
Executive Summary
This report is part of the research project „Effects of the CAP reform and possible further development on organic farming in the EU“. The main objective of this report is to give an overview of the socio-economic performance of organic farming in Europe at the farm and regional levels for all EU member states and three non-EU countries (Norway, Switzerland and the Czech Republic). Specifically, the physical and financial impacts are assessed in a review of current and previous studies. As part of the analysis of this data, specific attention is paid to the impact of direct support for organic farming under EC Reg. 2078/92, as well as the impact of the mainstream CAP reform measures.
The analysis is based on a literature review and data collected by national experts. Evaluated were published and unpublished studies, farm
accounting data and expert assessments.
Methodology
The comparability of economic calculations between countries is a common problem for economic analysis, due not only to the differences in
definitions. Different costs of living and purchasing power parities make comparisons of absolute figures less meaningful. Therefore, all analysed indicators of the organic farms were related to those of comparable conventional farms. A comparison of these ratios can be made between countries and studies, with differences in methodology and definitions being of much less consequence for the results. Profit, as given by the definition of Family Farm Income of the Farm Accountancy Data Network of the EU, was chosen as an indicator for the overall economic situation of the farms.
Resources and production structure
Yields, prices and costs
Yields in organic crop production are in general significantly lower than under conventional management. However, these yield differences vary between crops, and to a certain extent also between countries and regions analysed. For cereals, the range of observed typical yield ratios is quite narrow for most countries, especially in central and western Europe. Cereal yields are typically 60-70 % of those under conventional management. For most countries the studies evaluated show a high variation in both the absolute and the relative yield levels of potatoes. This variation exists within countries, between countries, and for data of different years. Vegetable yields are often just as high as under conventional management. Few data are available on pasture and grassland yields in organic farming, reported values lie in the range of 70-100 % of conventional yields, depending on the intensity of use. In livestock production, performances per head are quite similar to those in conventional farming. But, due to the lower
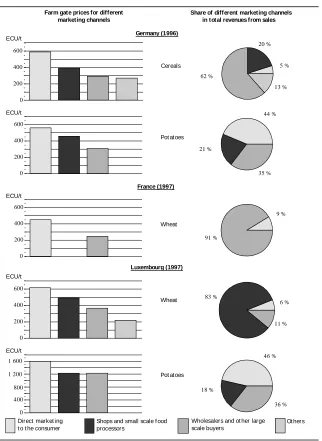
stocking rates observed in organic farms, performances per hectar are lower. An important aspect of the profitability of organic farms is the opportunity of receiving higher farm gate prices for organically produced goods than for conventionally produced ones. Prices vary considerably between the different marketing channels. The realised average organic price depends on the level of these prices and on the quantities marketed via the respective sales channels. For many products, the calculation of an ‘average organic farm gate price’ has to take into account that often part of the production still has to be sold at conventional prices. Currently, premium prices are very high for most crop products. In nearly all countries, average farm gate prices for organically produced wheat were 50-200 % higher than for conventionally produced wheat, while for potatoes average premia were in the range of 50 % to up to more than 500 %. In contrast, the average premium prices realisable for livestock products are generally significantly lower. Organically produced milk received on average a premia of 8-36 % on conventional prices. Data on prices for organically produced meat was available for only a few countries. While average farm gate prices for organic beef exceeded conventional prices by 30 %, the respective premia was 20-70 % for pork. Still, during the last few years, prices for some crop products came under pressure, while for livestock products, premium prices can increasingly be realised.
Profits
The analysis of the economic situation of organic farms in Europe shows that on average profits are similar to those of comparable conventional farms, with nearly all observations lying in the range of +/- 20 % of the profits of the respective conventional reference groups, but variance within the samples analysed is high. Profitability varies between the countries surveyed, and between different farm types.
Due to the high price premia realisable in the last few years, and the design of the general Common Agricultural Policy (CAP) measures (set-aside, compensatory arable payments), organic arable farms have in several countries been more successful than the average.
For dairy farms, in general relative profitability is higher if measured per family work unit than if measured per ha utilisable agricultural area. With the exception of one study in Italy, the observed profits per family work unit were equal to or higherthan in comparable conventional farms in all countries for which data was available. On the other hand, average profits per hectar were for only a few samples as high as those of the conventional reference group.
Very few data are available for horticultural farms or for pig and poultry farms. The respective studies highlight both the risks and the opportunities that exist for these farms.
For specialised, highly intensive farms, it would as a rule currently not be profitable to convert to organic farming.
The economic performance is in most countries significantly influenced by the support payments for organic farming, which on average contribute approximately 16-24 % of profits in DE, CH, AT and DK. Even more important is often the marketing situation. Data from Great Britain and Germany show higher prices for organic products to account for 40-73 % of profits for arable farms, while the respective share is lower for dairy farms (10-48 %).
Impact of the CAP reform
The CAP reform has for several reasons increased the relative competitiveness of organic farming.
Especially in countries where no support for organic farming was available before the reform, the introduction of support payments under EC Reg. 2078/92 has improved profitability. Price reductions for organic products due to the increase of supply did not take place to degree feared; quite the contrary, in some countries a positive development of the market for organic products was observed as a result of the increase in supply which facilitated more efficient processing and marketing structures.
level from the output level, had on average a positive impact on the relative profitability of organic farming.
The positive effect varies between farm types and regions, and is diminished by high payment levels of competing agri-environmental programmes, the lack of support for continuing organic farming in Great Britain and France, and, especially in the first years of the reform, the inflexible design of set-aside regimes and eligible livestock quotas in some countries, notably Great Britain.
Except for the set-aside schemes, the CAP reform measures have in general had no impact on organic production structures.
For the new EU-member states (Austria, Finland and Sweden) the accession has led to a sharp decline of conventional producer prices. In combination with the support for organic farming according to EC Reg. 2078/92, this has increased the relative competitiveness of organic farming.
Regional impacts
No studies were found that have assessed the regional effects of organic farming in the past or at its current level.
Assuming that the additional demand for labour in organic farms is 20 % per ha UAA, and that this additional demand is fully covered by new full-time jobs, estimates for 1996 suggest that throughout the EU, with 1.3 % of total agricultural land farmed organically about 18 000 more people were employed in agriculture than would have been in a situation without organic farming. This is equivalent to about 0.3 % of the total agricultural labour force (in annual work units) in the EU.
In the case of a major expansion of organic farming, it would be false to assume an average increase in labour demand based on a linear projection of the current levels. Possibilities for increasing income by means of on-farm processing and direct marketing, which are one reason for the increase in labour demand, do not exist in all regions; moreover, such benefits will also decrease, as more farms in a region follow this trend. An expansion will also result in a marked decrease in the demand for inputs such as chemical-synthetic fertilisers or pesticides, and a reduced demand for feed
concentrate, as well as lower output levels. Consequently, capacities in the upstream and downstream industries will not be fully utilised, and, if enterprises in these sectors are unable to adjust to this situation, redundancies will normally result and may lead to job losses.
Future development and research implications
In order to be able to evaluate and monitor the efficiency of the existing support schemes, as well as provide adequate advisory support, improving data availability will be essential.
The future development of the competitiveness of organic farming is influenced by a number of factors. Especially the development of prices for organic products and the development of technical progress both in organic and conventional farming will determine the evolution of relative
profitability. In addition, agricultural policy is likely to continue to have a substantial impact on the economic viability of organic farms.
Further areas of interest for future research into the economics of organic farming include the analysis of
the factors determining the absolute and relative economic profitability of organic farms;
the cost structures of organic farms in different countries, with a view to providing advice to the farmers and also assessing the competitiveness of organic farms in different regions;
the impact of future agricultural policies - Agenda 2000 - on organic farming;
the economic viability of direct marketing and on-farm-processing;
Table of contents
Executive Summary i
Table of contents vi
List of figures x List of tables xii
List of contributors xiv
Abbreviations xvii
Country Abbreviations xviii
1 Introduction 1
1.1 Objectives of the report 1
1.2 Data sources 1
2 Methodology used to analyse
the economic performance of organic farms 3
2.1 Definition of the subject of investigation 3
2.1.1 The level of investigation 4
2.1.2 Narrowing down the subject of investigation 4 2.2 Measuring the ‘economic performance’ of organic farms 4
2.2.1 Defining the reference system 4
2.2.2 Designing the reference system: The concept of
‘comparable conventional farms’ 5
2.2.3 Economic measurements for the analysis of
organic farming in comparison to conventional management 8
2.2.4 Factors influencing profitability 10
2.2.5 Procedure 10
3 Resources and production structure of organic farms 12
3.1 Resources 12
3.1.1 Agricultural land 12
3.1.1.1 Farm size 12
3.1.1.2 Development of farm size 13
3.1.1.3 Location 13
3.1.2 Labour 14
3.1.2.1 Labour use 14
3.1.2.2 Development of labour use 16
3.2 Production structure 20
3.2.1 Land use 20
3.2.2 Stocking rates 21
4 Comparative analysis of yields, prices
and costs in organic and conventional farming 23
4.1 Yields 23
4.1.1 The determinants of yields in organic farming 23 4.1.2 Yields in comparison to conventional yields 26
4.1.2.1 Yields in crop production 26
4.1.2.2 Performance in livestock production 30
4.1.2.3 Field experiments 32
4.1.3 Time series of yields 32
4.1.3.1 Yield development during conversion 32
4.1.3.2 Yield development over time 33
4.2 Prices 37
4.2.1 Prices in different marketing channels 37 4.2.2 Importance of different marketing channels 39 4.2.3 Average price premia for organic products 42
4.2.4 Price trends / time series 45
4.3 Costs 46
5 Comparative analysis of profits 54
5.1 Profits of organic farms in Europe - an overview 54
5.1.1 Data and methodology 54
5.1.2 Results 55
5.2 Overview of the financial performance
of organic farms in the study countries 59
5.2.1 Austria 59
5.2.2 Belgium 62
5.2.3 Czech Republic 63
5.2.4 Denmark 63
5.2.5 Finland 66
5.2.6 France 68
5.2.7 Germany 68
5.2.7.1 Old Laender 68
5.2.8 Great Britain 73
5.2.9 Greece 75
5.2.10 Ireland 75
5.2.11 Italy 75
5.2.12 Luxembourg 77
5.2.13 Netherlands 77
5.2.14 Norway 78
5.2.15 Portugal 80
5.2.16 Spain 80
5.2.17 Sweden 80
5.2.18 Switzerland 80
5.3 Time series of profits 82
5.4 Development of profits during conversion 84
5.5 Importance of premium prices 85
5.6 Importance of the payments for organic farming 86
6 Impacts of the CAP reform on organic farming 88
6.1 Introduction 88
6.2 Introduction of the agri-environmental programme - EC Reg. 2078/92 89 6.2.1 Impacts on the profitability of organic farming 89 6.2.1.1 Impact when no support was available prior to EC Reg. 2078/92 89 6.2.1.2 Impact when support was available prior to EC Reg. 2078/92 91 6.2.1.3 Impact on the relative profitability of organic farming :
Competitive schemes 92
6.2.1.4 Impact of the payments on risk 93
6.2.2 Impacts of different payment rates of the organic farming schemes 94
6.3 Compensatory arable area payments 97
6.4 Livestock headage payments 100
6.5 Impact of set-aside schemes 101
6.5.1 Importance of set-aside schemes for organic farms 101 6.5.2 Impact of set-aside schemes on organic farms 101
6.6 Overall impact of the CAP reform 103
6.6.1 Studies 103
6.6.2 Conclusions 105
6.7 Impact of the accession to the EU -
7 Conclusions and outlook 107
7.1 Competitiveness of organic farming: Today and tomorrow 107 7.2 Research implications for farm economics 108
8 Bibliography 110
Annex 1 Literature review on yields in crop production 123 Annex 2: Literature review on performances
in livestock production 148
Annex 3: Cost structure of organic and
comparable conventional farms 156
Annex 4: Overview of price premia for important products 163 Annex 5: Labour use on organic farms and
comparable conventional farms 171
Annex 6: Profits of organic and comparable conventional farms 179 Annex 7: Production structure of organic and
List of figures
Figure 2-1: The selection of a conventional
reference system for the analysis of organic farms 6
Figure 2-2: Components of profits 11
Figure 3-1: AWU per ha UAA on organic farms relative to comparable conventional
farms: an overview of results from various studies (1990-1997) 15 Figure 3-2: Development of labour (AWU) per ha UAA on organic
and comparable conventional farms in Germany and Switzerland 17 Figure 3-3: Land use of organic and comparable
conventional arable farms in Denmark and Great Britain 21 Figure 4-1: Determinants of optimal yield levels in organic and conventional farming 24 Figure 4-2: Impact of price level on yield differences
between organic and conventional farming 25 Figure 4-3: Yield trends in organic and conventional farms in Germany 35 Figure 4-4: Yield trends in organic and conventional farms in Switzerland 36 Figure 4-5: Importance of different marketing channels for revenues 41 Figure 4-6: Typical price premia for selected organically
produced crop products in different countries (1994-1997) 43 Figure 4-7: Typical price premia for selected organically
produced livestock products in different countries (1994-1997) 44 Figure 4-8: Comparison of important costs of organic and comparable
conventional farms in Germany (old Laender, ∅ 1996/97 and 1997/98) 49 Figure 4-9: Costs of organic arable farms in Denmark and
the Netherlands in comparison to conventional farms 52 Figure 5-1: Profits of organic farms relative to comparable
conventional farms in different countries: All farms (sample averages) 56 Figure 5-2: Profits of organic dairy farms relative to
comparable conventional farms in different countries 57 Figure 5-3: Profits of organic arable farms relative to
comparable conventional farms in different countries 58 Figure 5-4: Profits of organic mixed farms relative to
comparable conventional farms in different countries 58 Figure 5-5: Profits of organic and in-conversion farms in Denmark, 1996/97 64 Figure 5-6: Profits of organic farms in Finland 67 Figure 5-7: Net farm income on organic and comparable
conventional farms in Great Britain, 1995/96 74
Figure 5-8: Profits of organic farms in Italy 77
Figure 5-9: Profits of organic farms in the Netherlands, 1995 78 Figure 5-10: Profits in organic and comparable
Figure 6-1: Impact of supply subsidies when demand is inelastic 90 Figure 6-2: Impact of the replacement of the extensification programme
List of tables
Table 0-1: Exchanges rate for conversion of national currency
into ECU (budgetary rates) xvi
Table 2-1: Definition of profit: Family farm income 8 Table 3-1: Average organic farm size as a
percentage of average national farm size, 1995 12 Table 3-2: AWU per ha UAA on organic farms as a
percentage of comparable conventional farms in different countries 15 Table 3-3: Estimates of the additional demand for
labour in the EU due to organic farming, 1996 19 Table 3-4: Stocking rates on organic farms
relative to comparable conventional farms 22 Table 4-1: Cereal yields as percentages of conventional reference yields (farm data) 27 Table 4-2: Yields of oilseeds, root crops and pulses as
percentages of conventional reference yields (farm data) 27 Table 4-3: Vegetable yields as percentages of
conventional reference yields (farm data) 28 Table 4-4: Yields of permanent crops as percentages
of conventional reference yields (farm data) 28 Table 4-5: Yields of grassland and pastures as
percentages of conventional reference yields (farm data) 29 Table 4-6: Dairy yields per cow and year as
percentages of comparable conventional yields 31 Table 4-7: Farm gate prices realised in different sales channels (price in ECU) 38 Table 4-8: Share of different marketing channels in total sales 40 Table 4-9: Overview of the costs per ha UAA on organic farms
as percentages of the costs of comparable conventional farms 48 Table 4-10: Overview of the costs for hired labour on organic farms per ha UAA
as a percentage of the costs on comparable conventional farms 50 Table 4-11: Overview of depreciation on organic farms per ha UAA
as a percentage of the depreciation on comparable conventional farms 51 Table 5-1: Profitability of organic pig and
poultry farms and organic horticultural farms 59 Table 5-2: Profits in organic farming in Austria 60 Table 5-3: Overview of the results of model calculations
on the relative profitability of organic farming in Austria 61 Table 5-4: Distribution of gross profits of organic farms in Denmark, 1996/97 66 Table 5-5: Profits of organic farms in Germany six years after
conversion (1995/96). Results of a long-term study. 69 Table 5-6: Profits of organic farms in Bavaria
in 1995/96 by size of agricultural area. 70 Table 5-7: Profits of organic farms in the region of
Table 5-10: Organic conversion models: Financial returns under conven-tional and
organic management and during the transition period (£/ha, 1997 prices) 74
Table 5-11: Payments for organic farming 87
Table 6-1: Impact of regionally differentiated implementation of organic farming schemes1 according to
EC Reg. 2078/92 on profits - The case of Germany 95 Table 6-2: Net revenues of 6 representative farms in Campania, Italy,
under organic management compared to conventional management 96 Table 6-3: Effect of the compensatory arable area payments on revenues
depending on the extent of the price reduction for organic products 98 Table 6-4: Arable area payments (AAP) per ha UAA on organic farms 99 Table 6-5: Share of compensatory arable
area payments in profits for different farm types 99 Table 6-6: Livestock headage payments per ha UAA on organic farms 100 Table 6-7: Impact of the set-aside schemes introduced as part of
the CAP reform on the economic situation of organic farms 102 Table 6-8: Impact of the CAP reform
on the economic situation of organic farms in Germany 103 Table 6-9: Impact of the CAP reform on different farm types in Germany:
List of contributors
AT: Ludwig Maurer, Ludwig Bolzmann Institut, Rinnboeckstr. 15, A-1110 Wien, Austria.
BE: Guido van Huylenbroek and Alain Coppens, University of Gent, Department of Agricultural Economics, B-9000 Gent, Belgium.
CH: Otto Schmid, FiBL (Research Institute for Organic Agriculture), CH-5070 Frick, Switzerland.
CZ: Tomas Zidek, ICEA, Foundation for Organic Agriculture, CS-Praha 10, Czech Republic.
DE: Frank Offermann and Hiltrud Nieberg, Federal Agricultural Research Centre (FAL), Institute of Farm Economics and Rural Studies, D-38116 Braunschweig, Germany.
DK: Henning Peter Jorgensen, Department of Cooperative and Agricultural Research, South Jutland University Centre, Niels Bohrs Vej 9, DK-6700 Esbjerg, Denmark.
Niels Halberg, Department of Agricultural Systems, Danish Institute of Agricultural Sciences, Research centre Foulum, P.O. Box 50, DK-8830 Tjele, Denmark.
ES: Jose M. Sumpsi, Politechnic University of Madrid, Departamento Economia y Sociologia Agraria, E-Madrid, Spain.
FI: Vesa Kallio and Jukka Rajala, Mikkeli Institute for Rural Research and Training, Lönnrotin Katu, 3-5, SF-50100, Mikkeli, Finland.
FR: Christophe David, ISARA Institut Superieur d’Agriculture Rhone-Alpes, F-69288 Lyon Cedex 02, France.
GB: Susanne Padel, Welsh Institute of Rural Studies, University of Wales, GB-Aberystwyth, SY23 3AL, Great Britain.
GR: Agapi Vassiliou, Cretan Agri-Environmental Group, GR-70400 Moires, Crete, Greece.
IE: Mary Lynch, IRL-Kenmare, Co Kerry, Ireland.
IT: Daniela Vairo, Raffaele Zanoli, Department for Agricultural Economics, University of Ancona, Via Brecce Bianche, I-Ancona, Italy.
LU: Marianne Altmann and Dirk Kopp, CO-Concept, L-1631, Luxembourg.
NO: Ketil Valde and Martha Ebbesvik, NORSØK, Tingvoll Gard, N-6630 Tingvoll, Norway.
PT: Americo Mendes, Faculty of Economics, Catholic University of Portugal, P-Porto, Portugal.
SE: Berit Nordlander and Annika Arnesson, Länsstyrelsen, Landbruksavdelningen, Box 224, S-532 23 Skara, Sweden.
Exchange rates
Table 0-1: Exchanges rate for conversion of national currency into ECU (budgetary rates)
xvi
1 ECU = 1 national currency =
Yearly average
1993 1994 1995 1996 1997 1993 1994 1995 1996 1997
ATS 13.62 13.54 13.18 13.43 13.82 0.07342 0.07386 0.07587 0.07446 0.07234
BEF/LUF 40.47 39.66 38.55 39.30 40.53 0.02471 0.02521 0.02594 0.02545 0.02467
DEM 1.94 1.92 1.87 1.9095 1.96 0.51546 0.52083 0.53476 0.52369 0.50907
DKK 7.59 7.54 7.33 7.36 7.48 0.13175 0.13263 0.13643 0.13587 0.13363
ESP 149.12 158.92 163.00 160.75 165.89 0.00671 0.00629 0.00613 0.00622 0.00603
FIM 6.70 6.19 5.71 5.83 5.88 0.14925 0.16155 0.17513 0.17153 0.17005
FRF 6.63 6.58 6.53 6.49 6.61 0.15083 0.15198 0.15314 0.15408 0.15123
GBP 0.78 0.78 0.83 0.81 0.69 1.28205 1.28205 1.20482 1.23457 1.44445
GRD 268.57 288.03 302.99 305.55 309.36 0.00372 0.00347 0.00330 0.00327 0.00323
IEP 0.80 0.79 0.82 0.79 0.75 1.25000 1.26582 1.21951 1.26582 1.33776
ITL 1841 1915 2130 1959 1929 0.00054 0.00052 0.00047 0.00051 0.00052
NLG 2.18 2.16 2.10 2.14 2.21 0.45872 0.46296 0.47619 0.46729 0.45232
PTE 188.37 196.90 196.11 195.76 198.59 0.00531 0.00508 0.00510 0.00511 0.00504
SEK 9.12 9.16 9.33 8.51 8.65 0.10965 0.10917 0.10718 0.11751 0.11559
CHF 1.73 1.62 1.55 1.57 1.64 0.57797 0.61680 0.64694 0.63780 0.60827
CZK na na 34.77 34.46 35.93 na na 0.02876 0.02902 0.02783
NOK 8.31 8.37 8.29 8.20 8.02 0.12034 0.11941 0.12069 0.12200 0.12471
Source: Statistisches Bundesamt, Statistisches Jahrbuch für das Ausland; Data for 1997 and Czech Republic: Eurostat
Abbreviations
AAP Arable Area Payments
AWU Annual Work Unit
CAP Common Agricultural Policy CEE Central and Eastern Europe FADN Farm Accountancy Data Network
FFI Family Farm Income
FWU Family Work Unit
LU Livestock Unit
NFI Net Farm Income
ONI Occupiers Net Income
ÖPUL Österreichisches Programm zur Förderung Umweltgerechter Landwirtschaft
RICA Reseau d’Information Comptable Agricole (French acronym for FADN)
xviii
Country Abbreviations
AT Austria BE Belgium CH Switzerland
CZ Czech Republic
DE Germany DK Denmark ES Spain FI Finland FR France
GB Great Britain & Northern Ireland GR Greece
1
Introduction
1.1
Objectives of the report
The main objective of this report is to give an overview of the socio-economic performance of organic farming in Europe at the farm and regional levels. Specifically, the physical and financial impacts will be assessed in a review of current and previous studies. On the basis of these data, the socio-economic impacts will be determined by comparing the incomes of organic and similar conventional farms. As part of the analysis of this data, specific attention will be paid to the impact of direct support for organic farming under EC Reg. 2078/92, as well as the impact of the mainstream CAP reform measures.
This report is part of the research project “Effects of the CAP reform and possible further development on organic farming in the EU” (FAIR 3-CT96 1794), carried out with financial support from the Commission of the European Communities. The general objective of the project is to provide an assessment of the impact of the 1992 CAP reform on organic farming, and thus contribute to a better understanding of the effects that current EU policies have on this sub-sector.
The methodology adopted will be presented and discussed in Chapter 2. The economic analysis will be introduced by an overview of the resources and production structure of organic farms in Chapter 3. Chapter 4 presents and analyses the survey results for yields, prices and costs. In the light of these findings, the profits of organic farms in relation to comparable
conventional farms will be presented in Chapter 5, differentiated by country and farm types. A more detailed look at the specific situation in each of the countries surveyed will provide further explanations and insights into the economic performance of organic farms in these countries. The impact of the 1992 CAP reform on organic farming is dealt with in detail in Chapter 6; this is followed by a discussion of regional impacts of organic farming in Chapter 7. Finally, Chapter 8 provides conclusions and an outlook on the competitiveness of organic farming, as well as important research topics for farm economics.
1.2
Data sources
sector in their own countries. Each partner is also responsible for supervising the data collection by the sub-contractors in a number of countries.
In line with the procedures adopted for the whole project, the authors developed a standardised questionnaire that specified the data requirements for the analysis and provided a common format for data collection. The questionnaire was circulated to all project partners and to all contributors for feedback. It was modified accordingly and guidelines were drawn up, as was an example of a completed questionnaire. In the next step, the
questionnaire was pre-tested by one project partner before the final version was sent to all national experts.
The national experts were advised to utilise the following data sources:
literature reviews of scientific journals and specialised literature as well as the relevant grey literature,
unpublished results of ongoing research projects, and
2
Methodology used to analyse the
economic performance of organic farms
In this section the methodology used in the analysis is outlined. In addition, it has proved necessary to supply a definition for several economic terms that are used throughout this report, as the meaning of some terms may differ substantially from country to country.
This report, like many other economic investigations, will focus on financial economic indicators (e.g. profit) instead of broader aspects (e.g. utility) for reasons of practicability. Financial performance is widely seen as an important factor determining the acceptance of organic farming. Still, as several surveys have shown, the motives for conversion to organic farming are numerous, and often the ‘economic’ incentive is less important in this decision than other factors, such as concerns about the environment or working conditions (see e.g. Schulze Pals 1994, Köhne and Köhn 1998, Padel and Lampkin 1994). This aspect should be kept in mind when evaluating the economic data of organic farms, despite the strong growth in the adoption of organic management practices following the introduction of financial support for organic farming in most countries, which highlights the increased importance of financial aspects.
In the following paragraphs, some basic definitions regarding the subject of investigation and performance measures will be given to provide the necessary background for this analysis. As the research project covers 18 countries in Europe, the problems of cross-country comparisons of economic performances will be addressed specifically.
2.1
Definition of the subject of investigation
2.1.1
The level of investigation
An analysis of the economics of single enterprises or production processes provides an insight into the relative profitability of these processes. Corresponding information, e.g. gross margin data, is valuable for farm planning, as it aids the determination of optimal production structures when production processes are competing for scarce resources like agricultural land. The survey thus collected information on the economics of single production processes for the different countries. This information will be used at a later stage of this project to model organic farming.
But for an evaluation of the profitability of organic farming, analysing the economics of single production processes will not suffice. Complementary relationships between production processes are even more common and important in organic than in conventional production systems (Schulze Pals 1994). Only whole farm measures can fully take into account these close complementary relationshipsof organic production processes. In addition, the importance of variable costs as a profit factor is reduced in organic farming as compared to conventional farming (Padel and Lampkin 1994) and the importance of overheads increases. Therefore an analysis at the level of the whole farm is required.
2.1.2
Narrowing down the subject of investigation
The final economic decision unit of farms is usually the household. Still, as the focus in this report is on the specifics of organic farming, the analysis can concentrate on the economics of those farm activities that are related to organic farming: That means non-agricultural activities such as off-farm work need not be included in the analysis, while activities that prove to be ‘linked’ to organic farming are important for the evaluation of the socio-economic performance of organic farming. ‘Linked’ here means that the occurrence of some activities, or at least the extent to which they occur, can be attributed to the fact that the farm is managed organically. Possible examples of such activities may be direct marketing (Dabbert 1990) or agri-tourism.
2.2
Measuring the ‘economic performance’ of organic farms
2.2.1
Defining the reference system
In the long run and with a more widespread conversion to organic farming, relative profits and the criteria of profit maximisation are becoming more important for analysing the economic performance of organic farming. In this report, organic farming will be called economically profitable if the profits are higher than those of other possible activities. Thus, organic farming is economically profitable if the return to the production factors used exceeds their opportunity costs. While there are a large number of possible uses for most production factors, and many analyses on the economics of agriculture have tried to compare the income from farming to incomes in other sectors of the economy, here the emphasis is on the comparison with other management practices. The underlying argument is that the focus of the study is on the agricultural sector and on the use of production factors that are nearly exclusively used by agriculture, like agricultural land. Therefore, the opportunity costs are defined by alternative agricultural non-organic land uses.
There are a multitude of possible non-organic farming practices, e.g. intensive or extensive conventional farming, integrated farming and other management practices supported by EC Reg. 2078/92. In this report, a comparison will be made with ‘conventional’ farming. The term ‘conventional’ will actually mean ‘non-organic’ here, and usually represent the most common agricultural production system in the respective region.
2.2.2
Designing the reference system: The concept of ‘comparable
conventional farms’
When comparing, for example, the profit of an organic farm to that of conventional management, the underlying question is:
What profit would the farm realise if it was managed conventionally?
To answer this question would actually require the assessment of the profits of a farm in a hypothetical situation. Such an assessment clearly has to make a number of assumptions regarding the production structure, yields, etc. While a few studies exist that have attempted to calculate hypothetical profits by drawing on expert information or models, such an approach is time-consuming and the results very much depend on the assumptions made.
Figure 2-1: The selection of a conventional reference system for the analysis of organic farms
Source: Nieberg and Offermann (1998)
An obvious solution would be to compare the situation of the organic farm before and after conversion (in Figure 2-1:, this corresponds to
comparing the organic farm at a point in time tx with its conventional
situation at a point in time t0). The economic data for the period before
conversion is often easily accessible, and thus does not need to be estimated or calculated. A serious drawback of this procedure is that a comparison with an earlier situation neglects any development the farm would have undergone even if it had not converted. The longer the time span since conversion, the less viable is this approach, since changes in external parameters like prices, policies and technical progress would have substantially influenced economic performance, even without conversion. A better assessment is possible using the income of conventional farms in the year of observation as an indicator for the hypothetical ‘conventional’ income of the observed organic farm. To avoid comparing two things that are in fact very different, these conventional farms should be ‘comparable’ to the observed organic farms. This will be the case if they have a similar ‘potential’, that is, a similar endowment with production factors. As the objective is to isolate the effect of the farming system on profits, the choice of characteristics for the selection of comparable conventional farms has to be restricted to ‘non-system determined’ factors. Examples of factors that are clearly ‘non-system determined’ are locational factors such as region, soil texture, topography, climate and market distance (Fowler, Lampkin and Midmore 1998). A very simple first approach for assessing the potential income of the conventionally managed farm is therefore to use average data of a sample of conventional farms in the same region. This data is available in most countries as part of their national farm accounting systems. In Figure 2-1, this approach is illustrated on the right-hand side of the
FRAMEWORK conv. f arm conv. f arm conv. f arm region farm type farm size Selection variables? region farm type farm size livestock numbers labour density production costs production structure yields profit borrowed capital Selection variables?
t0 t1 tx
diagram, comparing organic and selected conventional farms at a point in time tx.
Comparability improves as more factors are taken into account in the selection of the group of conventional farms used for comparison1. The
problem is that for many farm characteristics, the distinction between ‘non-system’ and ‘system-determined’ factors is not so clear as in the examples given above (Dabbert 1990; Nieberg and Offermann 1998). Is there no link at all between the size of a farm and the system? This might not be the case, if there is a clear correlation between farming system and annual growth of farm size. There is an obvious link between production structure and farming system; but to what extent is there no such link with the farm type? Intensive livestock farms are often seen to reduce their livestock after conversion and move towards a mixed farm. So, should comparable conventional farms be mixed or intensive livestock farms? Similar problems exist for labour. Despite these difficulties, factors that are generally seen as non-system determined and thus used for selecting a group of comparable conventional farms are: location, size and a rough classification of the farm type.
A solution to many of these problems is possible where the situation before conversion is known; the farms used for comparison are therefore selected such that their past situation resembles that of the now organic farm in its former conventional situation(in Figure 2-1:, selecting conventional farms which are comparable at a point in time t0, and comparing the farms at a
point in time tx). This procedure ensures that conventional and organic
farms have similar conventional starting positions. It requires the application of multivariate (cluster) analysis and the observation of the comparable farms over the years.
One problem that is possibly system-determined, and which, even with this approach, cannot be solved, concerns the abilities of the farm manager: Is there a correlation between managerial abilities and inclination to
conversion?
To sum up the discussion above, four main approaches have been identified for choosing a reference system:
Calculation of the hypothetical profits by drawing on expert information or models
For short-term comparisons, comparing the situation of the farm before and after conversion
Approximation of the potential income by analysing the economic situation of conventional farms that are comparable with respect to a few important non-system determined characteristics
Comparison with conventional farms that are selected so as to resemble the analysed organic farm in the years before conversion.
1 On the other hand, there are clearly difficulties involved in increasing the number of variables used. The
Some studies evaluated in this report did not identify a reference system. Therefore, experts in each country were asked to provide data for comparable conventional farms whenever necessary, to ensure that the basis used for comparison reflects regional conditions and structures.
2.2.3
Economic measurements for the analysis of organic farming in
comparison to conventional management
Various measures of the economic performance of farms exist. Which measure is the most appropriate depends on the purpose of the analysis. ‘Profit’ is generally one of the most common and accepted indicators for the success of an economic activity. Still, profit definitions vary between countries and studies. To ensure the comparability of the economic data as far as possible, the questionnaire used in the survey for this report provided a definition of profit (Table 2-1), which is based on the definition of ‘Family Farm Income’ according to the Farm Accountancy Data Network (FADN) of the Commission of the European Union (EC 1989).
Table 2-1: Definition of profit: Family farm income
+ Market revenues from sales of agricultural products
Farm + Subsidies, compensatory payments
output + Other farm income (rents, contract work for others, ...)
+ Net value of change in stock
+ Value of farmhouse consumption
- Specific costs / variable costs
- Overheads (including depreciation)
minus costs - Wages, salaries paid to seasonal and non-family workers
- Interest paid on borrowed capital
- Rent paid
= Profit (family farm income)
Family farm income is an income measure that is close to the financial decision making on the farms. It represents the return to the farm family’s own labour, land and capital. For comparative purposes, it is therefore important that the reference farms have similar characteristics with respect to land tenure, availability of unpaid family labour, and reliance on
Typically, profits are expressed in relation to
agricultural land: profits per ha utilisable agricultural area (UAA)
family labour: profits per family work unit (FWU)
Wherever possible, we have tried to account for differences in national definitions and adjust the data accordingly. The major remaining differences in the profits are listed below.
In Austria, profits include income from forestry. Forestry accounts for about 8 % of revenues in 1996 for the sample of organic farms.
For Denmark, gross profit from agriculture is used. Interest and rent are not included in the costs.
In Great Britain, the most notable differences relate to the profitability indicators used. One of the most commonly available measures of success here is net farm income (NFI). NFI is farm profit after adding back interest and ownership charges, minus imputed costs for unpaid family labour and notional rent. It represents the reward to the farmer and spouse for their own manual labour, management and interest on capital invested in the farm, whether owned or not (MAFF 1997). NFI is designed to allow comparability between farms irrespective of land, labour and capital resource endowment. It has therefore been used for the comparative analysis of farms in Great Britain. In addition, occupiers' net income (ONI), which is closer to the definition of farm family income, has been calculated wherever the necessary information was available. ONI
corresponds to farm profit minus a notional charge for unpaid family labour (not farmer and spouse).
2.2.4
Factors influencing profitability
The economic performance of organic farms is influenced by a number of factors. It is necessary to clearly differentiate between the determinants of ‘absolute’ profitability (level of farm profits) and the determinants of relative profitability (profits compared to profits under conventional management). Naturally, many of these determinants are important for both types of profitability, e.g. good market access; but the impact that some of them have may be very different. Good natural production conditions will have a positive impact on profits, due to the positive influence on yields. At the same time, they may have a negative impact on relative profitability, due to the increased competitiveness of intensive conventional farming systems - a hypothesis which is backed by the observed concentration of organic farms in less favoured areas.
The determinants of absolute profits are in general very similar to those in conventional farming, though their relative importance may vary. Whole farm performance is influenced by yields, prices, costs, enterprise structure and labour requirements under organic farming (Padel and Lampkin 1994). Comparing successful and less successful organic farms in the new Laender
in Germany, Nolte (1997) also found that size, soil quality, and the degree of specialisation affected financial performance.
Schulze Pals (1994) identified natural conditions, market access, the possibilities of increasing farm size (land market), low stocking rates and payments for organic farming as factors influencing relative profitability. Grouping farms by their relative performance as compared to paired conventional reference farms, Nieberg (1997) showed that farm size, farm type, cereal and milk yields, prices and fixed costs are important
determinants.
The influence of the farm manager’s abilities on economic performance has not been measured, but can be assumed to be one of the most important determinants, as is the case also in conventional farming. The question whether managerial abilities are more important for the financial success than in conventional farming remains unanswered.
2.2.5
Procedure
Based on the discussion above, the economic analysis in this report is structured according to the composition of farm profits as shown in Figure 2-2. This analysis of the major components of profit will not only provide explanations for whole farm performance in different countries and for different farm types; it will also give an indication of the economic performance of organic farms in those countries where no data on whole farm profits was available.
these findings, the presentation of the profits of organic farms in relation to comparable conventional farms will be differentiated according to countries and farm types. A more detailed look at the specific situation in each of the countries surveyed will provide further explanations and insights into the economic performance of organic farms in the respective countries. Specific attention is paid to the importance of premium prices and support payments for organic farming for farm profits.
Figure 2-2: Components of profits
Yield Price
From sales
Revenues
Other revenues
e.g. Subsidies Profit / Income
Costs
3
Resources and production structure of
organic farms
3.1
Resources
One determinant of the financial performance of farms is their resource endowment. In this chapter, a short overview of the resource base of organic farms is given as a background for the interpretation of economic results.
3.1.1
Agricultural land
Important characteristics of the endowment of farms with respect to the production factor ‘land’ are size (area per farm) and land quality (soil quality, natural conditions).
3.1.1.1 Farm size
The size of the farms, measured in ha UAA, will influence not only total income per farm, but also income per ha UAA, as in agriculture cost degression is an important phenomenon.
Most comparisons in this report are made between organic and comparable conventional farms. To eliminate farm size-related differences and isolate the impact of the farming system, the size of the farms was one of the most important criteria in the selection of comparable conventional farms (Chapter 2). Thus, a comparison of the area of organic farms to that of comparable conventional farms is not useful here, as the two will in general be similar with respect to the size of UAA. To allow a basic classification of organic farms according to size, the average organic farm size here is compared to the average farm size of all farms in each of the surveyed countries (Table 3-1).
Table 3-1: Average organic farm size as a percentage of average national farm size, 1995
SE NO LU FR GB BE GR DK DE CH FI IE NL ES AT IT PT EU 15
55 56 71 89 90 98 99 106 109 118 118 120 124 127 140 277 398 138
The figures in Table 3-1 show the high variation in average organic farm size in relation to national averages. But the figures also indicate that, in the EU and in the majority of countries, organic farms are larger on average. The reasons for this vary from country to country. In Germany, the size of full-time organic farms in the national accounting system is equal to the size of all full-time farms (BMELF 1998) in the old Laender - which might suggest that a greater average size is due to a higher share of full-time farms, since part-time farms are often smaller. Also, the relatively high proportion of organic farming in the new Laender, where farm sizes exceed those anywhere else in the European Union, contributes to this phenomenon. In Switzerland, the share of full-time organic farms is equal to the national average, and the larger size of organic farms is attributed to the high
proportion of relatively large organic farms in mountainous regions, where it seems to be easier for larger farms to compensate for reduced forage yields (Hartnagel 1998).
A lower share of typically smaller farm types, like intensive pig and poultry farms, may also contribute to organic farms being larger.
3.1.1.2 Development of farm size
An interesting and important aspect is the development of farm size. As in the rest of the agricultural sector, farm sizes are increasing steadily. To analyse this farm growth, it is again useful to draw a comparison with the respective development of comparable conventional farms. In her comparison of a sample of organic farms in Germany with a group of comparable conventional farms, which were of the same size as the organic farms before these had converted, Nieberg (1997) shows a similar
increase in farm size over time for both groups.
3.1.1.3 Location
3.1.2
Labour
3.1.2.1 Labour use
Labour requirements on organic farms are subject to intensive discussion. According to Schulze Pals (1994), increased labour requirements in organic farms may be expected, due to
more labour-intensive production activities, especially for arable crops (mechanical weed control),
a higher share of more labour-intensive crops (e.g. vegetables, potatoes),
more marketing and on-farm processing activities,
an increase in information requirements.
On the other hand, reduced stocking rates (see below) will have a labour-saving effect.
As the exact determination of labour input is difficult, the data has to be interpreted with some care. Some of the most common methodological problems encountered are listed below.
The definition of labour input may vary between studies. Often, the calculation of labour units is based on standardised figures, e.g. one Annual Work Unit (AWU) for each person between 18 and 65 years who works full-time on the farm - this will often produce different results than studies, which try to estimate actual working hours using a process analytical approach.
Indirect labour requirements, i.e. external services (contract work), are generally neglected; while this will not directly affect labour use in farm-level accounting, it should be taken into consideration if a more general evaluation of the differences in labour requirements is to be performed (Marino et al. 1997).
The selection of conventional farms used for comparison varies between studies, and selection criteria that are well-suited to economic
comparisons may not always be as well-suited for comparisons of labour requirements.
Almost no studies exist that have applied statistical tests to verify the significance of any differences in mean (Marino et al. 1997).
In spite of all these limitations, the large number of studies evaluated for this report will at least allow an estimation of trends, and a rough assessment of the order of the average differences in labour requirements between organic and conventional farms.
Table 3-2: AWU per ha UAA on organic farms as a percentage of comparable conventional farms in different countries
AT CH DE DK FI FR LU IT NL
Years 1993 1993-96 1993-97 1996/97 1995 1997 1997 1992-95 1995
% 91 110-132 102-118 105 89 (125)1 (125)1 60-90 (214)2 157
Source: Own calculations based on Schneeberger (1995) for AT, FAT (diff. years) and Mühlebach and Mühlebach (1994) for CH, BMELF (diff. years) and Nieberg (1997) for DE, DIAFE (1998) for DK, AERI (1997) for FI, Salghetti (1997), Zanoli, Fiorani and Gambelli (1998), Santucci and Chiorri (1996) as quoted in Marino et al. (1997), Zanoli and Fiorani (1997) for IT, Dutch FADN for NL
1 Expert estimate
2 Single study (Cerasola and Marino 1995), year of data unknown
Figure 3-1: AWU per ha UAA on organic farms relative to comparable conventional farms: an overview of results from various studies (1990-1997)
N
u
m
b
er
of
s
tu
d
ie
s
0 2 4 6 8 10 12
AWU per ha UAA as a percent age of comparable conventional f arms 60-70 %
70-80 % 80-90 %90-100 %100-110 %110-120 %120-130 %130-140 %140-150 %150-160 %> 160 %
Source: Own calculations based on survey of literature and expert assessments. See Annex 5.
ambiguous, and both higher or lower labour uses than on conventional farms have been reported.
Compared to national averages (as opposed to comparable conventional farms), the values for AWU per ha UAA are often significantly higher on organic farms than the above-mentioned 10 % to 20 %, which may be explained by the fact that farm types with higher labour requirements constitute a higher share of the organic farms (BMLF 1996).
Surprisingly, in contrast to the results for AWU per ha UAA, the resource endowment of family labour per ha UAA is almost always lower on organic than on comparable conventional farms (see Annex 5). There is no clear explanation for this phenomenon. It might be related to the different sociological characteristics of organic farms. Possibly, as organic farms are more often managed by younger, better educated farmers, the spouse is more likely to have an off-farm job and may thus not be counted as farm labour.
3.1.2.2 Development of labour use
Due to technical progress, which has made many operations less labour-intensive, and to economic circumstances, the agricultural workforce has been continuously and drastically reduced over the last decades. Generally, it is to be expected that these developments will affect organic farms in a similar way.
For Switzerland and Germany, time series oflabour use on organic farms were analysed. Labour per ha UAA has been sharply reduced in the last years (by approx. 35 % since 1990, Figure 3–2). In general this is not so much due to fewer labour units per farm, but due to an increase in farm sizes. As labour use has not been reduced by the same margin on
comparable conventional farms, the ratio of AWU per ha UAA on organic in contrast to conventional farms has steadily declined. A similar phenomenon can be observed from the evaluation of some other studies (e.g. in
Denmark). The earlier the studies2, the higher the frequency with which
higher relative values for labour use in organic farming are reported. One possible explanation for this is that the share of more labour-extensive farm types has increased over the years. Also, reduced labour requirements may be due to the development and spread of labour-saving technology in organic farming (e.g. flame weeders) in recent years.
Figure 3-2: Development of labour (AWU) per ha UAA on organic and comparable conventional farms in Germany and Switzerland
Sources: FAT (diff. years) for Swiss and BMELF (diff. years) for German data.
The development of labour use in the years directly following conversion may differ from the above results. Nieberg (1997) reports a 11 % labour increase per ha UAA on organic farms within four years after conversion, whereas the comparable conventional farms reduced AWU per ha UAA by 11 % in the same period. This increase was most pronounced for arable farms, which used 37 % more labour than before conversion.
Again, it has to be pointed out that methodology, the time period analysed, and the selection procedure for comparable conventional farms will
considerably influence the results with respect to labour use, and that these should be interpreted carefully, especially when extrapolating observations for prognoses.
Labour requirements are higher in organic farming, but the actual levels often seem to be exaggerated in public discussion. This may be so because changes observed in the last few years are not taken into account. But it may also be the result of people overestimating the importance of some quite labour-intensive organic production processes (e.g. vegetables) for total labour use, while at the same time underestimating the labour-saving effect of reduced stocking rates (see below).
Switzerland Germany
7 8 9 10 11 12 13 14 15 16 17
A
W
U
/1
00 ha
U
A
A
90/91 91/92 92/93 93/94 94/95 95/96 96/97
3.0 3.5 4.0 4.5 5.0 5.5 6.0
1990 1991 1992 1993 1994 1995 1996
3.1.2.3 Excursus: Creating new jobs through organic farming?
Unemployment is high in many regions in the EU, and therefore the impact of organic farming on rural employment is of special interest. As shown above, the average increase in labour use per ha is about 20 %. Consequently, organic farming will potentially create new jobs in rural areas.
Assuming that the additional demand for labour on organic farms is 20 % per ha UAA, and that this additional demand is fully covered by new full-time jobs, estimates for 1996 suggest that throughout the EU, with 1.3 % of total agricultural land farmed organically about 18 000 more people were employed in agriculture than would have been in a situation without organic farming (Table 3-3). This is equivalent to about 0.3 % of the total agricultural labour force (in annual work units) in the EU.
However, an increased demand for labour will not necessarily result in the creation of sustainable full-time employment.
In some of the farms (exact figures are not known), the increased demand for labour is covered by the existing family workforce. On some farms where the workforce capacity was not fully used under
conventional farming, conversion to organic farming may have resulted in full utilisation of these capacities. On others, where the increased labour demand is met from within the family, some family members suffer from an excessive workload.
In many farms, the increased demand for labour is to a large extent covered by seasonal workers. In some countries and regions within the EU, these come from non-member states such as Eastern European countries or North Africa.
Although organically managed farms have a relatively higher labour demand, they, like conventionally managed farms, aim to increase labour efficiency. With the implementation of technical progress and the constant increase in farm size, a clear trend towards reduced labour demand per ha has emerged in many organic farms. Therefore it can be assumed that organic farming alone will not stop the general European trend towards fewer farms and a growth in economic scale.
Table 3-3: Estimates of the additional demand for labour in the EU due to organic farming, 1996
Conventional land area ha UAA
Organic land area ha UAA
Total labour force in annual work units
Of which: additional labour
force of organic farms
Additional labour force of organic
farms as % of total
AT 3 118 911 309 089 141 500 2 506 1.77
BE 1 368 739 4 261 79 100 49 0.06
DE 16 861 289 473 711 683 000 3 713 0.54
DK 2 676 011 44 989 83 900 277 0.33
ES 29 515 265 103 735 1 029 700 721 0.07
FI 2 058 445 84 555 178 300 1 396 0.78
FR 30 077 916 137 084 1 031 300 935 0.09
GB 15 808 465 49 535 393 300 246 0.06
GR 5 157 731 5 269 598 100 122 0.02
IE 4 509 504 20 496 223 400 202 0.09
IT 14 736 824 334 176 1 687 100 7 449 0.44
LU 125 406 594 4 700 4 0.09
NL 1 956 615 12 385 223 300 281 0.13
PT 3 947 809 9 191 573 400 266 0.05
SE 3 027 688 162 312 87 400 880 1.01
EU-15 134 947 618 1 751 382 7 017 400 17 935 0.26
Source: Eurostat (1998), European Commission (1998), Foster and Lampkin (1999) and own calculations.
One also needs to take into account that, in the case of a major expansion of organic farming, it would be false to assume an average increase in labour demand based on a linear projection of the current levels. Possibilities for increasing income by means of on-farm processing and direct marketing, which are one reason for the increase in labour demand, do not exist in all regions; moreover, such benefits will also decrease, as more farms in a region follow this trend.
3.2
Production structure
3.2.1
Land use
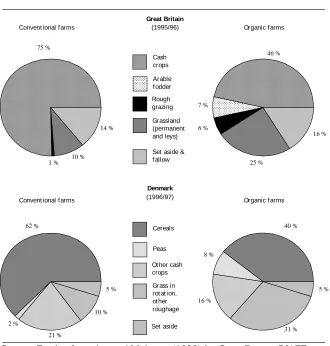
Figure 3-3: Land use of organic and comparable conventional arable farms in Denmark and Great Britain
Source: Fowler, Lampkin and Midmore (1998) for Great Britain; DIAFE (1998) for Denmark.
Great Britain (1995/96)
75 %
1 % 10 % 14 % 46 % 7 % 6 % 25 % 16 % 62 % 2 % 21 % 10 % 5 % 40 % 8 % 16 % 31 % 5 % Cash crops Arable f odder Rough grazing Grassland (permanent and leys)
Set aside & f allow
Denmark (1996/97)
Convent ional f arms Organic f arms
Peas
Ot her cash crops
Grass in rot at ion, ot her roughage
Set aside Cereals
Convent ional f arms Organic f arms
3.2.2
Stocking rates
A lower stocking rate on organic than on conventional farms seems likely, due to
the organic farming standards, which in many countries set an upper limit of two Livestock Units (LU) per ha UAA;
the striving to feed livestock with feed produced on the farm wherever possible, when at the same time forage yields are lower and purchases of feedstuffs are restricted;
[image:43.493.113.443.72.418.2]Table 3-4 gives an overview of the stocking rates in organic farms as a percentage of those on comparable conventional farms. On average, stocking rates are consistently lower on the organic farms. Still, a more differentiated analysis reveals that relative stocking rates are to a considerable degree dependent on the farm type. While the results for grazing cattle and dairy farms are quite similar to the average results in Table 3-4, arable farms often have a similar or higher stocking rate than comparable conventional farms; this is a consequence of strong ‘integrating forces’. On the other hand, pig (and large poultry) farms often face strong pressures to reduce livestock when converting to organic farming, resulting in significantly lower stocking rates than on conventional farms.
able 3-4 gives an overview of the stocking rates in organic farms as a percentage of those on comparable conventional farms. On average, stocking rates are consistently lower on the organic farms. Still, a more differentiated analysis reveals that relative stocking rates are to a considerable degree dependent on the farm type. While the results for grazing cattle and dairy farms are quite similar to the average results in Table 3-4, arable farms often have a similar or higher stocking rate than comparable conventional farms; this is a consequence of strong ‘integrating forces’. On the other hand, pig (and large poultry) farms often face strong pressures to reduce livestock when converting to organic farming, resulting in significantly lower stocking rates than on conventional farms.
Table 3-4: Stocking rates on organic farms relative to comparable conventional farms
Table 3-4: Stocking rates on organic farms relative to comparable conventional farms
GB NL FI DE CH DK AT
74 % 70 % 82 % 62 % 88 % 76 % 71 %
4
Comparative analysis of yields, prices and
costs in organic and conventional farming
4.1
Yields
Yield levels are an important determinant of the relative competitiveness of farming systems. Yields in organic farming are generally assumed to be lower than in conventional farming. The objective of the following paragraphs is to scrutinise this generality, and to quantify the yield differences with respect to products and countries.
The survey of literature and expert opinions was aimed at collecting data on yields both in organic farms and in field experiments, with a special focus on the collection of comparable conventional yields. To assess the
development of yields over time, an attempt was made to collect time series data.
A detailed overview of absolute yields is given in the literature review in Annex 1 and Annex 2, whereas this chapter will concentrate on yields relative to conventional yields.
4.1.1
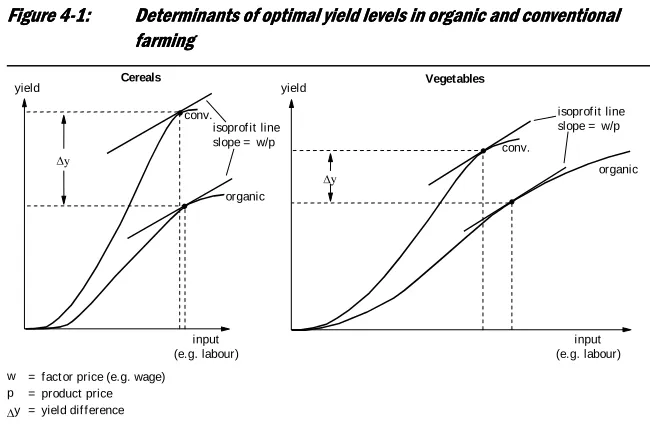
The determinants of yields in organic farming
While the absolute yield level is mainly determined by the same factors as in conventional farming, e.g. climate, crop rotation and soil quality for crop yields or breeds for livestock performance, the degree of influence is often very different. Typical such examples are crop rotation and stocking rate, which have a greater influence in organic than in conventional farming. Some yield-influencing factors, like the time under organic management, are specific to organic farming.
Thus, the relative difference of yields as compared to conventional management depends on a multitude of factors, particularly
the intensity of the prevailing conventional system (Padel and Lampkin 1994),
the intensity of the organic system,
the level of conventional yields (Piorr and Werner 1998),
the farm type,
the natural conditions, and