R E S E A R C H A R T I C L E
Open Access
Improving the quality of primary care by
allocating performance-based targets, in a
diverse insured population
Ronit Peled
1,2*, Avi Porath
3,4and Rachel Wilf-Miron
4,5Abstract
Background:Primary Care Health organizations, operating under universal coverage and a regulated package of benefits, compete mainly over quality of care. Monitoring, primary care clinical performance, has been repeatedly proven effective in improving the quality of care. In 2004, Maccabi Healthcare Services (MHS), the second largest Israeli HMO, launched its Performance Measurement System (PMS) based on clinical quality indicators. A unique module was built in the PMS to adjust for case mix while tailoring targets to the local units.
This article presents the concept and formulas developed to adjust targets to the units’current performance, and analyze change in clinical indicators over a six year period, between sub-population groups.
Methods:Six process and intermediate outcome indicators, representing screening for breast and colorectal cancer and care for patients with diabetes and cardiovascular disease, were selected and analyzed for change over time (2003–2009) in overall performance, as well as the difference between the lowest and the highest socio-economic ranks (SERs) and Arab and non-Arab members.
Results:MHS demonstrated a significant improvement in the selected indicators over the years. Performance of members from low SERs and Arabs improved to a greater extent, as compared to members from high ranks and non-Arabs, respectively.
Conclusion:The performance measurement system, with its module for tailoring of units' targets, served as a managerial vehicle for bridging existing gaps by allocating more resources to lower performing units. This concept was proven effective in improving performance while reducing disparities between diverse population groups.
Keywords:Public health, Quality improvement, Quality measurement, Quality indicators
Background
Healthcare organizations operating under universal cover-age, regulated prices and package of benefits compete mainly over quality of care and patient satisfaction [1, 2].
Monitoring clinical performance measures by large healthcare organizations has been repeatedly proven effective in improving the quality of care [3–6]. How-ever, measurement alone is insufficient for improving quality. The Veteran Affairs (VA), for example, devel-oped and maintained valid and cost-effective mea-sures, but still demonstrates considerable variability in
levels of performance across measures and facilities, sug-gesting the need for effective feedback to providers [7].
Achieving equity in health care is an important goal of most primary health care systems and reforms. Although primary health care plays an important role in improving health equity [8], international evidence shows that en-hancement of primary primary healthcare services for vulnerable individuals (e.g. low income, diverse racial and ethnic populations) critical but not enough for redu-cing health and health care inequities [9–11]. Measuring and monitoring equity in healthcare settings remain challenging mainly because current primary healthcare indicators and measures do not adequately reflect orga-nizations’ efforts to provide primary care services to groups most affected by structural inequities [12]. * Correspondence:[email protected]
1Department Health Systems Management, Faculty Health Sciences, Ben
Gurion University of the Negev, Beer Sheva 65321, Israel
2Peres Academy Center, Rehovot, Israel
Full list of author information is available at the end of the article
The VA has questioned the adequacy of their monitor-ing system usmonitor-ing a "treat to target" method, which focuses on attainment of specific risk factor thresholds, in achiev-ing control, in a diverse population. This concern has led the VA to develop a system that is based on “tightly linked”clinical action measures, in which the process spe-cified by the measure is strongly tied to the evidence. Spe-cifically, clinical action measures focus not only on the risk factor level but also give credit to the process [13]. In other healthcare systems, where performance is measured, a concern has been raised, that the results may account for differences in patient characteristics [14–16].
Research usually distinguishes between equality and equity in the provision of care and health outcomes: health equity is defined as the absence of systematic and potentially remediable differences in one or more char-acteristics of health across populations or population groups which are socially, economically, demographically or geographically defined [17]; whereas equality in health care means equal access, treatment and treatment out-comes for people of equal need [18]. These distinctions are important in developing equity-oriented indicators, given the widening inequities in health and social status.
The Israeli population is highly diverse. Twenty per-cent are Israeli Arabs who live mainly in rural settle-ments and mixed cities, and like all Israeli citizens, they are fully insured by the National Health Insurance Law under a universal care system. Eighteen percent of the Israeli population are considered "poor" with a 0.363 Gini Index for inequality in household income for 2013 [19]. Therefore, all Israeli health maintenance organizations (HMO) are challenged by this diversion, and are forced to invest in reducing inequalities and inequities.
This article has two objectives: 1) to describe the con-cept and implementation of a unique module, which ad-justs performance targets for current achievements, in order to compensate for different case mixes and
population diversion; and 2) to present an analysis of the effect of this concept on care quality and equity.
Setting
This study was initiated by Maccabi Healthcare Services (MHS), the second largest Israeli health plan (HMO), that provides primary and secondary community-based services to two million beneficiaries. These services are provided to diverse population groups country-wide, through five regions, divided into 150 branches (the basic administrative unit). Services are based on a core staff of 8,000 physicians, including 2,000 primary care physicians, 1,200 nurses and other health professionals. Physicians are normally self-employed who work in MHS' clinics or in their private clinics with seventeen million encounters (in 2013). In-patient care is pur-chased by the MHS from local medical centers.
Nine percent of MHS members are categorized in the lowest quartile of socioeconomic status, while 25.6% are in the upper quartile. Seven percent of MHS members are Israeli Arabs who are entitle for a full healthcare coverage.
Performance Measurement System (PMS)
In 2004 MHS launched a Performance Measurement Sys-tem (PMS), aiming to improve quality of care by monitor-ing and internally reportmonitor-ing on clinical performance. Twenty-five process and intermediate outcome indicators represented six clinical domains: early detection of cancer (colon and breast); influenza and pneumococcal vaccin-ation; early detection of risk factors and treatment for cardio-vascular diseases; diabetes care; diagnosis and treat-ment of depression; and appropriate use of antibiotics.
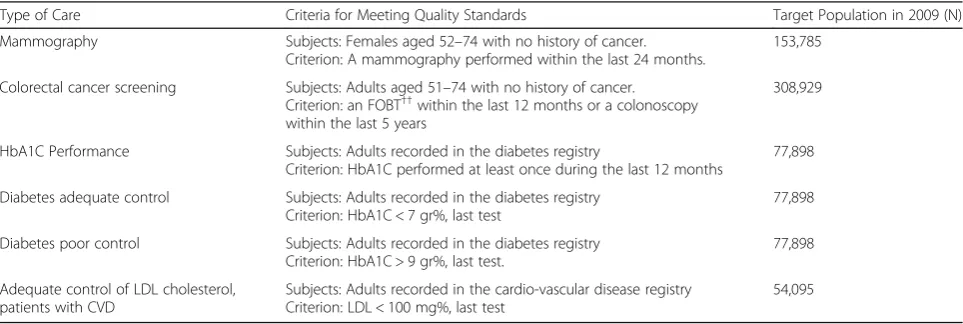
[image:2.595.57.539.562.724.2]Each indicator definition was based on the National Program for Quality Indicators in Community Health-care's definitions [20], which in turn was based on the Healthcare Effectiveness Data and Information Set (HEDIS) indicator set [3]. Indicators’ definitions are pre-sented in Table 1. A steering committee consisted on:
Table 1Selected quality indicators and target populations*
Type of Care Criteria for Meeting Quality Standards Target Population in 2009 (N)
Mammography Subjects: Females aged 52–74 with no history of cancer. Criterion: A mammography performed within the last 24 months.
153,785
Colorectal cancer screening Subjects: Adults aged 51–74 with no history of cancer. Criterion: an FOBT††within the last 12 months or a colonoscopy within the last 5 years
308,929
HbA1C Performance Subjects: Adults recorded in the diabetes registry
Criterion: HbA1C performed at least once during the last 12 months
77,898
Diabetes adequate control Subjects: Adults recorded in the diabetes registry Criterion: HbA1C < 7 gr%, last test
77,898
Diabetes poor control Subjects: Adults recorded in the diabetes registry Criterion: HbA1C > 9 gr%, last test.
77,898
Adequate control of LDL cholesterol, patients with CVD
Subjects: Adults recorded in the cardio-vascular disease registry Criterion: LDL < 100 mg%, last test
54,095
*
physicians; IT experts; central and regional quality man-agement representatives evaluated the definitions which were finally approved by the organizational chief executive officer (CEO) and chief medical officer (CMO).
The core of the PMS is a unique module, built into the system, which allows setting tailor-made benchmarks for each of MHS' administrative units (regions and branches). The system produces monthly reports, which are distributed in a transparent manner to local man-agers. The reports reflect each unit's gaps between achieved and desired targets.
Programming
MHS is a fully computerized healthcare organization: all diagnoses, prescriptions, diagnostic tests and billings are stored in a central data warehouse, from which the PMS retrieves information. A Microsoft Performance Point Server acts as a mediating platform supporting the inte-gration of data, reports and explanatory documents.
Setting units' tailor-made targets
The main objective of setting tailor-made targets, was to continually support and encourage the successful units but also to help and push, for better achievements, the weaker units.
For each clinical indicator, MHS has defined an upper benchmark ("ultimate goal"), which is the level of perform-ance MHS aims to achieve within a 3–5 year period. For every given year, an organizational target is set, based on prior progress towards the upper benchmark and an esti-mation of resources and capabilities. A unique mechanism helps to adjust a tailor-made unit target, taking into account the unit’s diverse member populations and their socio-economic; personal and social characteristics. Weighted unit's grades (UGs) for all indicators are calculated and contribute to the unit's "overall grade" for the purpose of recognition and modest reward. This was done as follows:
Step 1. Formulating an indicator factor (IF): Since each indicator demonstrates a different range of per-formance, we formulated a factor for each indicator (i), calculated yearly as follows:
IFi ¼ðMHS0annual target–end of previous year MHS performanceÞ MHS0ultimate goal−end of previous year performance
ð Þ
Step 2. Calculating the unit target, using the follow-ing formula for each clinical indicator:
UTi = IFi *(MHS' upper benchmark - the unit's last year† performance) + the unit's last year† performance († December 31).
Step 3. Calculating a Unit's Grades (UG)
UGi = (0.3 *% of achieving the upper benchmark) + (0.7 *% of achieving the tailor-made target). These
rates (30% and 70%) were assigned based on the idea to encourage excellence beyond the tailored targets.
For example: MHS's upper benchmark (for the next 3–5 years) for mammography screening was 80%; MHS' target for the upcoming year is assigned to 70%; MHS' end of last year performance was 60%.
Mammography IF¼ð70–60Þ ¼ 0:5 80–60
ð Þ
The unit's last year performance in Mammography screening was 50%
UT mammography¼ 0:5 80ð –50Þ þ 50 ¼ 65%
UG mammography¼ 0:3 65ð =80Þ þ 0:7 65ð =65Þ
¼ 0:94
Reports and rewards
Performance data at the branch (unit), region and organization levels were distributed monthly to all man-agers and caregivers. Quarterly and yearly reports ana-lyzed temporal trends and gaps in performance between units serving different sub-populations. These same ports were used to identify the need for process re-design, and to encourage the design of tailor-made local interventions [21].
Rewards were mainly based on organizational ac-knowledgements to managers who achieved higher scores. Every year, in an organizational managerial con-ference, these managers were publicly announced. There were no sanctions on those branches who did not meet the desired scores, however, there was a managerial pressure to improve performance.
Methods
Analyzing trends in clinical performance and between sub population groups
Measurements
In order to evaluate changes in performance over time, six indicators, for which definitions were not changed over time stable and each patient's data was fully re-corded, were selected: 1) mammography; 2) colorectal cancer screening; 3) HbA1C performance; 4) diabetes adequate control; and 5) diabetes poor control (Table 1). These indicators were compared for the years 2003–2009 and analyzed for members' socio-economic and ethnic characteristics (Israeli Arabs and Israeli non-Arabs).
Statistical methods
To assess the significance of the trends over time (2003–2009), we estimated linear regression models for curve fit for each of the selected indicators.
The Curve Estimation procedure generates a time variable in which the period of time between cases is uniform. If Time is selected, the dependent variable should be a time-series measure. Time-series analysis requires a data file structure, in which each case (row) represents a set of observations at different times, and the period of time between cases is uni-form [22].
Dependent variable:each indicator’s rate.
Independent Variable: Socio-Economic Rank (SER) and ethnicity: Israeli Arabs vs. non-Israeli Arabs
Socio-Economic Rank (SER) was defined by the rank (1–20 scale) of members' area of residence (based on Is-raeli Census Bureau data), and then categorized into the lowest (1–5) and highest (16–20) categories [23].
Ethnicity: Since Israeli HMOs do not have access to personal ethnicity data, Israeli Arabs were identified by the ethnicity of their residence as recorded in the Na-tional Census [23].
Results
The study population (2009) ranged between 153,785 mammography eligible women and 54,095 adults diag-nosed with cardiovascular disease (CVD) who were tar-geted for decreasing LDL cholesterol (Table 1).
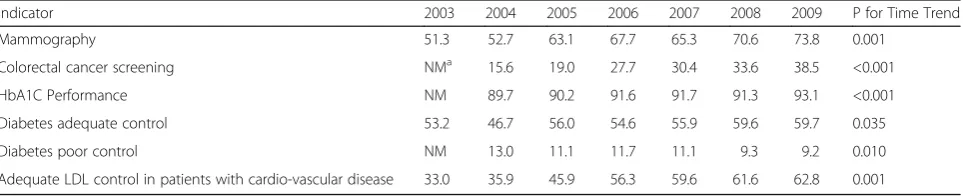
Overall organizational performance demonstrated con-siderable improvement over the years, which was statis-tically significant in all indicators except for adequate diabetes control (Table 2). The most considerable im-provement over time was demonstrated by colorectal screening (147% from 2004 to 2009) and adequate LDL control in patients with cardio-vascular disease (90% im-provement during the study period).
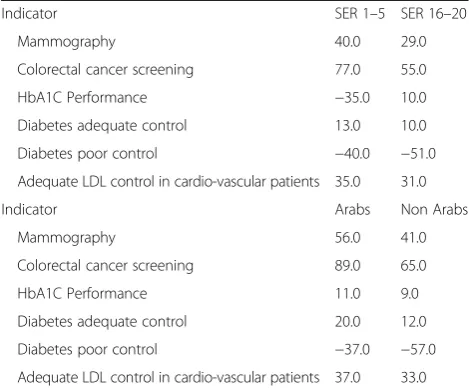
Performance of lowest SER members improved to a larger extent in comparison to members from highest SERs in all measures except for blood examination of HbA1C levels. As a group, members of Arab ethnicity achieved a larger relative improvement in comparison to non-Arab members (Table 3).
Discussion
The first objective of this article is to describe a unique module built-in the performance measurement system, for setting tailor-made targets per unit. The allocation of these targets intended to adjust for the current level of performance, which in turn reflected the case mix of the units, as well as their personal and social characteristics to improve care. By expect-ing units with lower levels of performance to achieve a larger absolute (and relative) improvement, the mes-sage to regional managers was a demand to allocate more resources to the weaker branches, in order to gradually close the gap. This in turn was transmitted to front-line caregivers. A request to provide special attention to less achieving units pushed the formula-tion of local soluformula-tions to overcome barriers that po-tentially prevented weaker populations from achieving optimal health outcomes. An example of such a pro-ductive local activity, supported by organizational in-frastructures, is the case of increasing breast cancer screening among Arab women [21]. The managerial demand for preferential allocation of resources to the weak units was effective in reducing some of the dis-parities in health measures. In fact, the module of tai-lored targets resulted in "lifting the floor rather than pushing up the ceiling". Putting more emphasis on the relative improvement of weaker units was also reflected, as allocated in the scoring formula, to a greater extent, to the units for achieving their tailor-made target - i.e., for making a greater relative improvement (0.7 of the score for each indicator). However, in order to praise excellence as well, high absolute performance was also rated, although to a lesser extent (0.3 of the score).
[image:4.595.58.540.626.724.2]The second objective of this article was to present ana-lysis of the effect of the above described concept, on care quality and equity. From the year 2003 to 2009, most of the selected quality indicators demonstrated a significant and steady improvement. Of special value is the finding that members who lived in low socioeconomic neighbor-hoods or in Arab settlements/local authorities achieved a relatively larger improvement, in comparison with members of higher socioeconomic groups or non-Arabs.
Table 2Performance rates (%) for Selected Clinical Indicators, 2003–2009
Indicator 2003 2004 2005 2006 2007 2008 2009 P for Time Trend
Mammography 51.3 52.7 63.1 67.7 65.3 70.6 73.8 0.001
Colorectal cancer screening NMa 15.6 19.0 27.7 30.4 33.6 38.5 <0.001
HbA1C Performance NM 89.7 90.2 91.6 91.7 91.3 93.1 <0.001
Diabetes adequate control 53.2 46.7 56.0 54.6 55.9 59.6 59.7 0.035
Diabetes poor control NM 13.0 11.1 11.7 11.1 9.3 9.2 0.010
Adequate LDL control in patients with cardio-vascular disease 33.0 35.9 45.9 56.3 59.6 61.6 62.8 0.001 a
Over the years, MHS has paid attention to and invested resources in care quality improvement. This was done by sending a clear managerial message, distrib-uted by the target-based measurement system. Transpar-ency of performance, frequent internal reporting and competition over recognition and modest rewards (add-itional budgets for social events for the unit's staff ), all contributed to a clear unequivocal organizational "voice". This message was facilitated by MHS' Quality Infra-structure, consisting of a central quality body, as well as multidisciplinary "quality teams" at the regional and branch levels. Teams were provided with training, tools and a framework for organizational learning from across units while implementing quality improvement initia-tives such as breast cancer prevention program among Arab women [21].
It should be noted that tailoring of targets is only one, and definitely not the sole mechanism, for improv-ing equity of health care and health outcomes. Experi-encing success in some reduction of disparities indeed created organizational discourse on equity and equality issues, and raised top managerial concern and belief that this might be feasible. From a long-term perspec-tive, implementation of the measurement system has made "quality" integral to the MHS organizational dis-course. This dialogue, supported by a set of validated data, has contributed a new "language". Terms like quality gap, data analysis, prioritization of domains for intervention, effective methods for improvement and reduction of health disparities have all helped create a new organizational culture within MHS. Medical direc-tors, as well as nonmedical administradirec-tors, all perceived quality improvement as a crucial element in their role definitions. Quality issues have consequently captured an increasing portion of the managerial dialogue
conducted with primary care physicians and other health professionals.
Performance measuring systems are used in many health organizations around the world. To illustrate, the American Veterans Affairs (VA) healthcare system, has undergone various transformations in an attempt to improve quality of care, including implementation of per-formance measurement, focusing on high-priority condi-tions such as diabetes and coronary artery disease. In earlier published studies, the VA reported a steady and sig-nificant increase in all the selected measures [24–27], in-cluding higher performance levels, when compared with non-VA settings [4, 27]. However, the VA reported that despite the improvement in quality of care, racial disparity persists for important Clinical Outcomes [27]. Our statis-tical analysis reveal that, disparities between sub popula-tion groups, in the presented clinical measurements, were reduced. It is for sure, that the way we weighed unit's per-formance and encouraged them to take bold steps and in-vest in intervention program, to close gaps, has to do with this reduction, although no statistical model could esti-mate for this unique formula as an independent variable.
Our positive statistical findings should take several limitations into consideration:
First: the lack of a control group. The PMS was initi-ated as an organizational system which covers all units. As a result, there are no units that can serve as a control group. What we can see, are the differences between units and subpopulation groups, in performance and intermediate outcomes, for which the tailored targets try to compensate and adjust.
Second, due to technical barriers such as the insuffi-cient timely flow of hospital data on health outcomes, we were limited to the use of process and intermediate outcomes to evaluate the quality of care provided to MHS members. The use of long-term outcome mea-sures, such as rate of amputations among diabetics or disease-related mortality, was precluded.
Third, most quality indicators are sensitive to pa-tient characteristics for their validity [28]. Israeli HMOs face legal constraints on the collection of se-lected types of personal socio-demographic data, such as income or ethnicity. We therefore used proxies, such as the rank of the geographic statistical index of the members' area of residence. And third, a de-sign of case control study would have provide a bet-ter understanding the association between the PMS and the health outcomes observed here. However, the Israeli healthcare system, which is universal insist, by law, on equity and equality. Thus, there is no way to provide unequal services just for the sake of the research.
[image:5.595.56.291.99.294.2]Fourth: we analyzed six indicators, for which the defi-nitions has not been changed over time and the patient's
Table 3Percent change, 2003 to 2009, by SER and ethnicity
Indicator SER 1–5 SER 16–20
Mammography 40.0 29.0
Colorectal cancer screening 77.0 55.0
HbA1C Performance −35.0 10.0
Diabetes adequate control 13.0 10.0
Diabetes poor control −40.0 −51.0
Adequate LDL control in cardio-vascular patients 35.0 31.0
Indicator Arabs Non Arabs
Mammography 56.0 41.0
Colorectal cancer screening 89.0 65.0
HbA1C Performance 11.0 9.0
Diabetes adequate control 20.0 12.0
Diabetes poor control −37.0 −57.0
information was fully recorded. These indicators do not necessary represent the other indicators.
Conclusion
The Performance Measurement System described in this article, with its unique built in formulas, adjusting for the relative level of performance, has a potential of serv-ing as a locomotive, pullserv-ing the quality system toward its goals. The concept of management by assigning tailor-made targets to healthcare services units and rewards for achieving those targets, proved effective in improving care, while reducing disparities.
Abbreviations
CEO:Chief executive officer; CMO: Chief medical office; CVD: Cardio-vascular disease; HEDIS: Healthcare effectiveness data and information set; HMO: Health maintenance organizations; IF: Indicator factor; MHS: Maccabi healthcare services; PMS: Performance measurement system; SERs: Socio-economic ranks; UGs: Weighted unit's grades; VA: The veteran affairs
Acknowledgement None.
Funding
The study was not funded by any means.
Availability of data and materials
The data supporting the study findings will not be shared since it's the organizational property. Data was anonymous and study subjects could not be identified.
Authors' contributions
PR: has made substantial contributions to conception, design, analysis and interpretation of data; PA: has been involved in drafting the manuscript and agreed to be accountable for all aspects of the work in ensuring that questions related to the accuracy or integrity of any part of the work are appropriately investigated and resolved. WMR: has been involved in drafting the manuscript or revising it critically for important intellectual content. All authors read and approved the final manuscript.
Competing interests
The authors declare that they have no competing interests.
Consent for publication
“Not applicable”.
Ethics approval and consent to participate
This study did not required any ethical approval since we analyzed data acquired by the MHS's Quality Management Dept. and was used for the routine organizational reporting. Data was acquired due to the permission of MHS's Chief Executive Officer and the Chief Medical Officer, who headed and guided the quality process described in this article and elsewhere [21].
Author details
1Department Health Systems Management, Faculty Health Sciences, Ben
Gurion University of the Negev, Beer Sheva 65321, Israel.2Peres Academy
Center, Rehovot, Israel.3Department of Epidemiology, Faculty of Health Sciences, Ben Gurion University of the Negev, Beer Sheva, Israel.4The Gertner
Institute for Epidemiology and Health Policy Research, Tel Aviv, Israel.5The
School of Public Health, Sackler Faculty of Medicine, Tel Aviv University, Tel Aviv, Israel.
Received: 2 October 2015 Accepted: 11 November 2016
References
1. Shmueli A, Chernichovsky D, Zmora I. Risk Adjustment and Risk Sharing: The Israeli Experience. Health Policy. 2003;65(1):37–48.
2. Rosen B, Kanel K. Healthcare in the US and Israel: comparative overview. Jerusalem and Pittsburgh (PA): Myers-JDC-Brookdale Institute and Jewish Healthcare Foundation; 2010 S-130-10. Available at: http://brookdale.jdc.org. il/?CategoryID=192&ArticleID=220. Accessed Nov 2016.
3. NCQA 2009 Available at: http://www.ncqa.org/Portals/0/HEDISQM/ HEDIS2010/2010_Measures.pdf. Accessed Nov 2016.
4. Shekelle PG, Asch S, Glassman P, Matula S, Trivedi A, Miake-Lye I. Comparison of quality of care in VA and Non-VA settings: a systematic review [Internet]. Washington (DC): Department of Veterans Affairs (US); 2010. VA Evidence-based Synthesis Program Reports. Available at: https:// www.ncbi.nlm.nih.gov/pubmedhealth/PMH0068216/. Accessed Nov 2016. 5. Le Grand J. Further tales from the British National Health Service. Health
Affairs. 2002;21:116–28.
6. Hall J. Incremental Change in the Australian health care system. Health Affairs. 1999;18:95–110.
7. Hysong SJ, Teal CR, Khan MJ, Haidet P. Improving quality of care through improved audit and feedback. Implement Sci. 2012;7:45.
8. World Health Organization. The world health report 2008: Primary health care now more than ever. Geneva: World Health Organization; 2008. Available: http://www.who.int/whr/2008/whr08_en.pdf.
9. Starfield B. State of the art in research on equity in health. J Health Polit Policy Law. 2006;31:11–32.
10. Kringos DS, Boerma WGW, Hutchinson A, et al. The breadth of primary care: A systematic literature review of its core dimensions. BMC Health Serv Res. 2010;10:65. doi:10.1186/1472-6963-10-65.
11. Browne AJ, Varcoe CM, Wong ST, et al. Closing the health equity gap: evidence-based strategies for primary health care organizations. Int J Equity Health. 2012;11:59. doi:10.1186/1475-9276-11-59.
12. Wong ST, Browne AJ, Varcoe C, et al. Enhancing measurement of primary health care indicators using an equity lens: An ethnographic study. Int J Equity Heal. 2011;10:138. doi:10.1186/1475-9276-10-38.
13. Kerr EA, Lucatorto MA, Holleman R, et al. Monitoring Performance for Blood Pressure Management Among Patients With Diabetes MellitusToo Much of a Good Thing? Arch Intern Med. 2012;172(12):938–45.
14. Hofer TP, Hayward RA, Greenfield S, et al. The unreliability of individual physician“report cards”for assessing the costs and quality of care of a chronic disease. JAMA. 1999;281:2098–105.
15. Zhang Q, Safford M, Ottenweller J, et al. Performance status of health care facilities changes with risk adjustment of HbA1c. Diabetes Care. 2000;23:919–27. 16. Kerr EA, Gerzoff RB, Krein SL, et al. Diabetes care quality in the Veterans
Affairs Health Care System and commercial managed care: the TRIAD study. Ann Intern Med. 2004;141:272–81.
17. Stewart AL, Napoles-Springer. Advancing health disparities research: can we afford to ignore measurement issues? Med Care. 2003;41:1207–20. 18. Boeckxstaens P, De Smedt D, De Maeseneer J, et al. The equity dimension
in evaluations of the quality and outcomes framework: A systematic review. BMC Health Serv Res. 2011;11:209. doi:10.1186/1472-6963-11-209. 19. Ministry of Health. 2014. (Hebrew) Available at: http://www.health.gov.il/
PublicationsFiles/inequality-2014.pdf. Accessed Nov 2016.
20. Jaffe DH, Shmueli A, Ben-Yehuda A, Paltiel O, Calderon R, Cohen AD, Matz E, Rosenblum JK, Rachel Wilf-Miron R, Manor O. Community healthcare in Israel: Quality indicators 2007–2009. Isr J Health Policy Res. 2012;1:3–12. 21. Wilf-Miron R, Galai N, Gabali A, et al. Organizational efforts to improve quality
while reducing healthcare disparities: the case of breast cancer screening among Arab women in Israel. Qual Saf Health Care. 2010;19(5):e36. 22. SPSS 20: http://127.0.0.1:59597/help/index.jsp?topic=%2Fcom.ibm.spss.
statistics.help%2Fspss%2Fbase%2Fovervw_auto_0.htm. Accessed Nov 2016. 23. Central Bureau of Statistics. Available at: http://www.cbs.gov.il/reader/
?MIval=cw_usr_view_SHTML&ID=705. Accessed Nov 2016.
24. Jha AK, Perlin JB, Kizer KW, et al. Effect of the transformation of the Veterans Affairs Health Care System on the quality of care. N Engl J Med. 2003;348(22):2218–27. 25. Perlin JB, Kolodner RM, Roswell RH. The Veterans Health Administration:
quality, value, accountability, and information as transforming strategies for patient-centered care. Am J Manag Care. 2004;10:828–36.
26. Oliver A. The Veterans Health Administration: An American Success Story? Milbank Q. 2007;85:5–35.
27. Trivedi AN, Grebla RC. Quality and equity of care in the veterans affairs health-care system and in medicare advantage health plans. Med Care. 2011;49(6):560–8.