RESEARCH ARTICLE
Transmembrane transporter expression
regulated by the glucosylceramide pathway
in
Cryptococcus neoformans
Arpita Singh
1,2*†, Antonella Rella
1,3†, John Schwacke
1,4, Caterina Vacchi‑Suzzi
9, Chiara Luberto
1,5and Maurizio Del Poeta
1,3,6,7,8*Abstract
Background: The sphingolipid glucosylceramide (GlcCer) and factors involved in the fungal GlcCer pathways were shown earlier to be an integral part of fungal virulence, especially in fungal replication at 37 °C, in neutral/alkaline pH and 5 % CO2 environments (e.g. alveolar spaces). Two mutants, ∆gcs1 lacking glucosylceramide synthase 1 gene (GCS1) which catalyzes the formation of sphingolipid GlcCer from the C9‑methyl ceramide and ∆smt1 lacking sphin‑ golipid C9 methyltransferase gene (SMT1), which adds a methyl group to position nine of the sphingosine back‑ bone of ceramide, of this pathway were attenuated in virulence and have a growth defect at the above‑mentioned conditions. These mutants with either no or structurally modified GlcCer located on the cell‑membrane have reduced membrane rigidity, which may have altered not only the physical location of membrane proteins but also their expression, as the pathogen’s mode of adaptation to changing need. Importantly, pathogens are known to adapt themselves to the changing host environments by altering their patterns of gene expression.
Results: By transcriptional analysis of gene expression, we identified six genes whose expression was changed from their wild‑type counterpart grown in the same conditions, i.e. they became either down regulated or up regulated in these two mutants. The microarray data was validated by real‑time PCR, which confirmed their fold change in gene expression. All the six genes we identified, viz siderochrome‑iron transporter (CNAG_02083), monosaccharide transporter (CNAG_05340), glucose transporter (CNAG_03772), membrane protein (CNAG_03912), membrane transport protein (CNAG_00539), and sugar transporter (CNAG_06963), are membrane‑localized and have significantly altered gene expression levels. Therefore, we hypothesize that these genes function either independently or in tandem with a structurally modified cell wall/plasma membrane resulting from the modifications of the GlcCer pathway and thus possibly disrupt transmembrane signaling complex, which in turn contributes to cryptococcal osmotic, pH, ion homeostasis and its pathobiology.
Conclusion: Six genes identified from gene expression microarrays by gene set enrichment analysis and validated by RT‑PCR, are membrane located and associated with the growth defect at neutral‑alkaline pH due to the absence and or presence of a structurally modified GlcCer. They may be involved in the transmembrane signaling network in Cryptococcus neoformans, and therefore the pathobiology of the fungus in these conditions.
Keywords: Microarray, Gene expression analyses, Gene‑set enrichment, Transmembrane transporter, Glucosylceramide, Methylation
© 2015 Singh et al. This article is distributed under the terms of the Creative Commons Attribution 4.0 International License (http://creativecommons.org/licenses/by/4.0/), which permits unrestricted use, distribution, and reproduction in any medium, provided you give appropriate credit to the original author(s) and the source, provide a link to the Creative Commons license, and indicate if changes were made. The Creative Commons Public Domain Dedication waiver (http://creativecommons.org/ publicdomain/zero/1.0/) applies to the data made available in this article, unless otherwise stated.
Open Access
*Correspondence: arpitamanu@gmail.com; maurizio.delpoeta@ stonybrook.edu
†Arpita Singh and Antonella Rella contributed equally to this work 2 Present Address: Department of Medicine, Division of Infectious Diseases and International Health, University of Virginia, 345 Crispell Dr, Carter Harrison Building, Charlottesville, VA 22908, USA
Background
Cryptococcal meningitis is a leading cause of death in HIV patients [1]. It is caused by Cryptococcus neofor-mans (Cn), an environmental fungus commonly found in pigeon droppings and eucalyptus trees. Though it is com-monly known for its ability to cause disease in immuno-compromised individuals, it has recently been recognized as a causative agent of infection in immunocompetent individuals too [2, 3]. Amongst the fungal virulence fac-tors identified, the most important are their ability to survive in the host environments (acid-neutral-alkaline pH, 37 °C, 5 % CO2), capsule formation, urease and mela-nin production (Reviewed in [4]).
Earlier reports had shown that the synthesis of fun-gal sphingolipids regulates the ability of the fungus to replicate in the host environments [5–7]. In particular, studies in two mutants (∆gcs1 and ∆smt1) in the gluco-sylceramide (GlcCer) pathway, lacking glucogluco-sylceramide synthase 1 and C9 sphingolipid methyltransferase 1 gene respectively, had shown that these genes are essential for the fungus to replicate in neutral-alkaline pH, 37 °C, 5 % CO2 (the physiological conditions found in the alveolar microenvironment). Upon intranasal injection, these mutants do not replicate in the lung and, thus, they are not pathogenic in a mouse model of cryptococcal men-ingitis [6, 8, 9]. Both Δgcs1 and Δsmt1 mutants do not migrate from the lung to the brain because they are trapped in a lung granuloma.
In addition to be required for pathogenicity of Cn, the GlcCer pathway is also essential for the pathogenesis of other human pathogens, such as Candida albicans [10– 12] and Aspergillus fumigatus [13], and to plant patho-gens, such as Fusarium graminearum [14]. Furthermore, the synthesis of GlcCer seems to be important during
Pneumocystis pneumonia (PCP) as GlcCer synthase
transcripts have been found to be abundant at the time of isolation of the fungus from fulminate lung infection [15], and for infection caused by dimorphic fungi, as Glc-Cer is detected only in the lung infective form (yeast) and not in the environmental form (mold) [16–18]. Taken together, these studies suggest that the GlcCer pathway is most likely a pan-fungal virulence pathway required in promoting fungal replication at 37 °C, in neutral/alka-line pH and 5 % CO2 environments (e.g. alveolar spaces), reviewed in [19].
GlcCer is a sphingolipid localized in cell membranes (mainly cell wall and plasma membranes) of Cn [20]. Structural studies had proposed the hypothesis that an alteration in the membrane lipid structure may result in an altered raft formation, thus affecting fungal mem-brane fluidity and rigidity [21, 22]. Thus given its specific location and function in promoting fungal cell replica-tion in neutral-alkaline pH, 37 °C, and 5 % CO2, GlcCer
may be involved, either directly or indirectly in anchoring specific membrane proteins essential for transferring key nutrients across the membranes necessary for cell cycle progression.
Upon inhalation of fungal cells into the lung, Cn will have to adapt and respond to a new temperature, a new pH and to a new concentration of CO2. Several studies have highlighted fungal responses to the 37 °C tempera-ture [23], pH [24–26] and to CO2 [27]. These studies suggested that replication of Cn in these microenviron-ments requires maintenance of pH gradients across mul-tiple membrane systems, regulation of inorganic carbon uptake and, most importantly, adjustment to changes in the abundances of different ions. In fact, transmembrane signaling complex have the potential to contribute to osmotic, pH and ion homeostasis [25, 26, 28]. Addition-ally the physical structure of the plasma membrane can also change upon cell exposure to a different environ-ment [29, 30], resulting in activation, down-regulation or dislocation of transmembrane transporters. This hypoth-esis is supported by studies suggesting that a proper ratio of membrane sphingolipids and sterols is necessary to sustain the hydrophobicity of a transmembrane domain of certain channels regulating the transmembrane poten-tial [31–33]. Thus, a change in the membrane framework occurring due to the changes in the composition and/or structure of membrane sphingolipids as reported earlier [9], could result in an alteration of membrane-spanning channels in these mutants.
In this study, we performed a transcriptional analysis of C. neoformans wild type, ∆gcs1 and ∆smt1 mutants grown at 37 °C, 5 % CO2 at either pH 4.0 or 7.2 ± 0.2. We then analyzed their gene expression profiles, focus-ing only on genes whose expression was significantly changed at pH 7.2 ± 0.2 versus pH 4.0 in both ∆gcs1 and ∆smt1 mutants but not in C. neoformans wild type and found six genes, all encoding for transmembrane trans-porters. Quantitative real-time PCR (RT-PCR) was used to confirm the changes in expression of these six genes found by the microarray studies.
Methods
Strains and media
were used as conditioned media for growing C. neofor-mans strains at 37 °C in presence of 5 % CO2.
RNA isolation
Overnight YPD grown cultures of WT, ∆gcs1 and ∆smt1
mutant strain, were pelleted, washed twice with ster-ile Phosphate Buffered Saline (PBS) and inoculated in DMEM high glucose, buffered with 50 mM HEPES, containing 10 % Fetal Bovine Serum, 1 M sorbitol at pH 7.2 or pH 4 and shaken-incubated for 20 h at 37 °C, 5 % CO2. The cells were harvested by centrifugation at 5000g for 10 min and washed twice with PBS. The cell-pellets were flash-frozen in dry-ice/ethanol bath and stored at
−80 °C until ready to use. Total RNA was extracted from
Cn strains, as described previously [34]. Briefly, the cells were lyophilized overnight and 100 µl of lyophilized cells were transferred in 2 ml screw cap tubes and 1.25 ml of TRI reagent (Molecular Research Center, Inc.) was added. After homogenization, using Bead Beater 16, the tubes were incubated at room temperature for 10 min and centrifuged at 8000g to pellet cell debris and unbro-ken cells. The supernatants were transferred in fresh tubes along with 60 µl of BAN phase separation reagent (Molecular Research Center, Inc., Cincinnati, OH, USA). After mixing for 20–30 s and incubating at room tem-perature for 5 min, samples were centrifuged at 8000g. The aqueous phases were placed in fresh tubes along with 70 % ethanol, and loaded onto RNeasy isolation columns provided by RNeasy Mini Kit (Qiagen, CA, USA). Total RNA was further purified and eluted according to manu-facturer’s instructions. Total RNA integrity was verified by Agilent 2100 Bioanalyzer (Agilent, Santa Clara, CA, USA). Concentration and sample purity were determined by Nanodrop ND-1000 (Nanodrop, DE, USA). Samples with 260/280 < 1.8, 260/230 < 1.8 were column purified and re-quantitated.
Microarray experiment
Global gene expression changes due to different pH con-ditions during growth were assessed for WT, ∆gcs1 and ∆smt1 mutant strains on dual-channel Cy3-Cy5 Cryp-tococcus neoformans H99 Agilent microarray (Agilent, Santa Clara, CA, USA). The array design is available on GEO (platform accession number GPL13419). Micro-array analysis was carried out at MOgene, LC (Saint Louis, MO, USA). Total RNA (1 µg) was direct labeled using Kreatech ULS, a RNA Labeling Kit for dual-color hybridization. WT control strain grown at pH 4.0 were labeled with Cy3 (green channel) and the mutants or WT grown at 7.2 ± 0.2 pH labeled with Cy5 (red channel). Concentrations and dye incorporation data (Cy3: 100– 130 pmol/µg, Cy5: 70–100 pmol/µg) were determined by Nanodrop. After labeling, 300 ng of each sample were
fragmented and hybridized to an Agilent custom anti-sense probe 8 × 15 K microarray (AMADID 019465) by manufacturer’s specifications with the following excep-tion: 5 µl of Kreablock (included in the labeling kit) was added after fragmentation. Hybridization was carried out in a SureHyb chamber in an Agilent hybridization oven at 65 °C and 10 rpm for 17 h. Slides were washed using Agi-lent GE wash buffers and scanned on an AgiAgi-lent C scan-ner at 5 µM. Data was extracted using Agilent Feature Extraction v. 10.7.1 software. The normalization method used for data extraction was Linear-Lowess. Raw data were expressed as Lowess-normalized log2 ratio (test/ reference).
Experiments involving 15 microarrays for 5 condi-tions, conducted in triplicate, were used to compare WT to mutant expression at pH 4 and pH 7.2 ± 0.2. Entries in the associated data files included accession number, sequence description, and two intensity measurements, along with fold change estimate, and associated p value. Image processing, normalization, intensity estimation, and probe-level significance calculations were performed prior to this effort and data was taken from the files with-out additional processing.
Quantitative real time PCR
CTTCTAC-3′, reverse: 5′-ATAGCCAAAACCCTCCAT CC-3′; CNAG_00092 (Mitochondrial-protein), forward: 5′-GACCCAAGACCATCTTCTTCT-3′, reverse: 5′-GCA GCGAGGGAGTAGTTGAC-3′; CNAG_01307 (Endoplas-mic-reticulum-protein), forward: 5′-AGCGAAACTTGTA CTTGACAGG-3′, reverse: 5′-GCCATACTCGGCATTCT GTT-3′; CNAG_01150 (δ-12-fatty-acid-desaturase), for-ward: 5′-CCTTGGCAGGTTCTCTCTTTCT-3′, reverse: 5′-GCGTTGTTGATGGCCTTACT-3′. The amplification reactions consisted of 1 cycle of 3 min at 95 °C, 40 cycles of 10 s at 95 °C and 45 s at 55 °C, one cycle of 1 min at 95 °C, one cycle of 1 min at 55 °C and 78 cycles of 10 s at 55 °C. The results were normalized to an internal control gene, actin. Primer sequence was as follows: CNAG_00483 (Actin), forward: 5′-ACATGTCTATGGAAGAAGAAGT CG-3′ reverse: 5′-ATACCGTGCTCAATGGGGTA-3′. The real-time PCR results were analyzed using Q-Gene® soft-ware, which expresses data as the means of normalized expression.
Results
Microarray data analysis
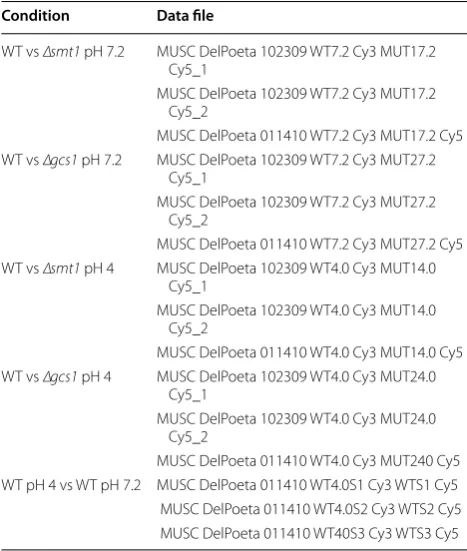
The conditions and file names for this data are given below in Table 1. All data is MIAME compliant and the raw data has been deposited in a MIAME compliant database with
a GEO accession number GSE69361, a full description and complete data sets are available at (http://www.ncbi. nlm.nih.gov/geo/query/acc.cgi?acc=GSE69361).
In this effort we seek to identify groups of genes that are differentially regulated with patterns that correlate with the differential replication rates of the Cn WT and mutant strains. Earlier efforts indicated similar growth rates for the WT and ∆gcs1 or ∆smt1 mutants at pH 4, but with significantly reduced replication rate for the mutants, but not the WT, at neutral-alkaline pH. Thus, we focused on the analysis of gene expression profiles that would be associated with the pH phenotype. The Cn
genome was acquired from the Cryptococcus grubii H99 Database (http://www.broadinstitute.org/annotation/ genome/cryptococcus_neoformans/MultiHome.html). Descriptions and PFAM identifiers for each probe on the array were extracted from the genome information file after mapping probe accession numbers to locus identifi-ers. Each probe was further annotated using Gene Ontol-ogy (GO) terms taken from the PFAM2GO mapping. Of the 6931 probes, 3338 were annotated with one or more GO terms. This subset and the associated GO terms became the basis for our gene set enrichment analysis. For gene selection and or identification, signature pattern together with regression based methods were used.
Method 1—signature patterns
A gene is declared a signature gene within a microarray experiment if its fold changes p-value fall below 0.01. Furthermore, a gene is declared a signature gene for a specific condition if it was found to be a signature gene in all replicates of experiments for that condition. Finally, a gene is considered a signature gene for a pattern of conditions if that gene is a signature gene for all condi-tions within the pattern and not a signature gene for any other conditions. Genes, therefore, are mapped into 1 of 16 possible patterns arising from the 4 comparisons (WT vs ∆smt1 at pH 4, WT vs ∆smt1 at pH 7.2 ± 0.2, WT vs
∆gcs1 at pH 4, WT vs ∆gcs1 at pH 7.2 ± 0.2). For each pattern, gene set enrichment analysis was conducted. Of particular interest in this study are genes that are differ-entially expressed at pH neutral-alkaline pH but not at acidic pH, in both the mutants.
Method 2—regression
Concerned that signature gene selection criteria of Method 1 might be too restrictive, a regression-based analysis was also conducted. Observed log intensities are assumed to follow a linear model including array, pH, mutant, and gene effects and gene-pH, gene-mutant and gene-pH-mutant interactions. The regression model is given as
(1)
[image:4.595.56.290.450.726.2]log(Ii,j,k)=ai+pj+mk+gl+αl,j+βl,k+γl,j,k
Table 1 Growth conditions of C. neoformans wild-type (WT) ∆gcs1 and ∆smt1 and corresponding microarray data file
Condition Data file
WT vs ∆smt1 pH 7.2 MUSC DelPoeta 102309 WT7.2 Cy3 MUT17.2 Cy5_1
MUSC DelPoeta 102309 WT7.2 Cy3 MUT17.2 Cy5_2
MUSC DelPoeta 011410 WT7.2 Cy3 MUT17.2 Cy5 WT vs ∆gcs1 pH 7.2 MUSC DelPoeta 102309 WT7.2 Cy3 MUT27.2
Cy5_1
MUSC DelPoeta 102309 WT7.2 Cy3 MUT27.2 Cy5_2
MUSC DelPoeta 011410 WT7.2 Cy3 MUT27.2 Cy5 WT vs ∆smt1 pH 4 MUSC DelPoeta 102309 WT4.0 Cy3 MUT14.0
Cy5_1
MUSC DelPoeta 102309 WT4.0 Cy3 MUT14.0 Cy5_2
MUSC DelPoeta 011410 WT4.0 Cy3 MUT14.0 Cy5 WT vs ∆gcs1 pH 4 MUSC DelPoeta 102309 WT4.0 Cy3 MUT24.0
Cy5_1
MUSC DelPoeta 102309 WT4.0 Cy3 MUT24.0 Cy5_2
with Intensity Ii,j,k, effects for Array αi, pH pj, Mutant
mk, and Gene gl and interactions αl,j, βl,k, and γl,j,k. The
model was fit using Least Absolute Shrinkage and Selec-tion Operator (LASSO) as implemented in the R glm-net package [36] and the regression penalty parameter was chosen via cross-validation. Genes having non-zero gene-pH-mutant interactions for both mutants with effects in the same direction (coefficients having the same sign) were then selected for gene set enrichment analysis.
Gene set enrichment analysis
For genes mapped to each of the patterns under Method 1 (signature patterns) and for the selected genes from Method 2 (regression), gene set enrichment analysis was performed. Only genes within the subset of 3338 and, thus, annotated with GO terms were used in this analy-sis. Enrichment of GO-terms appearing within these groups of selected genes was assessed using the R topGO package version 1.16.0 [36] using the “classic” algorithm and “fisher” statistic. GO terms with p < 0.01 were con-sidered significant.
A subset of six genes of interest, selected based on evidence of differential expression in the microar-ray studies and labeled with GO terms found to be significant in our gene set enrichment analysis, were analyzed further using qRT-PCR. Based on minimal differential expression across conditions and high sig-nal levels, five additiosig-nal genes were selected using the microarray data and were used as a reference. The collection of these 11 genes was subjected to RT-PCR for WT and mutants at pH 4 and pH 7.2 ± 0.2 (6 cases).
The relationship between observed cycle time at threshold, CT, was assumed to be related to initial amount, A, the negative inverse of the log amplification efficiency, S, and the intercept of the linear approxima-tion, I through the following expression.
The reference amount against which all experiments were normalized was taken from the average of the log amounts of the five reference genes. As such, the log nor-malized expression for gene ‘g’ in strain ‘s’ under experi-mental condition ‘e’ (pH) is given by
where the summation is over the five reference genes and Aref,e,g is the average log amount of the reference genes. Of interest in this analysis are the four ratios comparable to the microarray experiments.
(2)
CT =S ×log(A) +I
(3) log(Ns,e,g)=log
As,e,g
Aref,e,g
= 1
S
CTs,e,g− 1 5
CTs,e,r
The model parameters S and I, the relative expressions for each experiment Ns, e,g and the ratios of interest Rg, were inferred using methods from the Bayesian sta-tistical framework [37]. Inferences were accomplished using JAGS (3.1.0) [38] through the rjags package (3.10) [39] [40] within R. All inferences were executed in a sin-gle step and CT measurements were assumed to share a common precision prior. A model burn-in of 50,000 sam-ples preceded collection of 50,000 samsam-ples from which posterior credible intervals were determined.
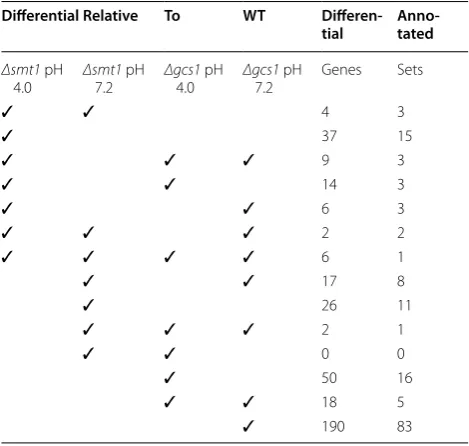
A total of 381 genes were identified as signature genes in one or more of the conditions and 14 of the 16 pos-sible signature patterns were associated with one or more signature genes (Table 2). All the genes mapped to their signature patterns were listed in additional file 1 DOI “10.6070/H48050MW“ at https://mynotebook. labarchives.com/share/Microarray/MjAuOHw5N- DUwMy8xNi9UcmVlTm9kZS81ODE1Nzk3NTd8N-TIuOA==. Of those 14 cases, 3 cases were found to have GO terms that were significantly enriched at the
p < 0.01 levels. These include (1) only WT vs ∆smt1 at pH 4, (2) only WT vs ∆smt1 at pH 7.2 ± 0.2 and WT vs ∆gcs1 at pH 7.2 ± 0.2, and (3) only WT vs ∆gcs1 at pH 7.2 ± 0.2. In case 1, significant GO terms were associated (4)
Rg,1=exp
log
N∆smt1,4,g
−log
NWT,4,g
Rg,2=exp
log
N∆gcs1,4,g−log
NWT,4,g Rg,3=exp
log
N∆smt1,7,g
−log
NWT,7,g
Rg,4=exp
log
N∆gcs1,7,g
−log
NWT,7,g
[image:5.595.304.539.504.727.2]
Table 2 Signature patterns and number of genes identi-fied in the experimental conditions
Differential Relative To WT Differen-tial Anno-tated
Δsmt1 pH
4.0 Δsmt17.2 pH Δgcs14.0 pH Δgcs17.2 pH Genes Sets
✓ ✓ 4 3
✓ 37 15
✓ ✓ ✓ 9 3
✓ ✓ 14 3
✓ ✓ 6 3
✓ ✓ ✓ 2 2
✓ ✓ ✓ ✓ 6 1
✓ ✓ 17 8
✓ 26 11
✓ ✓ ✓ 2 1
✓ ✓ 0 0
✓ 50 16
✓ ✓ 18 5
with cellular lipid metabolism and included GO:0006650 glycerophospholipid metabolic process (p = 0.0022), GO:0030384 phosphoinositide metabolic process (p = 0.0022), GO:0046486 glycerolipid metabolic pro-cess (p = 0.0022), GO:0006644 phospholipid metabolic process (p = 0.0063), and GO:0019637 organophosphate metabolic process (p = 0.0073) and in case 3 signifi-cant terms included GO:0055114 oxidation reduction (p = 0.0016) and GO:0055085 transmembrane transport (p = 0.0025). Case 2, the case of greatest interest in this analysis, only GO:0055085 transmembrane transport (p = 0.0092) appeared significant with 4 of the 8 differen-tially expressed and annotated genes being labeled with this GO term.
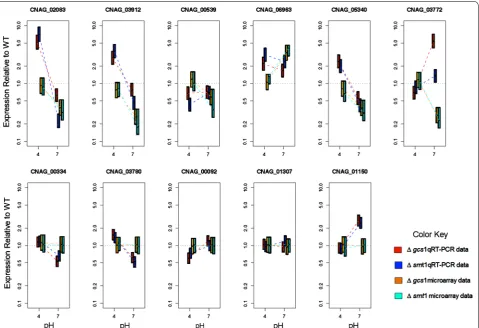
The regression-based analysis yielded similar find-ings. A total of 207 genes were found to have non-zero gene-pH-mutant interactions where the estimated coef-ficients were in the same direction for both mutants. Applying gene set enrichment analysis to the annotated subset of these genes identified 7 significantly enriched GO terms including GO:0055085 transmembrane transport (p = 3.3 × 10⁻⁵), GO:0055114 oxidation reduction (p = 0.00013) GO:0032787 monocarbox-ylic acid metabolic process (p = 0.00365), GO:0006810 transport (p = 0.00441), GO:0051234 establishment of localization (p = 0.00441), GO:0051179 localiza-tion (p = 0.00527), and GO:0008610 lipid biosynthetic process (p = 0.00574). Based on the results from both the signature and regression analyses, we selected 6 genes that were differentially expressed and labeled with GO:0055085 (transmembrane transport) includ-ing siderochrome-iron transporter (CNAG_02083), monosaccharide transporter (CNAG_05340), glu-cose transporter (CNAG_03772), membrane pro-tein (CNAG_03912), membrane transport propro-tein (CNAG_00539), and sugar transporter (CNAG_06963). The products of these genes are all part of the major facilitator superfamily (MFS) (PFAM PF07690.8) which are secondary carriers transporting small solutes in response to chemiosmotic ion gradients. As further confirmation of these findings, the set of six genes were analyzed by q-RTPCR. Quantitative real-time RT-PCR validated the results of microarray gene expression pat-terns. The credible intervals for both the microarray (orange and light blue) and PCR (red and dark blue) results are given in Fig. 1 for the six genes of interest and the five reference genes.
We see that siderochrome-iron transporter (CNAG_02083), membrane protein (CNAG_03912), and monosaccharide transporter (CNAG_05340), all exhibit expression that significantly exceeds the wild type in both mutants at pH 4 and expression significantly lower than that of the wild type at pH 7.2. The trend toward
decreasing relative expression at pH 7.2 compared to pH 4 is consistent with the results of the microarray experi-ments. Interestingly, iron and/or glucose supplemen-tation did not result in alteration of cell growth of the mutants Δgcs1, Δsmt1 at 37 °C, neutral/alkaline pH and 5 % CO2 environments in comparison to the
Cryptococ-cus WT cultures (data not shown).
Discussion
Fungi are notoriously known for their ability to survive in a diverse range of environmental conditions. Especially, mammalian pathogens survive inside the infected host by adapting themselves to the unique stress of various microenvironments by successfully linking the expression of virulence-associated phenotypes to host-derived pH and temperature cues [41]. Aspergillus nidulans and Sac-charomyces cerevisiae have the PacC/Rim101 transcrip-tion factors mediating pH responses involving plasma membrane and endosomal signal complexes [24, 42]. In
Candida albicans, Rim101 regulates the pH responsive pathway [43] involved in their transition from acidic to alkaline, which in turn stimulates a switch from yeast to filamentous form. Documented evidence of increase in GlcCer on the cell surface at alkaline pH in vitro [44] and also during infection, together with previous reports of GlcCer being associated with the ability to grow in alkaline pH, indicates therefore that this sphingolipid may play an important role in cryptococcal pH respon-sive pathway. In addition to PKA pathway being involved in tolerating increased pH in Cryptococcus, a rim101 mutant is hyper susceptible to not only elevated pH but also to iron deprivation [45].
In this study we have successfully used gene expression to identify genes differentially regulated in mutants defi-cient in a sphingolipid GlcCer. Our microarray studies identified six genes, all of which are involved in transport-ing ions or solutes across the plasma membrane. All of them have the conserved signature domain present in the Major Facilitator Superfamily members. CNAG_02083 or the siderochrome iron transporter has partial homol-ogy to MirA (siderphore transporter) of Fusarium and
Aspergillus and to MFS of Candida. Similarly Aspergil-lus and Candida also have the partial homologue of the monosaccharide transporter (CNAG_05340), the glucose transporter (CNAG_03772) and the membrane trans-port protein (CNAG_00539), with no homologue as such in other fungi could be found for the membrane protein (CNAG_03912).
and thereby the activities of many membrane associated enzymes and transporters [46]. That these changes in protein activities are the direct read-outs of the expres-sion of respective genes have been shown earlier in the case of heat shock genes [47] and also especially in many genes involved in lipid metabolism [48–50]. An impor-tant relevant example can be the yeast PKC1 gene regu-lated pathway which is activated by “plasma –membrane stretch” [51] resulting from its increased fluidity under conditions of thermal stress. Given this scenario, it is reasonable to hypothesize that the changes in membrane dynamics of the two mutants Δsmt1 and Δgcs1 impacted by its physical structure have resulted in the changed level of transcription of certain transporters located on the membrane.
In Cn, major phenotypic changes and the expression of virulence factors are regulated by ion-uptake and homeo-stasis. More specifically, in addition to reduced fungal
burden in mice brains infected with a mutant deficient in iron transporter, low iron induces capsule enlarge-ment and represses laccase [52]. Cir1 considered as the master iron regulator controls the transcription of the genes involved in iron uptake and iron homeostasis and henceforth virulence in Cn [52]. The transcription of siderochrome iron transporter gene is modified in a cir1
mutant, which eventually shows attenuation in virulence [53]. Altered iron and sugar homeostasis can result in a change in the melanin production, membrane trafficking and or copper or zinc loading. Our unpublished results demonstrating iron and/or sugar supplementation being unable to rescue the growth impairment in the mutants indicate that irreversible change/s in the physical struc-ture of the membrane and hence some downstream sign-aling complex associated with the membrane may have happened in the two mutant strains Δgcs1 and Δsmt1. Thus, taken together, this may be a causal factor for
Fig. 1 Results of microarray gene expression patterns validated by RT‑PCR. The credible intervals for both the microarray (orange and light blue)
and PCR (red and dark blue) results are for the six genes of interest and the five reference genes. The orange, red are results for ∆gcs1, while light blue,
[image:7.595.60.540.89.417.2]impaired growth at this pH and hence attenuated viru-lence in these two mutants.
To facilitate comparison of the RT-PCR and microarray studies we sought a mathematical model that related the RT-PCR observations (measures of cycle time at thresh-old for each gene, condition, and strain) to the ratios observed in the microarray studies (Rg, 1–4) for each of the genes of interest. Additionally, we sought to esti-mate those ratios in a manner that accounts for correla-tions in uncertainty when using common reference genes across our experimental conditions and strains using the wild type, under comparable conditions, as reference. To meet these objectives, we chose to express the relation-ships between the experimentally observed data and the ratios of interest in a single model and to use computa-tional methods from the Bayesian statistical framework to make the required inferences. This process provided posterior density estimates for each of the ratios of inter-est and these results could then be directly compared to the microarray experiments (as shown in Fig. 1). The measures and the number of genes used in our refer-ence set (5) are comparable to measures used to select genes developed by other commonly used software (e.g. geNorm which suggest 3–5). Similarly, the equations suggested by others (e.g. REST) are equivalent to those employed here. For confirmation of the reference gene as set selection, we plotted both microarray and RT-PCR expression changes and credible intervals for the refer-ence set under variation in strain and pH in Fig. 1.
Some degree of variability in between our microar-ray data was found in the genes CNAG_00539 and CNAG_03772, though the RT-PCR data were consistent with the microarray data within credible intervals. Gene set enrichment analysis was advantageous over individual gene analysis as it detected subtle changes in expression, although verification of hits after gene-set enrichment analysis was only feasible because of a small subset of six genes identified. However, overall, in this study, in the use of microarray, we overcame the challenge of analyzing a huge amount of expression data, and simultaneously fil-ter out the false-positives effectively by following a sim-ple multi-pronged approach of selecting genes through gene set enrichment analysis on selected genes mapped through signature patterns along with a regression-based approach and their functional validation.
Conclusion
Gene expression microarrays on WT and the mutants of the GlCer pathway identified a novel set of differen-tially regulated genes associated with the growth of Cn
in neutral-alkaline pH, 37 °C, 5 % CO2. Using both sig-nature gene selection method and a regression –based analytical model, gene set enrichment analysis finally
zeroed-in on a subset of six genes: siderochrome-iron transporter, monosaccharide transporter, glucose trans-porter, membrane protein, membrane transport protein, and sugar transporter which were further validated by RT-PCR. These set of genes may therefore be involved in the down-stream transmembrane signaling network, connected to the GlcCer of the membrane, and therefore in-turn control the pathogen’s virulence—associated phe-notype of growth defect in neutral-alkaline pH at 37 °C. Further studies will evaluate the role of these genes in the pathogenesis of C. neoformans and can answer specific mechanistic questions like how they are regulated when GlcCer is absent or its structure is altered.
Availability of supporting data
The microarray data set supporting the results of this article are available in the Gene Expression Omni-bus, at http://www.ncbi.nlm.nih.gov/geo/query/acc. cgi?acc=GSE69361.
The data set(s) supporting the results of this arti-cle listed in Table 2 is available as additional file 1 with DOI "10.6070/H48050MW" at https://mynotebook. labarchives.com/share/Microarray/MjAuOHw5N- DUwMy8xNi9UcmVlTm9kZS81ODE1Nzk3NTd8N-TIuOA==.
Abbreviations
GlcCer: glucosylceramide; Cn: Cryptococcus neoformans; PCR: polymerase chain reaction; RT‑PCR: quantitative real time‑pcr.
Authors’ contributions
AS participated in the overall conceptual and designing of the study, prepared the RNA samples for microarray, analyzed data, and drafted the manuscript. AR performed RT‑PCR, analyzed data and assisted in drafting the manuscript. JS analyzed the microarray data, did the bio‑informatics analysis and drafted the manuscript. CVS participated in the drafting of the manuscript and managed the microarray data. CL provided a critical review of the study design. MDP participated in the study design, writing and critically reviewing the manu‑ script. All authors read and approved the final manuscript.
Author details
1 Department of Biochemistry and Molecular Biology, Medical University of South Carolina, Charleston, SC 29425, USA. 2 Present Address: Depart‑ ment of Medicine, Division of Infectious Diseases and International Health, University of Virginia, 345 Crispell Dr, Carter Harrison Building, Charlottes‑ ville, VA 22908, USA. 3 Present Address: Department of Molecular Genetics and Microbiology, Stony Brook University, 150 Life Science Building, Stony Brook, NY 11794, USA. 4 Present Address: Integrated Systems and Solutions Division, Scientific Research Corporation, Remount Road, North Charleston, SC 29406, USA. 5 Present Address: Department of Physiology and Biophysics, Stony Brook University, Stony Brook, NY 11794, USA. 6 Department of Microbi‑ ology and Immunology, Medical University of South Carolina, Charleston, SC 29425, USA. 7 Department of Craniofacial Biology, Medical University of South Carolina, Charleston, SC 29425, USA. 8 Division of Infectious Diseases, Medical University of South Carolina, Charleston, SC 29425, USA. 9 Department of Pre‑ ventive Medicine, University of Stony Brook, Stony Brook, NY 11794, USA.
Acknowledgements
New Investigator in the Pathogenesis of Infectious Diseases. AR is an American Heart Association Fellow. The authors also acknowledge Dr. June Kwon‑ Chung, NIAID/NIH for her help in during the finalization of the manuscript.
Competing interests
The authors declare that they have no competing interests.
Received: 22 July 2014 Accepted: 20 October 2015
References
1. Lin X, Heitman J. The biology of the Cryptococcus neoformans species complex. Annu Rev Microbiol. 2006;60:69–105.
2. Datta K, Bartlett KH, Baer R, Byrnes E, Galanis E, Heitman J, Hoang L, Leslie MJ, MacDougall L, Magill SS, et al. Spread of Cryptococcus gattii into Pacific Northwest region of the United States. Emerg Infect Dis. 2009;15(8):1185–91.
3. Park BJ, Lockhart SR, Brandt ME, Chiller TM, Public health importance of cryp‑ tococcal disease: epidemiology, burden, and control. In: Heitman J, Kozel TR, Kwon‑Chung KJ, Perfect JR, Casadevall A, editors. Cryptococcus: from human pathogen to model yeast. Washington: ASM press; 2011. p. 585–593. 4. Kronstad JW, Attarian R, Cadieux B, Choi J, D’Souza CA, Griffiths EJ, Ged‑
des JM, Hu G, Jung WH, Kretschmer M, et al. Expanding fungal pathogen‑ esis: cryptococcus breaks out of the opportunistic box. Nat Rev Microbiol. 2011;9(3):193–203.
5. Shea JM, Kechichian TB, Luberto C, Del Poeta M. The cryptococ‑ cal enzyme inositol phosphosphingolipid‑phospholipase C confers resistance to the antifungal effects of macrophages and promotes fungal dissemination to the central nervous system. Infect Immun. 2006;74(10):5977–88.
6. Rittershaus PC, Kechichian TB, Allegood JC, Merrill AH Jr, Hennig M, Luberto C, Del Poeta M. Glucosylceramide synthase is an essential regulator of pathogenicity of Cryptococcus neoformans. J Clin Investig. 2006;116(6):1651–9.
7. Garcia J, Shea J, Alvarez‑Vasquez F, Qureshi A, Luberto C, Voit EO, Del Poeta M. Mathematical modeling of pathogenicity of Cryptococcus neoformans. Mol Syst Biol. 2008;4:183.
8. Kechichian TB, Shea J, Del Poeta M. Depletion of alveolar macrophages decreases the dissemination of a glucosylceramide‑deficient mutant of Cryptococcus neoformans in immunodeficient mice. Infect Immun. 2007;75(10):4792–8.
9. Singh A, Wang H, Silva LC, Na C, Prieto M, Futerman AH, Luberto C, Del Poeta M. Methylation of glycosylated sphingolipid modulates membrane lipid topography and pathogenicity of Cryptococcus neoformans. Cell Microbiol. 2012;14(4):500–16.
10. Oura T, Kajiwara S. Candida albicans sphingolipid C9‑methyltransferase is involved in hyphal elongation. Microbiology. 2010;156(Pt 4):1234–43. 11. Noble SM, French S, Kohn LA, Chen V, Johnson AD. Systematic screens of
a Candida albicans homozygous deletion library decouple morphoge‑ netic switching and pathogenicity. Nat Genet. 2010;42(7):590–8. 12. Oura T, Kajiwara S. Disruption of the sphingolipid Delta8‑desaturase gene
causes a delay in morphological changes in Candida albicans. Microbiol‑ ogy. 2008;154(Pt 12):3795–803.
13. Levery SB, Momany M, Lindsey R, Toledo MS, Shayman JA, Fuller M, Brooks K, Doong RL, Straus AH, Takahashi HK. Disruption of the gluco‑ sylceramide biosynthetic pathway in Aspergillus nidulans and Aspergillus fumigatus by inhibitors of UDP‑Glc:ceramide glucosyltransferase strongly affects spore germination, cell cycle, and hyphal growth. FEBS Lett. 2002;525(1–3):59–64.
14. Ramamoorthy V, Cahoon EB, Thokala M, Kaur J, Li J, Shah DM. Sphin‑ golipid C‑9 methyltransferases are important for growth and virulence but not for sensitivity to antifungal plant defensins in Fusarium gramine-arum. Eukaryot Cell. 2009;8(2):217–29.
15. Cushion MT, Smulian AG, Slaven BE, Sesterhenn T, Arnold J, Staben C, Porollo A, Adamczak R, Meller J. Transcriptome of Pneumocystis carinii during fulminate infection: carbohydrate metabolism and the concept of a compatible parasite. PLoS One. 2007;2(5):e423.
16. Rhome R, McQuiston T, Kechichian T, Bielawska A, Hennig M, Drago M, Morace G, Luberto C, Del Poeta M. Biosynthesis and immunogenicity of glucosylceramide in Cryptococcus neoformans and other human patho‑ gens. Eukaryot Cell. 2007;6(10):1715–26.
17. Warnecke D, Heinz E. Recently discovered functions of glucosylceramides in plants and fungi. Cell Mol Life Sci. 2003;60(5):919–41.
18. Toledo MS, Levery SB, Suzuki E, Straus AH, Takahashi HK. Characteriza‑ tion of cerebrosides from the thermally dimorphic mycopathogen Histoplasma capsulatum: expression of 2‑hydroxy fatty N‑acyl (E)‑Delta(3)‑ unsaturation correlates with the yeast‑mycelium phase transition. Glycobiology. 2001;11(2):113–24.
19. Del Poeta M, Nimrichter L, Rodrigues ML, Luberto C. Synthesis and biologi‑ cal properties of fungal glucosylceramide. Plos Pathogen. 2014;10(1):1–6. 20. Rodrigues ML, Travassos LR, Miranda KR, Franzen AJ, Rozental S, de Souza
W, Alviano CS, Barreto‑Bergter E. Human antibodies against a purified glucosylceramide from Cryptococcus neoformans inhibit cell budding and fungal growth. Infect Immun. 2000;68(12):7049–60.
21. Hazel JR. Thermal adaptation in biological membranes: is homeoviscous adaptation the explanation? Annu Rev Physiol. 1995;57:19–42. 22. Bogdanov M, Umeda M, Dowhan W. Phospholipid‑assisted refold‑
ing of an integral membrane protein. Minimum structural features for phosphatidylethanolamine to act as a molecular chaperone. J Biol Chem. 1999;274(18):12339–45.
23. Perfect JR. Cryptococcus neoformans: the yeast that likes it hot. FEMS Yeast Res. 2006;6(4):463–8.
24. Selvig K, Alspaugh JA. pH response pathways in fungi: adapting to host‑ derived and environmental signals. Mycobiology. 2011;39(4):249–56. 25. Penalva MA, Arst HN Jr. Recent advances in the characterization of ambi‑
ent pH regulation of gene expression in filamentous fungi and yeasts. Annu Rev Microbiol. 2004;58:425–51.
26. Penalva MA, Tilburn J, Bignell E, Arst HN Jr. Ambient pH gene regulation in fungi: making connections. Trends Microbiol. 2008;16(6):291–300. 27. Buck J, Levin LR. Physiological sensing of carbon dioxide/bicarbonate/pH
via cyclic nucleotide signaling. Sensors. 2011;11(2):2112–28.
28. Calcagno‑Pizarelli AM, Negrete‑Urtasun S, Denison SH, Rudnicka JD, Bus‑ sink HJ, Munera‑Huertas T, Stanton L, Hervas‑Aguilar A, Espeso EA, Tilburn J, et al. Establishment of the ambient pH signaling complex in Aspergillus nidulans: PalI assists plasma membrane localization of PalH. Eukaryot Cell. 2007;6(12):2365–75.
29. Brown DA, London E. Functions of lipid rafts in biological membranes. Annu Rev Cell Dev Biol. 1998;14:111–36.
30. Lingwood D, Simons K. Lipid rafts as a membrane‑organizing principle. Science. 2010;327(5961):46–50.
31. Walther TC. Keeping sphingolipid levels nORMal. Proc Natl Acad Sci USA. 2010;107(13):5701–2.
32. Xu X, Bittman R, Duportail G, Heissler D, Vilcheze C, London E. Effect of the structure of natural sterols and sphingolipids on the formation of ordered sphingolipid/sterol domains (rafts). Comparison of cholesterol to plant, fungal, and disease‑associated sterols and comparison of sphingomyelin, cerebrosides, and ceramide. J Biol Chem. 2001;276(36):33540–6. 33. Sonnino S, Aureli M, Loberto N, Chigorno V, Prinetti A. Fine tuning of
cell functions through remodeling of glycosphingolipids by plasma membrane‑associated glycohydrolases. FEBS Lett. 2010;584(9):1914–22. 34. Singh A, Qureshi A, Del Poeta M. Quantitation of cellular components in
Cryptococcus neoformans for system biology analysis. Methods Mol Biol. 2011;734:317–33.
35. Villani M, Subathra M, Im YB, Choi Y, Signorelli P, Del Poeta M, Luberto C. Sphingomyelin synthases regulate production of diacylglycerol at the Golgi. Biochem J. 2008;414(1):31–41.
36. Friedman J, Hastie T, Tibshirani R. Regularization paths for generalized linear models via coordinate descent. J Stat Softw. 2010;33(1):1–22. 37. John K. Doing Bayesian data analysis: a tutorial introduction with R.
Academic Press, 2010.
38. Martyn P. JAGS version 3.1.0 user mannual. International Agency for Research on Cancer, 2011.
39. Martyn P. Rjags: Bayesian graphical models using MCMC. R package ver‑ sion 3‑10, 2013.
41. Penalva MA, Arst HN Jr. Regulation of gene expression by ambient pH in filamentous fungi and yeasts. Microbiol Mol Biol Rev MMBR. 2002;66(3):426–46.
42. Lamb TM, Mitchell AP. The transcription factor Rim101p governs ion tolerance and cell differentiation by direct repression of the regula‑ tory genes NRG1 and SMP1 in Saccharomyces cerevisiae. Mol Cell Biol. 2003;23(2):677–86.
43. Davis D, Edwards JE Jr, Mitchell AP, Ibrahim AS. Candida albicans RIM101 pH response pathway is required for host‑pathogen interactions. Infect Immun. 2000;68(10):5953–9.
44. Rhome R, Singh A, Kechichian T, Drago M, Morace G, Luberto C, Del Poeta M. Surface localization of glucosylceramide during Cryptococcus neoformans infection allows targeting as a potential antifungal. PLoS One. 2011;6(1):e15572.
45. O’Meara TR, Norton D, Price MS, Hay C, Clements MF, Nichols CB, Alspaugh JA. Interaction of Cryptococcus neoformans Rim101 and protein kinase A regulates capsule. PLoS Pathog. 2010;6(2):e1000776.
46. Vigh L, Maresca B, Harwood JL. Does the membrane’s physical state control the expression of heat shock and other genes? Trends Biochem Sci. 1998;23(10):369–74.
47. Carratu L, Franceschelli S, Pardini CL, Kobayashi GS, Horvath I, Vigh L, Maresca B. Membrane lipid perturbation modifies the set point of the
temperature of heat shock response in yeast. Proc Natl Acad Sci USA. 1996;93(9):3870–5.
48. Slater SJ, Kelly MB, Taddeo FJ, Ho C, Rubin E, Stubbs CD. The modulation of protein kinase C activity by membrane lipid bilayer structure. J Biol Chem. 1994;269(7):4866–71.
49. de Kruijff B. Biomembranes. Lipids beyond the bilayer. Nature. 1997;386(6621):129–30.
50. Slater SJ, Kelly MB, Taddeo FJ, Rubin E, Stubbs CD. Evidence for discrete diacylglycerol and phorbol ester activator sites on protein kinase C. Dif‑ ferences in effects of 1‑alkanol inhibition, activation by phosphatidyletha‑ nolamine and calcium chelation. J Biol Chem. 1994;269(25):17160–5. 51. Kamada Y, Jung US, Piotrowski J, Levin DE. The protein kinase C‑activated
MAP kinase pathway of Saccharomyces cerevisiae mediates a novel aspect of the heat shock response. Genes Dev. 1995;9(13):1559–71.
52. Jung WH, Kronstad JW. Iron and fungal pathogenesis: a case study with Cryptococcus neoformans. Cell Microbiol. 2008;10(2):277–84.
53. Jung WH, Sham A, White R, Kronstad JW. Iron regulation of the major viru‑ lence factors in the AIDS‑associated pathogen Cryptococcus neoformans. PLoS Biol. 2006;4(12):e410.
Submit your next manuscript to BioMed Central and take full advantage of:
• Convenient online submission
• Thorough peer review
• No space constraints or color figure charges
• Immediate publication on acceptance
• Inclusion in PubMed, CAS, Scopus and Google Scholar
• Research which is freely available for redistribution