T E C H N I C A L N O T E
Open Access
GenomeGems: evaluation of genetic variability
from deep sequencing data
Sharon Ben-Zvi
1,2†, Adi Givati
1,2†and Noam Shomron
2*Abstract
Background:Detection of disease-causing mutations using Deep Sequencing technologies possesses great challenges. In particular, organizing the great amount of sequences generated so that mutations, which might possibly be biologically relevant, are easily identified is a difficult task. Yet, for this assignment only limited automatic accessible tools exist.
Findings:We developed GenomeGems to gap this need by enabling the user to view and compare Single Nucleotide Polymorphisms (SNPs) from multiple datasets and to load the data onto the UCSC Genome Browser for an expanded and familiar visualization. As such, via automatic, clear and accessible presentation of processed Deep Sequencing data, our tool aims to facilitate ranking of genomic SNP calling. GenomeGems runs on a local Personal Computer (PC) and is freely available at http://www.tau.ac.il/~nshomron/GenomeGems.
Conclusions:GenomeGems enables researchers to identify potential disease-causing SNPs in an efficient manner. This enables rapid turnover of information and leads to further experimental SNP validation. The tool allows the user to compare and visualize SNPs from multiple experiments and to easily load SNP data onto the UCSC Genome browser for further detailed information.
Keywords:Deep sequencing, Next generation sequencing, Software, Genetic analysis, Data interpretation, Variance calling
Findings
The sequencing of the human genome was the highlight of many years of international laborious efforts. Since
2004, new technologies termed “Deep Sequencing” or
“Next-Generation Sequencing” have been developed to
reduce timelines and costs of subsequent re-sequencing of additional human genomes [1,2]. These methods changed genome sequencing approaches, made genome sequencing extremely accessible, and opened new fields in biomedical investigation [3,4]. Basically, Deep Sequen-cing methods allow enormous amounts of short DNA fragments to be read simultaneously [5]. One of the most common applications is the discovery of genetic variation between healthy and diseased individuals [6,7]. In particular, the emergence of Deep Sequencing
tech-nologies has dramatically boosted whole genome
sequencing and re-sequencing [8,9]. This advancement possesses computational challenges for base calling, read alignment, genome assembly, mutation detection as well as data visualization [3,10-12]. Currently, a variety of software tools are available for analyzing Deep Sequen-cing data. These range from alignment of the nucleotide reads to a reference genome, base-calling, polymorphism detection, genome browsing and annotation [13]. A sub-set of these tools, those that provide a better evaluation and visualization of Deep Sequencing data is presented in Table 1 and 2. Of particular importance, the final stage of the Deep Sequencing data interpretation pipe-line, where genetic variance is identified and evaluated, requires distinct attention. The potential candidate mutations are screened and ranked for their relevance for further investigation. Hence, they are a critical gate-way of the investigators to the disease-causing mutation.
Several tools exist to facilitate the data interpretation stage, each focusing on a different aspect of the analysis: EagleView [15], for example, is compatible with a variety of operating systems and supports visualization of Deep
* Correspondence:[email protected]
†Equal contributors 2
Department of Cell and Developmental Biology, Sackler Faculty of Medicine, Tel-Aviv University, Tel Aviv, Israel
Full list of author information is available at the end of the article
Sequencing derived genome assemblies. However, this software, freely available on the internet, is not suitable for the most up-to-date sequencing technologies (such as ABI/SOLID or Helicos). LookSeq [16], an AJAX based web viewer was developed to visualize the mul-tiple layers of information which includes large data sets of aligned sequence reads, produced by Deep Sequen-cing, and enable the user to visualize the information at different levels of resolution. This tool uses Illumina Genome Analyzer/HiSeq 2000 data as input though lacks the ability to visualize large sequenced regions such as an entire human chromosome due to significant memory demands. MagicViewer [17], a freely available application based on an independent operating system implementation, provides annotation facilities for Single Nucleotide Polymorphisms (SNPs) without extending annotations for Insertion-Deletions (Indels). In addition, it lacks features of conducting comparisons among vari-ous samples. ABC [14], a Java based viewer for explor-ation of data associated with alignments displays quantitative data (such as sequence similarity) and
annotation data (such as location of genes and repeats), simultaneously. ABC does not function as a genome-wide browser, but is suitable for comparative sequence analysis. Finally, Tablet [18] displays the data as highly packed views allowing instant navigation to any region of interest. Compatible with a variety of operating sys-tems, Tablet requires large memory storage therefore has limited use on a Personal Computer (PC).
Our tool, termed GenomeGems, was developed in
[image:2.595.58.545.99.449.2]order to provide systematic means to reduce inconsist-ency in selecting which genetic variances or mutations should be further investigated. We developed a unique interface which includes analysis and visualization (via the widely used UCSC Genome Browser) leading to prioritization of data generated by Deep Sequencing runs. One way to facilitate variance calling from genetic sequences is putting them in context with other sequenced samples [19]. Therefore, one ofGenomeGems’ strong features lies within its ability to compare, analyze and visualize a large number of samples, simultaneously. Using tables and graphs on a PC workstation, both
Table 1 Comparison of some of the currently avaibale tools for data interpretaion and analysis
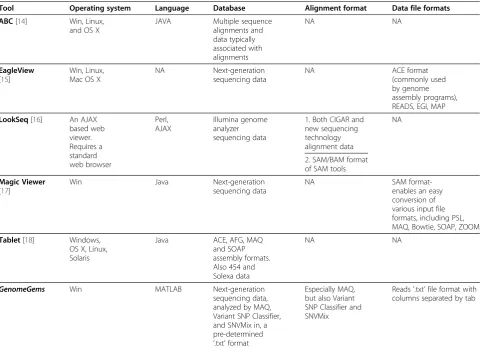
Tool Operating system Language Database Alignment format Data file formats
ABC[14] Win, Linux, and OS X
JAVA Multiple sequence alignments and data typically associated with alignments NA NA EagleView
[15]
Win, Linux, Mac OS X
NA Next-generation sequencing data
NA ACE format
(commonly used by genome assembly programs), READS, EGI, MAP
LookSeq[16] An AJAX based web viewer. Requires a standard web browser Perl, AJAX Illumina genome analyzer sequencing data
1. Both CIGAR and new sequencing technology alignment data
NA
2. SAM/BAM format of SAM tools
Magic Viewer
[17]
Win Java Next-generation sequencing data
NA SAM
format-enables an easy conversion of various input file formats, including PSL, MAQ, Bowtie, SOAP, ZOOM
Tablet[18] Windows, OS X, Linux, Solaris
Java ACE, AFG, MAQ and SOAP assembly formats. Also 454 and Solexa data
NA NA
GenomeGems Win MATLAB Next-generation sequencing data, analyzed by MAQ, Variant SNP Classifier, and SNVMix in, a pre-determined
‘.txt’format
Especially MAQ, but also Variant SNP Classifier and SNVMix
Reads '.txt’file format with columns separated by tab
Table 2 A comparison of the Visualization Capabilities and Data Integration of the different tools currently available with those ofGenomeGems
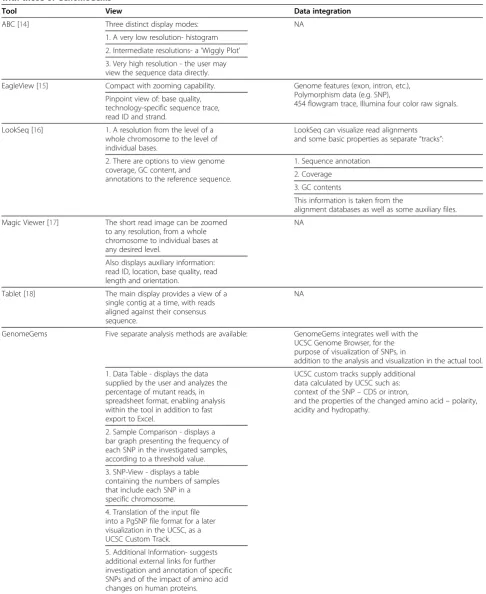
Tool View Data integration
ABC [14] Three distinct display modes: NA
1. A very low resolution- histogram
2. Intermediate resolutions- a‘Wiggly Plot’
3. Very high resolution - the user may view the sequence data directly.
EagleView [15] Compact with zooming capability. Genome features (exon, intron, etc.), Polymorphism data (e.g. SNP),
454 flowgram trace, Illumina four color raw signals. Pinpoint view of: base quality,
technology-specific sequence trace, read ID and strand.
LookSeq [16] 1. A resolution from the level of a whole chromosome to the level of individual bases.
LookSeq can visualize read alignments and some basic properties as separate“tracks”:
2. There are options to view genome coverage, GC content, and
annotations to the reference sequence.
1. Sequence annotation
2. Coverage
3. GC contents
This information is taken from the
alignment databases as well as some auxiliary files.
Magic Viewer [17] The short read image can be zoomed to any resolution, from a whole chromosome to individual bases at any desired level.
NA
Also displays auxiliary information: read ID, location, base quality, read length and orientation.
Tablet [18] The main display provides a view of a single contig at a time, with reads aligned against their consensus sequence.
NA
GenomeGems Five separate analysis methods are available: GenomeGems integrates well with the UCSC Genome Browser, for the purpose of visualization of SNPs, in
addition to the analysis and visualization in the actual tool.
1. Data Table - displays the data supplied by the user and analyzes the percentage of mutant reads, in spreadsheet format, enabling analysis within the tool in addition to fast export to Excel.
UCSC custom tracks supply additional data calculated by UCSC such as: context of the SNP–CDS or intron,
and the properties of the changed amino acid–polarity, acidity and hydropathy.
2. Sample Comparison - displays a bar graph presenting the frequency of each SNP in the investigated samples, according to a threshold value.
3. SNP-View - displays a table containing the numbers of samples that include each SNP in a specific chromosome.
4. Translation of the input file into a PgSNP file format for a later visualization in the UCSC, as a UCSC Custom Track.
5. Additional Information- suggests additional external links for further investigation and annotation of specific SNPs and of the impact of amino acid changes on human proteins.
Microsoft Excel and the UCSC Genome Browser are dir-ectly linked to the interpreted information. While some
tasks carried out by GenomeGems can be achieved by
other standalone tools, such as the ‘R package’ or also partially by Microsoft Excel, GenomeGems is a suite of applications which makes it easier to perform a combin-ation of tasks accessible for end users of non-computational background. This tool comes to facilitate genomic research via multiple-processing and accessible presentation of Deep Sequencing data for variance call-ing, in order to assist rapid turnover of information lead-ing to further experimental mutation detection. Since SNPs are the most prevalent genetic modification among individuals [20]GenomeGemscurrently focuses on these variations.
Rationale
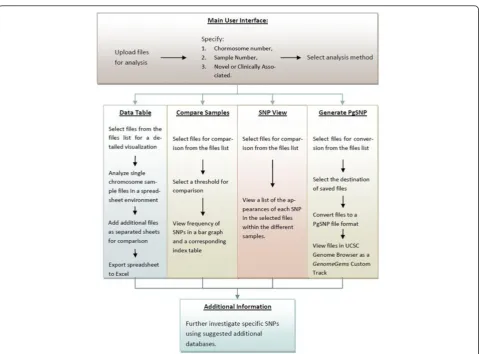
During the investigation of disease-causing genetic mutations using Deep Sequencing methods, there are multiple steps along the analysis pipeline (schematically shown in Figure 1). First, biomedical researches select a disease and try to identify the underlying genetic causes behind it. Consequently, genomes of affected individuals, or of whole families, are sequenced using Deep Sequen-cing machines. The data acquired is compared with a consensus sequence using bioinformatics alignment tools such as MAQ [21], and is assessed and annotated for the presence of variants using tools such as Variant Classifier and SNVMix [22]. At this point, a list of SNPs
(and Indels) is accordingly generated and is filtered for high confidence values. The list of SNPs produced pre-sumably contains the disease-causing mutation. These lists are usually separated into two based on whether they are novel or clinically associated SNPs by compar-ing to comprehensive databases such as dbSNP [23]. These files are extremely valuable as they lead to further analysis and confirmation on a larger set of samples. Yet, at this point these records frequently contain hundreds of SNPs in text format, and researchers are faced with the often tedious task of filtering the candidates in search for the disease-causing mutation. The task of fil-tering the list can be carried out using tabular lists (such as Microsoft Excel tables) and using a variety of freely available online databases and tools such as: dbSNP [23], PolyPhen-2 [24], ConSurf [25], and others. These tools contain data of previously reported SNPs [23] and of the amino acid change such SNPs are expected to generate. If this analysis is carried out manually it becomes tedi-ous, time consuming, repetitive, and prone to inaccur-acy.GenomeGemsis directed specifically for the purpose of providing researchers with a simple tool for sorting, analyzing, prioritizing and visualizing the SNPs provided by data acquired by Deep Sequencing experiments (as long as the input file adheres to the GenomeGems’ for-mat). While several features of our software can be
per-formed by other standalone tools, such as the ‘R
package’ or also partially by Microsoft Excel, Genome-Gemsmakes it easier to carry out a combination of tasks
accessible for end users of non-computational
background.
Methods
[image:4.595.57.294.455.584.2]The key design feature underlying GenomeGems’ appli-cation is to facilitate the final steps of Deep Sequencing data analysis via organizing and allowing accessible pre-sentation of the data, thus leading to a rapid shift to the next step of experimental mutation detection.
Figure 1An illustration of a common research process done when investigating a potential genetic disease.This interdisciplinary process normally involves researchers from three distinct disciplines: bio-medical discipline, Deep Sequencing laboratory, and bioinformatics discipline. (1) Researchers from the bio-medical discipline identify a potentially genetic disease. (2) Genomes of afflicted individuals or of whole families are sequenced using Deep Sequencing technology. (3) The sequences acquired are compared with a consensus sequence in order to find SNPs. (4) A list of SNPs and Indels is consequently generated and is filtered. (5) Finally a list of SNPs and Indels is produced which possibly contains the disease causing mutation. The list usually contains either novel or clinically associated SNPs (6) These lists are submitted to the researchers in the bio-medical discipline, for further analysis.
[image:4.595.303.539.560.704.2]GenomeGems was validated using Deep Sequencing data generated in the Genome High-Throughput Sequencing Laboratory at Tel-Aviv University on the Illumina Gen-ome Analyzer apparatus. A sample processing pipeline is
presented in Figure 2. GenomeGems was developed
using MATLAB functions and MATLAB’s Graphic User Interface (GUI) tools. It functions as a stand-alone appli-cation on a Windows workstation with ActiveX Control
and “MCR Ver 7.10” installation required on the users’
workstations. These software necessitates minimal hard-ware, memory usage and installation time. The user can easily download these software installation packages
from the GenomeGemswebsite.GenomeGemswas
care-fully designed paying particular attention to the require-ments of the investigators in this genomic field. Algorithms were developed for a simple comparison using graphs and tables of data produced from a number of samples, and for a wide and detailed visualization of
the Deep Sequencing pre-processed data. GenomeGems
integrates well with the University of California Santa Cruz (UCSC) Genome Browser for the purpose of SNP visualization within investigated chromosomes. This function is made possible by development of a platform for the conversion of pre-processed input data to a Per-sonal Genome SNP data format (PgSNP) [26], which can be viewed and further analyzed using the UCSC Genome Browser. Furthermore,GenomeGems suggests additional useful external databases for further clinical SNP investigation.
Application
A basic implementation ofGenomeGemshas been devel-oped, which enables the user to analyze and visualize the input data according to the flow chart in Figure 3.
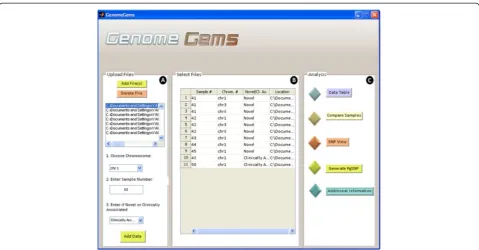
Main user interface
[image:5.595.59.539.331.685.2]The main user interface contains three distinct panels as seen in Figure 4: (A) Upload Files, (B) Select Files, and
(C) Analysis. The Upload Files panel contains a list into which the user uploads the input files, selects a chromo-some on which the analysis will be performed, specifies the sample number and specifies whether the data is of novel or clinically associated SNPs. The user may upload multiple files containing multiple samples, but each file must be of one single sample. The user may also choose multiple chromosomes on which the later analysis will be performed.
The selected files, with a specified sample number, chromosome number, novel or clinically associated and location appear in the ‘Select Files’panel (marked as B) as a list. This list of files must include all of the files that are required for the later analysis. At any stage the user may return to the main user interface in order to add more files to be available for analysis. The ‘Analysis’ panel (marked as C) contains the different functions available for analysis. At the moment, the tool contains five options for analysis: Data Table, Compare Samples, SNP View, Generate PgSNP, and Additional Information. In the future, additional forms of analysis will be added to this panel, as the tool is built in a modular form, allowing for further expansion.
Input file format
Users input a list of SNPs after analysis by MAQ (or other software) in a pre-determined format. The files must be in“.txt”format and columns are separated by a tab. The files must contain the following data (in this
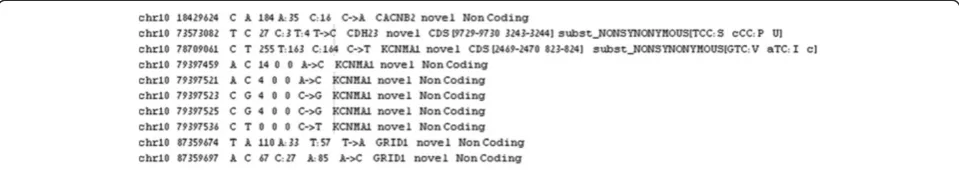
specific order): Chromosome number, SNP Position, Consensus Nucleotide, SNP nucleotide, Score of the SNP, Number of Reads of each nucleotide. If any infor-mation is missing the user is directed to use “0”. Other optional information that can be submitted: Gene Name, SNP Novel/ Known, CDS (Coding Sequence)/Non-Coding, Synonymous/Non-Synonymous, Amino Acid Replacement, SNP ID for known SNPs and so on. See Figure 5 for an example of a sample file. Data in-put is supplied by uploading the files that are to be analyzed, and choosing the chromosomes relevant for each file. This list of files and chromosomes is saved, and is later accessed throughout the employment of the tool.
Data table
[image:6.595.58.538.87.337.2]The Data Table user interface (shown in Figure 6) enables analysis of the data uploaded by the user inside the actual tool in addition to fast export to Excel using Microsoft Office Spreadsheet ActiveX Control compo-nent. The data table visualizes the information asso-ciated with the chromosome that was selected by the user. It allows presenting a number of samples and chro-mosomes simultaneously as different sheets. The data table shows all of the information that was supplied by the user in a tabular fashion. In addition, the percentage of the mutant reads is displayed for an easier determin-ation of SNP Homozygosity or Heterozygosity.
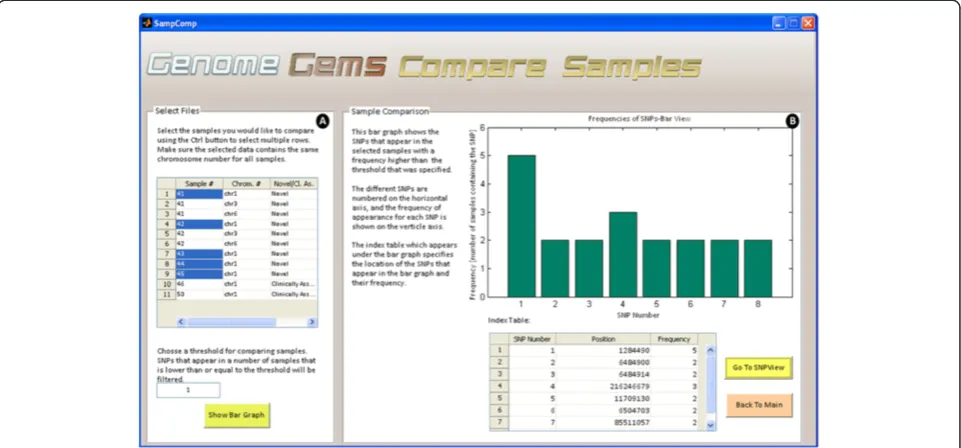
Sample comparison
When searching for a disease causing mutation, multiple samples are sequenced from a population which is either related or is diagnosed with the specific disease. In case several samples are uploaded into theGenomeGems, the user may compare samples and calculate the frequency of appearance of each SNP in the different samples. This information is displayed as a bar graph showing the fre-quencies of each SNP which surpass the threshold value selected formerly by the user, along with a correspond-ing table which serves as an index (as shown in Figure 7).
SNP view
Upon selection of desired files for analysis, the ‘SNP View’interface (shown in Figure 8) displays a table con-taining the sample numbers that include each SNP in the specific chromosome defined formerly. This data
may be useful for further analysis by the users, and can be easily exported to Microsoft Excel.
PGSNP file format in the UCSC Genome Browser
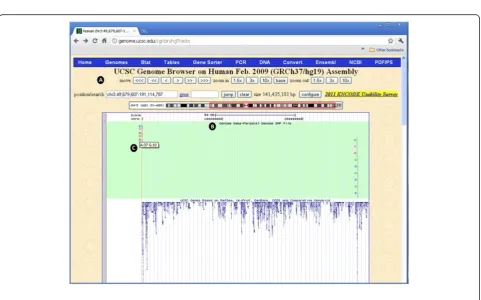
[image:7.595.58.538.90.175.2]Many tools have been developed to examine the struc-ture and function of the human gene set. For this pur-pose, genome browsers from the NCBI and UCSC have been designed. GenomeGems is designed to be compat-ible with the UCSC Genome Browser, created by the University of California Santa Cruz, as it is commonly used to analyze genetic information. It provides a graph-ical display of related genes that can be organized based on specific criteria such as expression levels, proximity in genome, protein similarity, and Gene Ontology (GO) [14,15]. By using GenomeGems, users can automatically convert the original format of data into a PgSNP format that can be viewed conveniently in UCSC Genome Browser using UCSC’s custom tracks feature (shown in Figure 9).
Figure 5Example of the input file format required for GenomeGems.The file must contain data from one single sample, and must not contain a heading line. The file may contain one single chromosome or all chromosomes, but in both cases the user must specify the chromosome for analysis. The data in the file must be separated into columns using tabs, and must contain the first 7 columns: chromosome number, SNP position, consensus nucleotide, SNP nucleotide, score of the SNP, number of reads for each nucleotide, as shown in the figure. The file may include any additional data in the following columns, also separated by tabs.
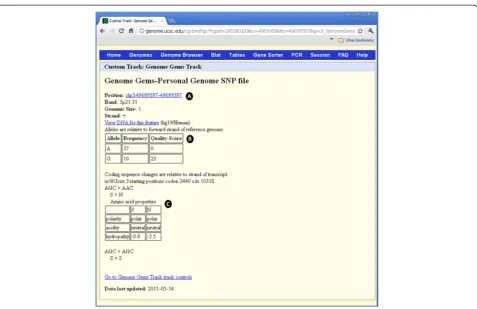
Custom tracks in the UCSC
[image:8.595.58.539.90.314.2]Custom tracks enable research scientists using the UCSC Genome Browser to visualize their own results or annotation tracks alongside standard annotation tracks. This simple tool may be used to display locations of SNPs as well as other information regarding each SNP [27,28]. GenomeGems uses an algorithm for generating PgSNP files from the original data files, which can then
be uploaded as a custom track in the UCSC Genome Browser. A display of the SNPs uploaded by the user is consequently created and supplementary information supplied by UCSC can be viewed. The additional infor-mation supplied by UCSC is the context of the SNP – CDS or Intron, and the properties of the changed amino acid–polarity, acidity and hydropathy, as seen in Figures 10 and 11.
Figure 7The Compare Samples interface allows the user to (A) select files for comparison and choose a threshold for minimal SNP frequency and (B) view the results in a bar graph and a corresponding index table.
Figure 9The PgSNP interface allows the user to (A) choose a file for conversion to PgSNP format and specify the location where the file will be saved, and (B) instructs the user how to upload the file to UCSC as a Custom Track in five simple steps.
[image:9.595.58.540.387.687.2]Additional information
For further investigation and annotation of specific SNPs and of the impacts of amino acid changes encoded by the mutant gene on a human protein,GenomeGemssuggests additional external useful links: Polymorphism Phenotyp-ing v2( PolyPhen-2) [24] , Server of the Identification of Functional Regions in Proteins (ConSurf Server) [25], Prediction of Transmembrane Regions and Orientation
(TMpred), Online Mendalian Inheritance in Man
(OMIM) [29] and University of California Santa Cruz (UCSC) [30], (see Figure 12). The‘Additional Information’ interface will be updated in the next versions of Genome-Gems to enable direct referral to a specific entry in the databases, based on the user’s SNP selection.
Application summary
GenomeGems enables researchers to identify potential disease-causing SNPs in an efficient manner. Genome-Gems’ main advantages are its: (i) ability to integrate data from several Deep Sequencing runs on a standard PC; (ii) assimilation with the UCSC Genome Browser and Microsoft Excel; (iii) applicability for any Deep Se-quencing data (given the correct input file format) (iv)
power to compare and analyze a large number of sam-ples.GenomeGems'main virtues allow: (i) reducing vari-ability in selecting which mutations should be further investigated; (ii) facilitating genomic research via clear and accessible presentation of processed Deep Sequen-cing data; (iii) assisting rapid turnover of information and a quick lead to further experimental mutation detection.
GenomeGems facilitates genomic research
Behind the implementation of GenomeGems lies our
main objective of facilitating genomic research by pro-cessing Deep Sequencing data in a comprehensive and accessible fashion. This enables rapid turnover of infor-mation and leads to further experimental SNP valid-ation. The tool allows the user to compare and visualize SNPs from multiple experiments and to easily load SNP data onto the UCSC Genome browser for further detailed information.
Further developments
[image:10.595.60.538.85.394.2]further analysis is underway.GenomeGems was designed using a modular approach, enabling easy extension of its capabilities. Continuous dialogue with potential end-users ofGenomeGems,and constant search for improve-ments, ensures that more advanced features will be added to the current implementation. A few examples are listed below.
1. Indel Analysis
At the moment, the tool does not support data files containing indels. An extension of the tool will include indel analysis and an algorithm for determining whether an indel causes the appearance of a nonsense mutation in the sequence analyzed.
2. Full Genome Analysis
At the momentGenomeGemsenables analysis of a single chromosome specified by the user. In the next version ofGenomeGemswe intend to enable full genome analysis and full genome comparison between samples.
3. Additional Visualization Capabilities
The current version ofGenomeGemsenables SNP visualization by means of UCSC’s Custom Tracks. In subsequent versions a convenient visualization within the application and without the need to connect to the Internet will be included.
4. Further mutation Analysis
The current version ofGenomeGemslacks an independent feature for prediction of the impacts amino acid substitutions (caused by SNPs) on the structure and function of human proteins. Instead, external free tools providing this
information are suggested. In subsequent versions this feature will be included as an integrated function ofGenomeGems.
Availability of the software and system requirements
Project Name:GenomeGems.
Project Home Page: http://xwww.tau.ac.il/~nshomron/ GenomeGems.
Operating System: Microsoft Windows. Programming Language: MATLAB 2009. Other Requirements: installation of an ActiveX
Control and“MCR Ver 7.10”on the users' workstations.
Abbreviations
SNPs: Single Nucleotide Polymorphisms; Indels: Insertion-Deletions; MAQ: Mapping and Assembly with Quality; UCSC: University of California Santa Cruz; NCBI: National Center of Biotechnology Information; SNVMix: Small Nucleotide Variants; PgSNP: Personal Genome SNP; CDS: Coding Sequence; NA: Not available; SOAP: Short Oligonucleotide Analysis Package; ACE: Archive Compression Extension; AFG: Auxiliary File Generator; EGI: Embedded Gateway Interface; SNVMix: Small Nucleotide Variants; CIGAR: Compact Idiosyncratic Gapped Alignment Report.
Competing interests
The authors declare no competing financial interest.
Authors’contributions
NS conceived the need for the software, SB, AG and NS designed the tool, SB and AG wrote the software, SB, AG and NS wrote the paper. All authors read and approved the final manuscript.
Financial support
The Shomron laboratory is supported by the the National Institutes of Health (NIDCD) R01DC011835; Chief Scientist Office, Ministry of Health, Israel; Israel Cancer Association; Wolfson Family Charitable Fund; I-CORE Program of the Planning and Budgeting Committee, The Israel Science Foundation (grant number 41/11).
Acknowledgements
We thank Prof Karen Avaraham, Dr Lilach Friedman, Dr Zippi Brownstein, Dr Barak Markus, Dr Nitzan Kol and Ofer Iaskov for fruitful discussions on software development. We thank Dr Tamir Tuller for commenting on the manuscript.
Author details
1
Department of Biomedical Engineering, The Iby and Aladar Fleischman Faculty of Engineering, Tel-Aviv University, Tel Aviv, Israel.2Department of
[image:11.595.56.540.89.257.2]Cell and Developmental Biology, Sackler Faculty of Medicine, Tel-Aviv University, Tel Aviv, Israel.
Received: 14 December 2011 Accepted: 24 May 2012 Published: 2 July 2012
References
1. Van Tassell CP,et al:SNP discovery and allele frequency estimation by deep sequencing of reduced representation libraries.Nat Methods2008, 5(3):247–252.
2. Anderson MW, Shrijver I:Next generation DNA sequencing and the future of genomic medicine.Genes2010,1(1):38–69.
3. Mardis ER:Next generation DNA sequencing methods.Annu Rev Genomics Hum Genome2008,9:387–402.
4. Metzker ML:Sequencing technologies - the next generation.Nat Rev Genet2011 Jan,11(1):31–46.
5. Schuster SC:Next-generation sequencing transforms today’s biology.Nat Methods2008 Jan,5(1):16–18.
6. Janitz M:Next-generation genome sequencing, towards personalized medicine.: Wiley-VCH Verlag GmbH & Co; 2008.
7. Li R,et al:SNP detection for massively parallel whole-genome resequencing.Genome Res2009 Jun,19(6):1124–1132.
8. Kuhlenbaumer G, Hullmann J, Appenzeller S:Novel genomic techniques open new avenues in the analysis of monogenic disorders.Hum Mutat
2011 Feb,32(2):144–151.
9. Bentley DR:Whole-genome re-sequencing.Curr Opin Genet Dev2006 Dec, 16(6):545–552.
10. Voelkreding KV, Dames SA, Durtschi JD:Next-generation sequencing: from basic research to diagnostics.Clin Chem2009 Apr,55(4):641–658. 11. Ansorge WJ:Next-generation DNA sequencing techniques.New
Biotechnol2009,25(4):195–203.
12. Mihai P, Salzberg SL:Bioinformatics challenges of new sequencing technology.Trends Genet2007 Mar,24(3):142–149.
13. Shendure J, Ji H:Next-generation DNA sequencing.Nat Biotechnol2008 Oct,26(10):1135–1145.
14. Cooper GM, Singaravelu SAG, Sidow A:ABC: software for interactive browsing of genomic multiple sequence alignment data.BMC Bioinforma
2004 Dec,8(5):192.
15. Huang W, Marth G:EagleView: a genome assembly viewer for next-generation sequencing technologiesCold Spring Harbor Laboratory Press;
2008:1538–1542.
16. Manske HM, Kwitowski DP:LookSeq: a browser-based viewer for deep sequencing data. Cold Spring Harbor Laboratory press 2009:2125–2131. 17. Hou H,et al:Magic viewer: integrated solution for next-generation
sequencing data visualization and genetic variation detection and annotation.Nucleic Acid Res2010 Jul,38:W732–W736.
18. Mile I,et al:Tablet: next generation sequence assemble visualization. Bioinforma Appl Note2010,26:401–402.
19. McPherson JD:Next-generation gap.Nat Methods Suppl
2009 Nov,6(11 Suppl):S2–S5.
20. Frazer KA,et al:Human genetic variation and its contribution to complex traits.Nat Rev Genet2009 Apr,10(4):241–251.
21. Li H, Ruan J, Durbin R:Mapping short DNA sequencing reads and calling variants using mapping quality scores.Genome Res2008 Nov, 18(11):1851–1858.
22. Goya R,et al:SNVMix: predicting single nucleotide variants from next-generation sequencing of tumors.Bioinformatics2010 Mar 15, 26(6):730–736.
23. Sherry ST,et al:dbSNP: the NCBI database of genetic variation.Nucleic Acids Res2001 Jan 1,29(1):308–311.
24. Adzhubei IA,et al:A method and server for predicting damaging missense mutations.Nat Methods2010 Apr,7(4):248–249.
25. Glaser F,et al:ConSurf: indentification of functional regions in proteins by surface-mapping of phylogenetic information.Bioinformatics2003 Jan, 19(1):163–164.
26. Personal Genome SNP format:UCSC Genome Browser[Online] [http:// genome.ucsc.edu/FAQ/FAQformat.html#format10]
27. UCSC Genome Bioinformatics:Custom Tracks[Online] [http://genome.cse. ucsc.edu/goldenPath/help/customTrack.html#EXAMPLE1]
28. Zweig AS,et al:UCSC genome browser tutorial.Genomics2008,92:75–84. 29. Ada H, Scott AF, Amberger JS, Bocchini CA, McKusick VA:Online Mendelian
Inheritance in Man (OMIM), a knowledgebase of human genes and genetic disorders.Nucleic Acids Res2005 Jan 1,33:D514–D517.
30. Kent WJ, Hsu F, Karolchik D:Exploring relationships and mining data with the UCSC gene sorter.Genome Res2005,15:737–741.
doi:10.1186/1756-0500-5-338
Cite this article as:Ben-Zviet al.:GenomeGems: evaluation of genetic variability from deep sequencing data.BMC Research Notes20125:338.
Submit your next manuscript to BioMed Central and take full advantage of:
• Convenient online submission
• Thorough peer review
• No space constraints or color figure charges
• Immediate publication on acceptance
• Inclusion in PubMed, CAS, Scopus and Google Scholar
• Research which is freely available for redistribution