Open Access
Research article
Validation of a method for identifying nursing home admissions
using administrative claims
Ilene H Zuckerman*
1, Masayo Sato
1, Van Doren Hsu
1and Jose J Hernandez
2Address: 1Department of Pharmaceutical Health Services Research, University of Maryland School of Pharmacy, Baltimore, Maryland, USA and 2Department of Pharmacy Practice, University of Puerto Rico School of Pharmacy, San Juan, Puerto Rico
Email: Ilene H Zuckerman* - [email protected]; Masayo Sato - [email protected]; Van Doren Hsu - [email protected]; Jose J Hernandez - [email protected]
* Corresponding author
Abstract
Background: Currently there is no standard algorithm to identify whether a subject is residing in a nursing home from administrative claims. Our objective was to develop and validate an algorithm that identifies nursing home admissions at the resident-month level using the MarketScan Medicare Supplemental and Coordination of Benefit (COB) database.
Methods: The computer algorithms for identifying nursing home admissions were created by using provider type, place of service, and procedure codes from the 2000 – 2002 MarketScan Medicare COB database. After the algorithms were reviewed and refined, they were compared with a detailed claims review by an expert reviewer. A random sample of 150 subjects from the claims was selected and used for the validity analysis of the algorithms. Contingency table analysis, comparison of mean differences, correlations, and t-test analyses were performed. Percentage agreement, sensitivity, specificity, and Kappa statistics were analyzed.
Results: The computer algorithm showed strong agreement with the expert review (99.9%) for identification of the first month of nursing home residence, with high sensitivity (96.7%), specificity (100%) and a Kappa statistic of 0.97. Weighted Pearson correlation coefficient between the algorithm and the expert review was 0.97 (p < 0.0001).
Conclusion: A reliable algorithm indicating evidence of nursing home admission was developed and validated from administrative claims data. Our algorithm can be a useful tool to identify patient transitions from and to nursing homes, as well as to screen and monitor for factors associated with nursing home admission and nursing home discharge.
Background
Administrative claims databases have been utilized fre-quently in health services research [1-4]. For instance, automated claims data protocols are used to identify chronic conditions, predict future health care costs, screen for population at risk for outcomes, and review the appro-priateness of medical procedures (including surgery and
hospital admission) and drug prescribing [5-7]. Many studies have assessed the validity and reliability of these protocols for a number of clinical conditions [8-13]. Although claims databases have limitations such as lack of information on important risk factors (i.e., smoking status and family histories), they remain a good resource for a number of reasons. The use of large administrative Published: 10 December 2007
BMC Health Services Research 2007, 7:202 doi:10.1186/1472-6963-7-202
Received: 2 May 2007 Accepted: 10 December 2007
This article is available from: http://www.biomedcentral.com/1472-6963/7/202
© 2007 Zuckerman et al; licensee BioMed Central Ltd.
databases is relatively inexpensive, minimizes selection bias, and increases external validity compared to the pri-marily collected dataset. Automated claims data contain more accurate and complete information on variables related to payment. Since they are rich in patient utiliza-tion variables, and since patient utilizautiliza-tion variables can be linked to the patient health care environment, large administrative databases can be used to identify nursing home related transitions [14-18]. However, claims data have unique limitations that may diminish the validity of results [9,10,19,20]. In addition, the sensitivity of claims data to capture and assess case mix has been a key issue [2,21].
Nursing home care is the most expensive type of long-term care [22]. Poor health outcomes, including death, have been found to be associated with nursing home placement [23,24]. A recent meta-analysis using data that is nationally representative of the U.S. population found that three or more activities of daily living dependencies, cognitive impairment, and prior nursing home use were the strongest predictors of nursing home admissions [25]. It is extremely important to screen and monitor for factors associated with nursing home admissions. However, no standard algorithm to identify nursing home admissions has been developed, making it difficult to isolate true admissions. Utilization of administrative claims data-bases for nursing home research has not been extensively explored. There is no direct way to identify whether a sub-ject is in a nursing home from administrative claims [2,16,26-28]. For example, if a subject's health insurance does not cover the nursing home care (i.e., the nursing home charges), then there will not be a claim for the charges. However, if a subject is in a nursing home under that circumstance, there will be other covered charges, for example, physician visits, during the nursing home stay. These other covered charges may be captured, albeit indi-rectly, in the claims by examination of the place of service and procedure codes. Beusterien et al. investigated the impact of rivastigmine use on the risk of nursing home placement using the MarketScan database [29]. Nursing home placement was identified by a record of a nursing home claim on two separate dates. However, it is unclear whether their methodology included only claims submit-ted by nursing home providers or claims that indicasubmit-ted nursing home stays through place of service and proce-dure codes. Hence, it is not simple to identify nursing home admission from claims because nursing home stays are covered fully, partially, or not at all by various payers, unless one has access to all sources of payment, including self-payment.
Awareness of the potential pitfalls for identifying nursing home admission in the use of large claims data can help prevent misclassification and improve the validity and
efficiency of analysis. Therefore, the development of a valid and reliable algorithm to identify nursing home admissions is imperative. The algorithm may help to screen high risk elderly or monitor elderly in terms of nursing home admission. The objectives of this study are to develop an algorithm that identifies nursing home stays on a month level and to validate the algorithm against a "gold standard" measure of monthly nursing home stays using the MarketScan Medicare Supplemental and Coordination of Benefit database.
Methods
Study subjects and data sources
Data were obtained from the 2000–2002 MarketScan Medicare Supplemental and Coordination of Benefit database. The database, produced by Thomson Medstat, contains information on a convenience sample of pri-vately insured Medicare-eligible retirees who are covered by employer-sponsored Medicare supplemental benefit plans [30]. The database includes all employer and Medi-care coordination of benefits for those enrollees who have both employer coverage and Medicare coverage. The lon-gitudinal database links medical and prescription drug administrative claims with person-level enrollment data. All MarketScan Medicare inpatient and outpatient service claims containing information on any of the following variables were extracted: (1) provider type suggestive of a nursing home (e.g., long-term care facility); (2) place of service suggestive of a nursing home (e.g., skilled nursing facility); or (3) CPT (Current Procedure Terminology) procedure code suggestive of care specific to a nursing home. Table 1 includes a description of these claims codes.
Creating the computer algorithms for identifying nursing home stays
Claims were sorted by person identifier and service dates, and from this an event day-level file was created. For each person-day, a variable (RULE) was assigned that indicates the type of nursing home (NH)-related claims identified for that date. The value of RULE was specific to the pro-vider [1 = related or 0 = not], place of service [1 = NH-related or 0 = not], procedure [1 = NH-NH-related or 0 = not] and source of claim (inpatient or outpatient claim). Thus the value for RULE was a string of 6 characters of 0s and 1s: the 1st character is a flag of a claim with a NH provider
type from an inpatient claim; the 2nd character is a flag of
a claim with a NH provider type from an outpatient claim; the 3rd character is a flag of a claim with a NH place of
service from an inpatient claim; the 4th character is a flag
of a claim with a NH place of service from an outpatient claim; the 5th character is a flag of a claim with a NH
pro-cedure code from an inpatient claim; the 6th character is a
For example, RULE = '100000' means that for a specific person-day there was one or more inpatient claims that had a NH provider type. Furthermore, on that specific date, there were no inpatient or outpatient claims with a NH place of service or NH procedure code. RULE = '101000'means that for a specific person-day there was one or more inpatient claims that had a NH provider type and an inpatient claim with a NH place of service, and RULE = '111111' means that for a specific person-day there was one or more inpatient and outpatient claims that had a NH provider type, a NH place of service, and a NH procedure code. There were 833,669 person-days
where the provider type, place of service or procedure code was indicative of a nursing home stay. These person-days represented 90,465 subjects. The frequency distribu-tion of the claims codes RULE variable is displayed in Table 2.
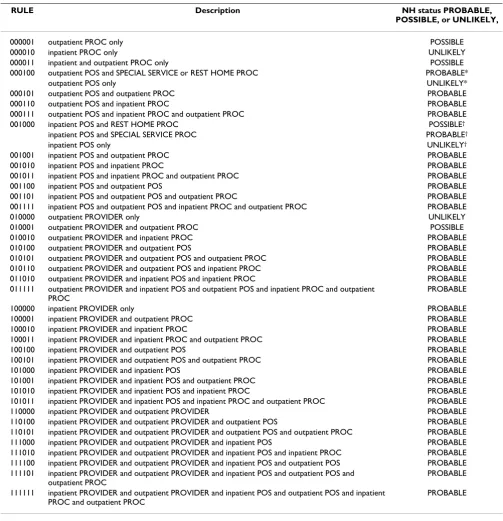
Each RULE type was categorized as "PROBABLE," "POSSI-BLE," or "UNLIKELY" for its rating of nursing home evi-dence. Strong evidence of a nursing home stay was coded as "PROBABLE" (e.g., one or more outpatient claims that had a NH place of service and an outpatient claim with a NH procedure code: RULE = 000101); ambiguous
evi-Table 1: Claims codes screened for nursing home admission incidents
Code Description
Provider type codes
30 Long term care facility
31 Extended care facility
32 Geriatric hospital
33 Convalescent care facility
34 Intermediate care facility
Place of service codes
27 Inpatient long term care
31 Skilled nursing facility
32 Nursing facility
33 Custodial care facility
Procedure codes
99301 Evaluation and management of a new or established patient involving an annual nursing facility assessment: 30 minutes at the bedside.
99302 Evaluation and management of a new or established patient involving an annual nursing facility assessment of a complication or a new problem: 40 minutes at the bedside.
99303 Evaluation and management of a new or established patient involving an annual nursing facility assessment at the time of initial admission to the facility: 50 minutes at the bedside.
99311 Subsequent nursing facility care, per day, for the evaluation and management of a new or established patient: 15 minutes at the bedside.
99312 Subsequent nursing facility care, per day, for the evaluation and management of a new or established patient who is responding inadequately to therapy or has developed a minor complication: 25 minutes at the bedside.
99313 Subsequent nursing facility care, per day, for the evaluation and management of a new or established patient who has developed a significant complication or a new problem: 35 minutes at the bedside.
99315 Nursing facility discharge day management; 30 minutes or less
99316 Nursing facility discharge day management; more than 30 minutes
99379 Physician supervision of a nursing facility patient (patient not present) requiring complex and multidisciplinary care; 15–29 minutes
99380 Physician supervision of a nursing facility patient (patient not present) requiring complex and multidisciplinary care modalities; 30 minutes or more
G0066 Physician supervision of a nursing facility patient (patient not present); 30 minutes or more per month
99199 Unlisted special service, procedure or report
99321 Domiciliary or rest home visit for the evaluation and management of a new patient; the presenting problems are of low severity
99322 Domiciliary or rest home visit for the evaluation and management of a new patient; the presenting problems are of moderate severity
99323 Domiciliary or rest home visit for the evaluation and management of a new patient; the presenting problems are of high complexity
99331 Domiciliary or rest home visit for the evaluation and management of a new patient; the patient is stable, recovering or improving
99332 Domiciliary or rest home visit for the evaluation and management of a new patient; the patient is responding inadequately to therapy or has developed a minor complication
[image:3.612.53.569.100.572.2]dence of a nursing home stay was coded as "POSSIBLE" (e.g., one or more outpatient claims that had only NH procedure code: RULE = 000001); and "UNLIKELY" (e.g., one or more inpatient claims that had only NH procedure code: RULE = 000010) indicated no evidence of a nursing home stay. Table 3 contains a full description of the pro-tocol used to classify each RULE as PROBABLE, POSSI-BLE, or UNLIKELY. Two computerized algorithms were developed to assign a level of evidence for a nursing home stay for each person-month. Algorithm 1 defined a
[image:4.612.57.551.100.577.2]per-son-month as a nursing home stay if there was at least one person-day in the month where the nursing home RULE = "PROBABLE" was present; otherwise the person-month was considered not to be a nursing home stay. Algorithm 2 defined a person-month as a nursing home stay if there was at least one person-day in the month where the nurs-ing home RULE = "PROBABLE" or RULE = "POSSIBLE" was present; otherwise the person-month was considered not to be a nursing home stay.
Table 2: Frequencies of nursing home evidence types among days with any evidence (n = 833,669 person-days)
RULE Description Frequency Percent
000101 outpatient POS and outpatient PROC 448,959 53.85
000001 outpatient PROC only 143,515 17.21
000100 outpatient POS only 137,355 16.48
010100 outpatient PROVIDER and outpatient POS 43,413 5.21
000010 inpatient PROC only 19,213 2.30
001010 inpatient POS and inpatient PROC 12,152 1.46
010000 outpatient PROVIDER only 10,444 1.25
101000 inpatient PROVIDER and inpatient POS 4,830 0.58
010101 outpatient PROVIDER and outpatient POS and outpatient PROC 4,513 0.54
001000 inpatient POS only 3,844 0.46
100000 inpatient PROVIDER only 3,359 0.40
101010 inpatient PROVIDER and inpatient POS and inpatient PROC 564 0.07
010001 outpatient PROVIDER and outpatient PROC 351 0.04
001111 inpatient POS and outpatient POS and inpatient PROC and outpatient PROC 232 0.03
100010 inpatient PROVIDER and inpatient PROC 172 0.02
111100 inpatient PROVIDER and outpatient PROVIDER and inpatient POS and outpatient POS 107 0.01
001100 inpatient POS and outpatient POS 98 0.01
001001 inpatient POS and outpatient PROC 78 0.01
000011 inpatient and outpatient PROC only 72 0.01
001011 inpatient POS and inpatient PROC and outpatient PROC 62 0.01
000111 outpatient POS and inpatient PROC and outpatient PROC 58 0.01
101001 inpatient PROVIDER and inpatient POS and outpatient PROC 50 0.01
100101 inpatient PROVIDER and outpatient POS and outpatient PROC 45 0.01
110000 inpatient PROVIDER and outpatient PROVIDER 40 < 0.01
110100 inpatient PROVIDER and outpatient PROVIDER and outpatient POS 39 < 0.01
111000 inpatient PROVIDER and outpatient PROVIDER and inpatient POS 31 < 0.01
010110 outpatient PROVIDER and outpatient POS and inpatient PROC 17 < 0.01
100100 inpatient PROVIDER and outpatient POS 15 < 0.01
100001 inpatient PROVIDER and outpatient PROC 11 < 0.01
111111 inpatient PROVIDER and outpatient PROVIDER and inpatient POS and outpatient POS and inpatient PROC and outpatient PROC
5 < 0.01
011010 outpatient PROVIDER and inpatient POS and inpatient PROC 4 < 0.01
111010 inpatient PROVIDER and outpatient PROVIDER and inpatient POS and inpatient PROC 4 < 0.01
000110 outpatient POS and inpatient PROC 3 < 0.01
010010 outpatient PROVIDER and inpatient PROC 3 < 0.01
110101 inpatient PROVIDER and outpatient PROVIDER and outpatient POS and outpatient PROC
3 < 0.01
011111 outpatient PROVIDER and inpatient POS and outpatient POS and inpatient PROC and outpatient PROC
2 < 0.01
100011 inpatient PROVIDER and inpatient PROC and outpatient PROC 2 < 0.01
101011 inpatient PROVIDER and inpatient POS and inpatient PROC and outpatient PROC 2 < 0.01
001101 inpatient POS and outpatient POS and outpatient PROC 1 < 0.01
111101 inpatient PROVIDER and outpatient PROVIDER and inpatient POS and outpatient POS and outpatient PROC
1 < 0.01
Validating the algorithms against a "gold standard"
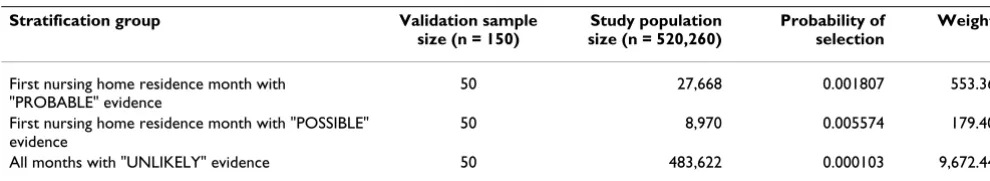
A random sample stratified by nursing home evidence for their first nursing home month of 150 subjects was selected: 50 subjects with evidence = "PROBABLE"; 50 subjects with evidence = "POSSIBLE," and 50 subjects
[image:5.612.54.557.98.619.2]with no evidence of nursing home residence during any month (= "UNLIKELY"). We used this stratification to assure that our sample contained subjects that represented a broad spectrum of our RULEs for identifying nursing home stays.
Table 3: Modified nursing home rules, based on preliminary expert review
RULE Description NH status PROBABLE,
POSSIBLE, or UNLIKELY,
000001 outpatient PROC only POSSIBLE
000010 inpatient PROC only UNLIKELY
000011 inpatient and outpatient PROC only POSSIBLE
000100 outpatient POS and SPECIAL SERVICE or REST HOME PROC PROBABLE*
outpatient POS only UNLIKELY*
000101 outpatient POS and outpatient PROC PROBABLE
000110 outpatient POS and inpatient PROC PROBABLE
000111 outpatient POS and inpatient PROC and outpatient PROC PROBABLE
001000 inpatient POS and REST HOME PROC POSSIBLE†
inpatient POS and SPECIAL SERVICE PROC PROBABLE†
inpatient POS only UNLIKELY†
001001 inpatient POS and outpatient PROC PROBABLE
001010 inpatient POS and inpatient PROC PROBABLE
001011 inpatient POS and inpatient PROC and outpatient PROC PROBABLE
001100 inpatient POS and outpatient POS PROBABLE
001101 inpatient POS and outpatient POS and outpatient PROC PROBABLE
001111 inpatient POS and outpatient POS and inpatient PROC and outpatient PROC PROBABLE
010000 outpatient PROVIDER only UNLIKELY
010001 outpatient PROVIDER and outpatient PROC POSSIBLE
010010 outpatient PROVIDER and inpatient PROC PROBABLE
010100 outpatient PROVIDER and outpatient POS PROBABLE
010101 outpatient PROVIDER and outpatient POS and outpatient PROC PROBABLE
010110 outpatient PROVIDER and outpatient POS and inpatient PROC PROBABLE
011010 outpatient PROVIDER and inpatient POS and inpatient PROC PROBABLE
011111 outpatient PROVIDER and inpatient POS and outpatient POS and inpatient PROC and outpatient PROC
PROBABLE
100000 inpatient PROVIDER only PROBABLE
100001 inpatient PROVIDER and outpatient PROC PROBABLE
100010 inpatient PROVIDER and inpatient PROC PROBABLE
100011 inpatient PROVIDER and inpatient PROC and outpatient PROC PROBABLE
100100 inpatient PROVIDER and outpatient POS PROBABLE
100101 inpatient PROVIDER and outpatient POS and outpatient PROC PROBABLE
101000 inpatient PROVIDER and inpatient POS PROBABLE
101001 inpatient PROVIDER and inpatient POS and outpatient PROC PROBABLE
101010 inpatient PROVIDER and inpatient POS and inpatient PROC PROBABLE
101011 inpatient PROVIDER and inpatient POS and inpatient PROC and outpatient PROC PROBABLE
110000 inpatient PROVIDER and outpatient PROVIDER PROBABLE
110100 inpatient PROVIDER and outpatient PROVIDER and outpatient POS PROBABLE
110101 inpatient PROVIDER and outpatient PROVIDER and outpatient POS and outpatient PROC PROBABLE
111000 inpatient PROVIDER and outpatient PROVIDER and inpatient POS PROBABLE
111010 inpatient PROVIDER and outpatient PROVIDER and inpatient POS and inpatient PROC PROBABLE
111100 inpatient PROVIDER and outpatient PROVIDER and inpatient POS and outpatient POS PROBABLE
111101 inpatient PROVIDER and outpatient PROVIDER and inpatient POS and outpatient POS and outpatient PROC
PROBABLE
111111 inpatient PROVIDER and outpatient PROVIDER and inpatient POS and outpatient POS and inpatient PROC and outpatient PROC
PROBABLE
POS = place of service; PROC = procedure code
*If claim had one of the following procedure codes; 99199, 99321, 99322, 99323, 99331, 99332, 99333, it was classified on "PROBABLE" otherwise it was classified on "UNLIKELY".
† If claim had one of the following procedure codes; 99321, 99322, 99323, 99331, 99332, 99333, it was classified on "POSSIBLE". If claim had 99199,
For each person in the randomly selected validation sam-ple, all of their inpatient and outpatient administrative service claims for years 2000, 2001, and 2002 were extracted. These claims were arranged into a profile for each person that contained a line listing of the claims, sorted by service date with the following information: patient identifier, source (inpatient or outpatient), date, provider type, place of service, procedure. An expert claims reviewer reviewed the profiles. The expert reviewer was a clinical pharmacist who had over eight years of experience doing research with administrative claims and other secondary datasets. One of her areas of expertise is in developing algorithms and operationalizing defini-tions of specific outcomes and covariates from adminis-trative claims. The reviewer was blinded to the computer algorithm's values. The expert reviewer recorded her assessment on a data collection sheet. For each person-month, the reviewer recorded a "1" in the box for each month determined to have any evidence of nursing home residence, and left the box blank if there was no evidence of nursing home residence. Results of the expert reviewer were entered into a database and compared to the results of the two computer algorithms. This in-depth review of claims was considered the "gold standard" for the purpose of validation of the computer-based algorithm.
Since the sampling unit was the subject, all analyses were performed with the subject as the unit of analysis. To esti-mate statistical measures for the entire population of interest, each subject's measures were weighted. Each per-son was assigned a weight which was derived from the reciprocal of the probability of selection, based upon the stratified sampling design. All results are reported using weighted measures; unweighted measures are also included for measures of agreement, sensitivity, specificity and Kappa.
To compare the computer algorithms to the "gold stand-ard" assessment of nursing home residence at the month level, a month from each sample subject was randomly selected to report percent agreement, sensitivity, specifi-city and predictive values. In addition, the Kappa statistic is reported. The Kappa statistic determines the extent of agreement between two or more measures beyond what would be expected by chance. The standard error of Kappa
was used to generate 95 percent confidence intervals [31]. Previously established guidelines were used to interpret the Kappa statistics. A Kappa greater than 0.75 indicates excellent agreement, values between 0.4 and 0.75 indicate fair to good agreement, and values less than 0.4 indicate poor agreement [32]. A priori acceptable values for agree-ment, sensitivity and specificity were set at greater than 0.8, and a priori acceptable values for Kappa were set at greater than 0.75. Correlations and paired t-tests were used to compare the two methods' total number of nurs-ing home months identified per subject.
Results
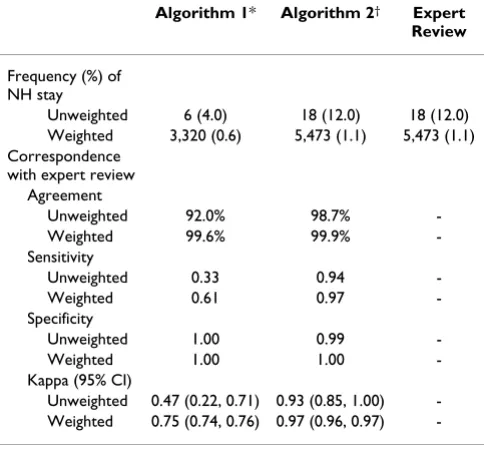
[image:6.612.54.549.642.732.2]The population comprises 520,260 subjects, represented by the stratified sample of 150 subjects (Table 4). Mean age of the sample population was 74 years old; 55 percent were female. Table 5 compares the "gold standard" review to the computer algorithms. Both algorithms had high agreement and specificity. However, Algorithm 2, a broader definition including ambiguous nursing home evidence, had higher sensitivity than Algorithm 1. Algo-rithm 2 also had a higher Kappa statistic, indicating that this algorithm had higher chance-corrected agreement with the "gold standard" and was less susceptible to chance agreement. Algorithm 1 did not meet the a priori criteria for acceptable sensitivity or for Kappa in either the unweighted or weighted measures. Positive predictive val-ues were high for both algorithms (1.00 and 0.97 for Algorithm 1 and Algorithm 2, respectively) and negative predictive values were above 0.99 for both algorithms. Algorithm 1 agreed with the expert reviewer to the exact month in 97.9 percent of the subjects, and was accurate within two months in 98.0 percent of subjects. Algorithm 2 performed slightly better, with exact month agreement in 99.1 percent subjects, and within two months in 99.3 percent of subjects. Detailed information on distribution of the expert reviewer's responses and algorithm determi-nations is shown in Table 6. The total number of nursing home residence months per subjects during the study period was similar among all three measures, with a mean difference of less than one month for each algorithm, when compared to the expert review (Table 7). The high correlations between each algorithm and the expert review also suggest agreement on this measure, although Algorithm 2's correlation coefficient was slightly higher
Table 4: Validation sample stratification and weights
Stratification group Validation sample size (n = 150)
Study population size (n = 520,260)
Probability of selection
Weight
First nursing home residence month with "PROBABLE" evidence
50 27,668 0.001807 553.36
First nursing home residence month with "POSSIBLE" evidence
50 8,970 0.005574 179.40
than Algorithm 1 (r = 0.97 vs. 0.83, respectively). Algo-rithm 2 is more likely to have higher validity.
Discussion
A reliable algorithm indicating evidence of nursing home admission was developed and validated from administra-tive claims data. Algorithm 2 met minimal a priori criteria for sensitivity, specificity and agreement, suggesting that the algorithm is a valid measure of nursing home resi-dence. Although Algorithm 1 performed well with regard to measuring the total number of nursing home residence
months, its sensitivity reached only 61 percent (weighted) with a Kappa statistic suggesting fair to good agreement. Based on a Kappa statistic of 0.97, Algorithm 2 displayed excellent agreement and higher validity. Thus, "relaxing" the definition for a nursing home stay by including those rules with a "POSSIBLE" evidence rating improved sensi-tivity without sacrificing specificity.
The methodology compares algorithms based on nursing home-related claims for identifying nursing home stays to a "gold standard" measure, which is an expert's review of all claims (nursing-home related and non-nursing home-related claims). One limitation is that the "gold standard" is not an actual observation of whether or not the subject is in the nursing home; it is also based on administrative claims analysis. However, the "gold standard" is more robust in that it includes a review of all administrative claims (inpatient and outpatient) and it is an implicit review by an expert who has research experience with
Table 7: Comparison of total count of nursing home residence months(n = 150, Weighted n = 520,260)
Weighted mean difference in total number of nursing home residence
months (95% CI)
p-value Weighted Pearson correlation coefficient
p-value
Algorithm 1*vs. Expert Review -0.13 (-0.36, 0.11) 0.30 0.83 <0.0001
Algorithm 2†vs. Expert Review -0.01 (-0.11, 0.10) 0.93 0.97 <0.0001
CI = confidence interval
*Algorithm 1 defined a person-month as a nursing home stay if there was at least one day in the month where the nursing home RULE = "PROBABLE"; otherwise the person-month was considered not to be a nursing home stay.
†Algorithm 2 defined a person-month as a nursing home stay if there was at least one day in the month where the nursing home RULE =
[image:7.612.55.297.121.349.2]"PROBABLE" or RULE = "POSSIBLE"; otherwise the person-month was considered not to be a nursing home stay.
Table 5: Frequency and agreement between methods of determination of nursing home residence (n = 150, Weighted n = 520,260)
Algorithm 1* Algorithm 2† Expert Review
Frequency (%) of NH stay
Unweighted 6 (4.0) 18 (12.0) 18 (12.0)
Weighted 3,320 (0.6) 5,473 (1.1) 5,473 (1.1)
Correspondence with expert review
Agreement
Unweighted 92.0% 98.7%
-Weighted 99.6% 99.9%
-Sensitivity
Unweighted 0.33 0.94
-Weighted 0.61 0.97
-Specificity
Unweighted 1.00 0.99
-Weighted 1.00 1.00
-Kappa (95% CI)
Unweighted 0.47 (0.22, 0.71) 0.93 (0.85, 1.00)
-Weighted 0.75 (0.74, 0.76) 0.97 (0.96, 0.97)
-NH = nursing home; CI = confidence interval
*Algorithm 1 defined a person-month as a nursing home stay if there was at least one day in the month where the nursing home RULE = "PROBABLE"; otherwise the person-month was considered not to be a nursing home stay.
[image:7.612.52.556.610.678.2]† Algorithm 2 defined a person-month as a nursing home stay if there was at least one day in the month where the nursing home RULE = "PROBABLE" or RULE = "POSSIBLE"; otherwise the person-month was considered not to be a nursing home stay.
Table 6: Unweighted frequency between methods of determination of nursing home residence (n = 150)
Frequency (%)
Expert Review
NH Non-NH Total
Algorithm 1* NH 6 (4.0) 0 (0.0) 6 (4.0)
Non-NH 12 (8.0) 132 (88.0) 144 (96.0) 18 (12.0) 132 (88.0) 150 (100)
Algorithm 2† NH 17 (11.3) 1 (0.7) 18 (12.0) Non-NH 1 (0.7) 131 (87.3) 132 (88.0)
18 (12.0) 132 (88.0) 150 (100)
NH: Evidence of nursing home residence
*Algorithm 1 defined a person-month as a nursing home stay if there was at least one day in the month where the nursing home
RULE = "PROBABLE"; otherwise the person-month was considered not to be a nursing home stay.
†Algorithm 2 defined a person-month as a nursing home stay if there
was at least one day in the month where the nursing home
claims analysis, and specifically with nursing home claims. Having two or more experts review the claims and adjudicating discrepancies would strengthen the "gold standard" measure, but resources precluded the use of more than one reviewer.
Since our algorithms were developed and validated using the MarketScan Medicare Supplemental and Coordina-tion of Benefit database, they may not be applicable to other claims databases. The MarketScan database has unique characteristics. It is a collection of coordination of benefits claims, which means that if a service claim was paid completely by Medicare, it may not be in the Coordi-nation of Benefit database. This scenario is likely to hap-pen with Medicare qualified skilled nursing facility stays since Medicare covers full cost for the first 20 days. In addition, the subjects in this study cohort may be different from the general elderly Medicare population. They are, on average, likely to be younger and have better income, education, and health [5].
Three different indicators were used to identify nursing home in the claims databases in this study: provider type, place of service, and procedure code. Since claims data pri-marily serve billing purposes, provider type and proce-dure codes are likely to be more accurate than place of service. Place of service codes do not directly affect reim-bursement. Also, it is difficult for both the computer algo-rithm and the expert reviewer to differentiate between nursing homes and assisted living facilities.
The development of algorithms for identifying nursing home admission can help to reduce misclassification. Suf-ficient magnitude of this measurement error decreases the validity of a study's findings. Some studies using claims databases describe that their measures of nursing home admission are defined as patient admission to nursing home or long-term care facility [15,17,33], with no meth-odological details about how admission to nursing facili-ties was identified, even though most claims databases have the same measurement issues as the MarketScan database. Unless the measurement methodology is explained, it is difficult to assess how measurement errors may affect the study results. Our findings suggest that using one indicator alone on claims may miss capturing some patients with events of nursing home admission, reducing the measure's sensitivity. Researchers using claims should know characteristics of databases and be cautious about the potential pitfalls.
Conclusion
Based upon our analysis, Algorithm 2 is a valid measure of nursing home residence when compared to a "gold standard" expert review. Using similar methodology, algorithms can be developed and applied to various
administrative databases as a useful tool for screening and monitoring high risk patients for nursing home admis-sion. Since administrative claims databases can provide large, representative samples of longitudinal patient pro-files, they can be effectively used to analyze factors associ-ated with nursing home admission.
Competing interests
The author(s) declare that they have no competing inter-ests.
Authors' contributions
IHZ planned and constructed the study. IHZ and VDH carried out creation of algorithm and claims data review. IHZ, MS, and JJH interpreted data as a team and drafted the manuscript. All authors contributed to the develop-ment of this manuscript. All authors read and approved the final manuscript.
Acknowledgements
The authors wish to thank Dr. Thomas Rapp for valuable comments on a draft of the manuscript. We also acknowledge Thomson Medstat for per-mission to access the MarketScan databases. Dr. Zuckerman was sup-ported by a National Institute on Aging Career Development award (K01AG22011).
References
1. Schneeweiss S, Avorn J: A review of uses of health care utiliza-tion databases for epidemiologic research on therapeutics. J Clin Epidemiol 2005, 58(4):323-337.
2. Ray WA: Policy and program analysis using administrative databases. Ann Intern Med 1997, 127(8 Pt 2):712-718.
3. Mitchell JB, Bubolz T, Paul JE, Pashos CL, Escarce JJ, Muhlbaier LH, Wiesman JM, Young WW, Epstein RS, Javitt JC: Using Medicare claims for outcomes research. Med Care 1994, 32(7 Suppl):JS38-51.
4. Connell FA, Diehr P, Hart LG: The use of large data bases in health care studies. Annu Rev Public Health 1987, 8:51-74. 5. Zuckerman IH, Langenberg P, Baumgarten M, Orwig D, Byrns PJ,
Simoni-Wastila L, Magaziner J: Inappropriate drug use and risk of transition to nursing homes among community-dwelling older adults. Med Care 2006, 44(8):722-730.
6. Powers CA, Meyer CM, Roebuck MC, Vaziri B: Predictive mode-ling of total healthcare costs using pharmacy claims data: a comparison of alternative econometric cost modeling tech-niques. Med Care 2005, 43(11):1065-1072.
7. Fishman PA, Goodman MJ, Hornbrook MC, Meenan RT, Bachman DJ, O'Keeffe Rosetti MC: Risk adjustment using automated ambu-latory pharmacy data: the RxRisk model. Med Care 2003,
41(1):84-99.
8. Roos LL, Mustard CA, Nicol JP, McLerran DF, Malenka DJ, Young TK, Cohen MM: Registries and administrative data: organization and accuracy. Med Care 1993, 31(3):201-212.
9. Iezzoni LI: Assessing quality using administrative data. Ann Intern Med 1997, 127(8 Pt 2):666-674.
10. Weingart SN, Iezzoni LI, Davis RB, Palmer RH, Cahalane M, Hamel MB, Mukamal K, Phillips RS, Davies DT Jr., Banks NJ: Use of admin-istrative data to find substandard care: validation of the com-plications screening program. Med Care 2000, 38(8):796-806. 11. Monfared AA, Lelorier J: Accuracy and validity of using medical
claims data to identify episodes of hospitalizations in patients with COPD. Pharmacoepidemiol Drug Saf 2006,
15(1):19-29.
12. Du XL, Key CR, Dickie L, Darling R, Geraci JM, Zhang D: External validation of medicare claims for breast cancer chemother-apy compared with medical chart reviews. Med Care 2006,
Publish with BioMed Central and every scientist can read your work free of charge "BioMed Central will be the most significant development for disseminating the results of biomedical researc h in our lifetime."
Sir Paul Nurse, Cancer Research UK
Your research papers will be:
available free of charge to the entire biomedical community
peer reviewed and published immediately upon acceptance
cited in PubMed and archived on PubMed Central
yours — you keep the copyright
Submit your manuscript here:
http://www.biomedcentral.com/info/publishing_adv.asp
BioMedcentral
13. Curtis JR, Westfall AO, Allison J, Freeman A, Kovac SH, Saag KG:
Agreement and validity of pharmacy data versus self-report for use of osteoporosis medications among chronic gluco-corticoid users. Pharmacoepidemiol Drug Saf 2006, 15(10):710-718. 14. Soumerai SB, Ross-Degnan D, Avorn J, McLaughlin T, Choodnovskiy I: Effects of Medicaid drug-payment limits on admission to hospitals and nursing homes. N Engl J Med 1991,
325(15):1072-1077.
15. Miller EA, Rosenheck RA: Risk of nursing home admission in association with mental illness nationally in the Department of Veterans Affairs. Med Care 2006, 44(4):343-351.
16. Roos NP, Roos LL, Mossey J, Havens B: Using administrative data to predict important health outcomes. Entry to hospital, nursing home, and death. Med Care 1988, 26(3):221-239. 17. Friedman SM, Steinwachs DM, Rathouz PJ, Burton LC, Mukamel DB:
Characteristics predicting nursing home admission in the program of all-inclusive care for elderly people. Gerontologist
2005, 45(2):157-166.
18. Tomiak M, Berthelot JM, Guimond E, Mustard CA: Factors associ-ated with nursing-home entry for elders in Manitoba, Can-ada. J Gerontol A Biol Sci Med Sci 2000, 55(5):M279-87.
19. Baron JA, Weiderpass E: An introduction to epidemiological research with medical databases. Ann Epidemiol 2000,
10(4):200-204.
20. Sorensen HT, Sabroe S, Olsen J: A framework for evaluation of secondary data sources for epidemiological research. Int J Epi-demiol 1996, 25(2):435-442.
21. Malenka DJ, McLerran D, Roos N, Fisher ES, Wennberg JE: Using administrative data to describe casemix: a comparison with the medical record. J Clin Epidemiol 1994, 47(9):1027-1032. 22. Taylor DH Jr., Osterman J, Will Acuff S, Ostbye T: Do seniors
understand their risk of moving to a nursing home? Health Serv Res 2005, 40(3):811-828.
23. Wolinsky FD, Callahan CM, Fitzgerald JF, Johnson RJ: The risk of nursing home placement and subsequent death among older adults. J Gerontol 1992, 47(4):S173-82.
24. Magaziner J, Zimmerman S, Gruber-Baldini AL, van Doorn C, Hebel JR, German P, Burton L, Taler G, May C, Quinn CC, Port CL, Baum-garten M: Mortality and adverse health events in newly admit-ted nursing home residents with and without dementia. J Am Geriatr Soc 2005, 53(11):1858-1866.
25. Gaugler JE, Duval S, Anderson KA, Kane RL: Predicting nursing home admission in the U.S: a meta-analysis. BMC Geriatr 2007,
7:13.
26. Pressley JC, Patrick CH: Frailty bias in comorbidity risk adjust-ments of community-dwelling elderly populations. J Clin Epi-demiol 1999, 52(8):753-760.
27. Lange LL, Jacox A: Using large data bases in nursing and health policy research. J Prof Nurs 1993, 9(4):204-211.
28. Mustard C, Finlayson M, Derksen S, Berthelot JM: What deter-mines the need for nursing home admission in a universally insured population? J Health Serv Res Policy 1999, 4(4):197-203. 29. Beusterien KM, Thomas SK, Gause D, Kimel M, Arcona S, Mirski D:
Impact of rivastigmine use on the risk of nursing home place-ment in a US sample. CNS Drugs 2004, 18(15):1143-1148. 30. Adamson DM, Chang S, Hansen LG: Health research data for the
real world: The MarketScan databases. Research and Pharma-ceutical Division Thomson Medstat ; 2006.
31. Fleiss JL: Statistical methods for rates and proportions. Edited by: ed . New York , John Wiley; 1981:38 -346.
32. Szklo M, Nieto FJ: Quality assurance and control. In Epidemiology: Beyond the Basics Gaithersburg, MD , Aspen Publishers; 2000:343-404.
33. Yaffe K, Fox P, Newcomer R, Sands L, Lindquist K, Dane K, Covinsky KE: Patient and caregiver characteristics and nursing home placement in patients with dementia. JAMA 2002,
287(16):2090-2097.
Pre-publication history
The pre-publication history for this paper can be accessed here: