R E S E A R C H A R T I C L E
Open Access
Determinants of having no general
practitioner in Germany and the influence
of a migration background: results of the
German health interview and examination
survey for adults (DEGS1)
Judith Tillmann
1*, Marie-Therese Puth
1,2, Laura Frank
3, Klaus Weckbecker
1, Manuela Klaschik
1and Eva Münster
1Abstract
Background:It is aspired in the German healthcare system that general practitioners (GPs) act as initial contact for patients and guide through at all steps of medical treatment. This study aims at identifying factors associated with the odds of having no GP within the general population and especially among people with migration background. Methods:This cross-sectional analysis was based on the“German Health Interview and Examination Survey for Adults”(DEGS1) conducted by the Robert Koch Institute. Descriptive analyses as well as multiple logistic regression models were performed to analyse the impact of a migration background, age, gender, residential area,
socioeconomic status (SES) and other factors on having no GP among 7755 participants.
Results:9.5% of the total study population and 14.8% of people with a migration background had no GP, especially men, adults living in big cities and without chronic diseases. The odds of not having a GP were higher for people with a two-sided migration background (aOR: 1.90, 95% CI: 1.42–2.55). Among the population with a migration background, particularly young adults, men, people living in big cities and having a private health insurance showed higher odds to have no GP.
Conclusions:It is necessary to investigate the causes of the differing utilization of healthcare of people with a migration background and, if necessary, to take measures for an equal access to healthcare for all population groups. Further research needs to be done to evaluate how to get young people into contact with a GP.
Keywords: Migration, General practitioner, Use of health services, DEGS
Background
Ambulatory medical care in Germany is almost entirely carried out by registered physicians, comprising GPs as well as other specialized physicians [1]. These physicians treat patients, refer them to other specialists or send them to hospitals [1]. Although patients in Germany are generally free to choose their primary healthcare pro-vider, this role should mainly be assumed by general practitioners (GPs). It is aspired that GPs act as guides
at all steps of treatment [2]. Better health outcomes through GP-centered healthcare in Germany, especially among older or chronically ill patients, have already been described [3, 4]. International research has been limited to the frequency of use of GPs by the general population [5–8]. Yet it is important to initiate research earlier to find out what drives or deters people to have a GP or not. Especially the establishment of contact by people with a migration background requires particular attention as a less frequent use of healthcare in general [9,10] and delayed help-seeking behavior have been reg-istered in international studies [11,12].
* Correspondence:[email protected]
1Institute of General Practice and Family Medicine, University of Bonn, 53127
Bonn, Germany
Full list of author information is available at the end of the article
The German Federal Statistical Office (Destatis) de-fines migration background as follows: Either a person his- or herself or at least one parent is born without German nationality [13]. According to the Microcensus 2016, a representative household survey of the official statistics in Germany, 22.5% of the population in Germany shares this characteristic. A further increase in future is predicted [14]. Among this group, Turkey (15.1%), Poland (10.1%) and Russia (6.6%) represent the most common countries of origin [14]. The establish-ment of contact with primary care by people with a mi-gration background has not yet been analysed in Germany. Only very few findings about the use of healthcare services in general can be summarised: A less frequent utilization of preventative programs, for ex-ample medical examinations, preventive dentistry and flu vaccinations as well as rehabilitation measures by cit-izens with a migration background in Germany have already been described [15–17]. In Danish and Austra-lian studies more visits of emergency departments by pa-tients with a migration background have been reported [18, 19]. Barriers in access to primary care have been identified as the reason in a Danish study [19]. These findings indicate a probable misdistribution of citizens with foreign origin in the healthcare system that needs to be researched in more detail.
The aim of this study was to investigate determinants of not having a GP to visit first in case of any health problem. The focus was set on sociodemographic and health characteristics and their association with having no GP. Furthermore, it was examined whether having no GP differed between people with and without a mi-gration background and which factors were connected to that.
Methods
The German Health Interview and Examination Survey for Adults (DEGS) is part of the health monitoring car-ried out by the Robert Koch Institute (RKI) [20]. The RKI is the central federal institution responsible for dis-ease control and prevention. The most current wave (DEGS1) was conducted between November 2008 and December 2011 and included examinations, interviews and tests among 18- to 79-year-olds living in Germany. A random sample from local population registries was combined with the participants of the German National
Health Interview and Examination Survey 1998
(GNHIES98), who re-participated. In total, 8152 persons took part, among them 4193 newly invited participants (response 42%) and 3959 who had previously taken part in GNHIES98 (response 62%). The concept and design of DEGS1 have already been described in detail elsewhere [21–23]. The net sample (n= 7987) permits representative cross-sectional and time trend analyses.
In order to compensate for the empirically lower partici-pation rate of persons without German nationality, an oversampling by a factor of 1.5 was performed. In order to lower language barriers, translations of the consent forms and of the health questionnaires were offered in English, Russian, Serbo-Croatian and Turkish.
In the present analysis, having a GP or not was used as outcome measure and was assessed with the following question:“Do you have a GP to visit first in case of any health problems?”. Only by answering in the affirmative it was assumed that participants had a GP.
The migration background of a participant was consid-ered as potential influence factor on the outcome of hav-ing no GP. Within DEGS1, participants with migration background were distinguished between a one-sided and two-sided migration background. People who have im-migrated from another country and have at least one parent who was not born in Germany or adults with both parents not born in Germany were regarded as par-ticipants with a two-sided migration background. People who were born in Germany and only have one parent who was not born in Germany were considered as par-ticipants with a one-sided migration background. Partici-pants who immigrated themselves were considered to be migrants of the first generation. Those with a migration background who were born in Germany were assigned to the second generation. More details have already been published [24].
Further factors included in the analysis were age, gen-der, residential area, SES, marital status, longer working hours, general state of health, the presence of chronic diseases, type of health insurance and language skills. Knowledge of the German language was only considered for participants with migration background (Table 3). Age, residential area, marital status, general state of health and the presence of chronic diseases were classi-fied as shown in Table 1. The SES was categorised into low, medium or high status depending on the value of a multidimensional index with information on education, professional status and net household income of the par-ticipants [23]. The usual number of working hours per week was used to generate a variable (long working hours) with a cut-point at 50 h per week. Health insur-ance was grouped into statutory health insurinsur-ance, pri-vate health insurance and other (including no insurance, direct payer, foreign health insurance or any other kind of reimbursement). To enable logistic regression ana-lyses among the smaller population group of adults with a migration background, categories of the independent variables have been dichotomised (except “chronic dis-eases” because of 6% missing values) to reduce the amount of degrees of freedom.
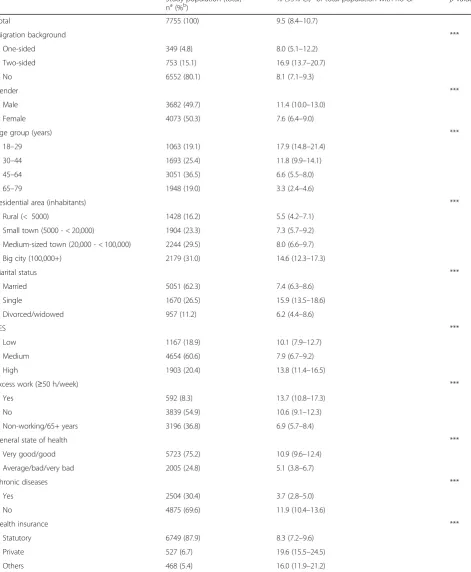
Table 1Characteristics of the study population and percentage with no GP (DEGS1) Study population (total)
na(%b) % (95% CI)
b
of total population with no GP pvaluec
Total 7755 (100) 9.5 (8.4–10.7)
Migration background ***
One-sided 349 (4.8) 8.0 (5.1–12.2)
Two-sided 753 (15.1) 16.9 (13.7–20.7)
No 6552 (80.1) 8.1 (7.1–9.3)
Gender ***
Male 3682 (49.7) 11.4 (10.0–13.0)
Female 4073 (50.3) 7.6 (6.4–9.0)
Age group (years) ***
18–29 1063 (19.1) 17.9 (14.8–21.4)
30–44 1693 (25.4) 11.8 (9.9–14.1)
45–64 3051 (36.5) 6.6 (5.5–8.0)
65–79 1948 (19.0) 3.3 (2.4–4.6)
Residential area (inhabitants) ***
Rural (< 5000) 1428 (16.2) 5.5 (4.2–7.1)
Small town (5000 - < 20,000) 1904 (23.3) 7.3 (5.7–9.2)
Medium-sized town (20,000 - < 100,000) 2244 (29.5) 8.0 (6.6–9.7)
Big city (100,000+) 2179 (31.0) 14.6 (12.3–17.3)
Marital status ***
Married 5051 (62.3) 7.4 (6.3–8.6)
Single 1670 (26.5) 15.9 (13.5–18.6)
Divorced/widowed 957 (11.2) 6.2 (4.4–8.6)
SES ***
Low 1167 (18.9) 10.1 (7.9–12.7)
Medium 4654 (60.6) 7.9 (6.7–9.2)
High 1903 (20.4) 13.8 (11.4–16.5)
Excess work (≥50 h/week) ***
Yes 592 (8.3) 13.7 (10.8–17.3)
No 3839 (54.9) 10.6 (9.1–12.3)
Non-working/65+ years 3196 (36.8) 6.9 (5.7–8.4)
General state of health ***
Very good/good 5723 (75.2) 10.9 (9.6–12.4)
Average/bad/very bad 2005 (24.8) 5.1 (3.8–6.7)
Chronic diseases ***
Yes 2504 (30.4) 3.7 (2.8–5.0)
No 4875 (69.6) 11.9 (10.4–13.6)
Health insurance ***
Statutory 6749 (87.9) 8.3 (7.2–9.6)
Private 527 (6.7) 19.6 (15.5–24.5)
Others 468 (5.4) 16.0 (11.9–21.2)
a
Unweighted n may not add up to total n due to missing responses
b
Weighted results to match the German population structure on 31th December 2010
c
between adults having and not having a GP were evalu-ated using Chi-square tests and a p-value < 0.05 was considered significant. Multiple logistic regression ana-lyses with having no GP as dependent variable were performed. Logistic regression analysis was performed for the total study population, separately for men and women and additionally with focus only on participants with migration background. Adjusted odds ratios (aOR) with 95%-CI were computed. For all independent vari-ables, missing responses were allocated to the reference category in the logistic regression analysis if they did not exceed 5% of cases. Additional analyses restricted to par-ticipants with valid data on all independent variables in regression (complete cases) showed similar results to the main analysis (see Additional files 1 and 2). To correct for any deviations of the DEGS1 study population from the German general population, analyses were weighted according to the standardised weighting factor by the Robert-Koch Institute [23]. To take into account both the weighting as well as the correlation of the partici-pants within a community, the confidence intervals were determined with SPSS-25 procedures for complex samples [25].
Results
The total number of participants aged 18 to 79 years was 7987. Of those, 232 participants were excluded from the analysis due to missing responses regarding data on having a GP. The study population included 7755 partic-ipants with a balanced sex ratio and most particpartic-ipants
aged between 45 and 64 years; 1102 (19.9%) of them had a migration background (Table1).
Having no GP was more common in adults with mi-gration background (14.8% in total) than in adults with-out migration background (8.1%) (Table3). Men (11.4%) showed significantly higher rates of having no GP than women (7.6%). Adults of the youngest age group (17.9%), adults living in big cities (14.6%) as well as sin-gle participants (15.9%) stated significantly more often to have no GP. People with low (10.1%) or high SES (13.8%) stated significantly more often to have no GP than people with a medium SES (7.9%). Having no GP was significantly less likely for adults with an average, bad or very bad general state of health (5.1%), for adults with chronic diseases (3.7%) and for adults with a statu-tory health insurance (8.3%) (Table1).
People of the first or second generation of migration more frequently had no GP than people without a mi-gration background, especially men (Fig.1).
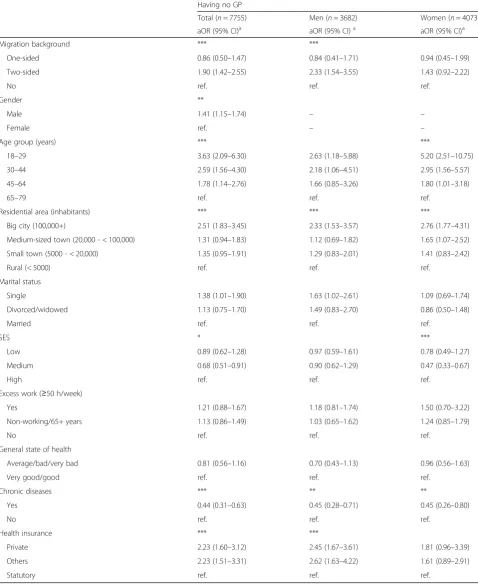
The odds of having no GP were higher for adults with a two-sided migration background than for adults with-out migration background (aOR: 1.90, 95%-CI: 1.42– 2.55) (Table2). Stratification for gender limited that sig-nificant effect to male participants with a migration background (aOR: 2.33, 95% CI: 1.54–3.55). Besides, sig-nificant effects could be identified in gender, age, resi-dential area, SES, the presence of chronic diseases and the type of health insurance. Men stated more frequently to have no GP than women (aOR: 1.41, 95% CI: 1.15– 1.74). Adults of the youngest age group were more than
[image:4.595.56.539.461.714.2]Table 2Study population: having no GP with adjusted odds ratios (aOR) and 95% confidence intervals (CI) estimated from logistic regression stratified by gender (DEGS1)
Having no GP
Total (n= 7755) Men (n= 3682) Women (n= 4073)
aOR (95% CI)a aOR (95% CI)a aOR (95% CI)a
Migration background *** ***
One-sided 0.86 (0.50–1.47) 0.84 (0.41–1.71) 0.94 (0.45–1.99)
Two-sided 1.90 (1.42–2.55) 2.33 (1.54–3.55) 1.43 (0.92–2.22)
No ref. ref. ref.
Gender **
Male 1.41 (1.15–1.74) – –
Female ref. – –
Age group (years) *** ***
18–29 3.63 (2.09–6.30) 2.63 (1.18–5.88) 5.20 (2.51–10.75)
30–44 2.59 (1.56–4.30) 2.18 (1.06–4.51) 2.95 (1.56–5.57)
45–64 1.78 (1.14–2.76) 1.66 (0.85–3.26) 1.80 (1.01–3.18)
65–79 ref. ref. ref.
Residential area (inhabitants) *** *** ***
Big city (100,000+) 2.51 (1.83–3.45) 2.33 (1.53–3.57) 2.76 (1.77–4.31)
Medium-sized town (20,000 - < 100,000) 1.31 (0.94–1.83) 1.12 (0.69–1.82) 1.65 (1.07–2.52)
Small town (5000 - < 20,000) 1.35 (0.95–1.91) 1.29 (0.83–2.01) 1.41 (0.83–2.42)
Rural (< 5000) ref. ref. ref.
Marital status
Single 1.38 (1.01–1.90) 1.63 (1.02–2.61) 1.09 (0.69–1.74)
Divorced/widowed 1.13 (0.75–1.70) 1.49 (0.83–2.70) 0.86 (0.50–1.48)
Married ref. ref. ref.
SES * ***
Low 0.89 (0.62–1.28) 0.97 (0.59–1.61) 0.78 (0.49–1.27)
Medium 0.68 (0.51–0.91) 0.90 (0.62–1.29) 0.47 (0.33–0.67)
High ref. ref. ref.
Excess work (≥50 h/week)
Yes 1.21 (0.88–1.67) 1.18 (0.81–1.74) 1.50 (0.70–3.22)
Non-working/65+ years 1.13 (0.86–1.49) 1.03 (0.65–1.62) 1.24 (0.85–1.79)
No ref. ref. ref.
General state of health
Average/bad/very bad 0.81 (0.56–1.16) 0.70 (0.43–1.13) 0.96 (0.56–1.63)
Very good/good ref. ref. ref.
Chronic diseases *** ** **
Yes 0.44 (0.31–0.63) 0.45 (0.28–0.71) 0.45 (0.26–0.80)
No ref. ref. ref.
Health insurance *** ***
Private 2.23 (1.60–3.12) 2.45 (1.67–3.61) 1.81 (0.96–3.39)
Others 2.23 (1.51–3.31) 2.62 (1.63–4.22) 1.61 (0.89–2.91)
Statutory ref. ref. ref.
a
three times as likely at risk compared to adults of the oldest age group (aOR: 3.63, 95% CI: 2.09–6.30), espe-cially women. Men and women living in big cities showed odds of having no GP more than twice as high as men and women living in rural areas (men: aOR: 2.33, 95% CI: 1.53–3.57; women: aOR: 2.76, 95% CI: 1.77–4.31). Women with medium SES had lower odds of having no GP than women with high SES. The presence of chronic diseases reduced the odds of having no GP. Men with private (aOR: 2.45, 95% CI: 1.67–3.61) or any other health insurance (aOR: 2.62, 95% CI: 1.63–4.22) showed more than a two-fold higher odds for having no GP compared to participants with statutory health insur-ance (Table2).
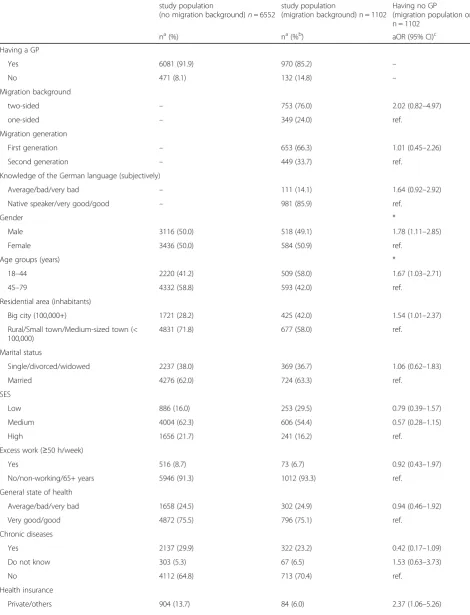
Characteristics of the population with a migration background (n= 1102) are summarised in Table 3. Two thirds were migrants of the first generation living in Germany. The larger part of the population (76.0%) had a two-sided background. 54.3% had another language than German as mother tongue but 85.9% of the partici-pants were native speakers or rated their knowledge of the German language as very good or good. In general, participants with a migration background were younger than people without a migration background and more frequently living in big cities. The amount of people with a low SES was much higher among participants with a migration background (29.5%).
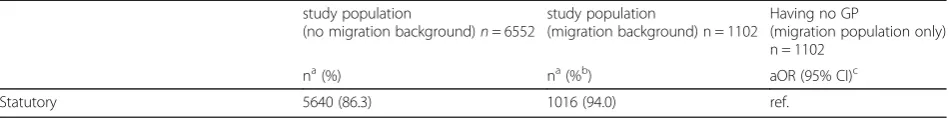
Logistic regression analyses including only people with a migration background showed significant associations between gender, age, residential area and type of health insurance and having no GP (Table3). Male participants were again more likely to have no GP (aOR: 1.78, 95% CI: 1.11–2.85) as well as young people (18–44 years) (aOR: 1.67, 95% CI: 1.03–2.71), people with a private or other health insurance (aOR: 2.37, 95% CI: 1.06–5.26) and living in big cities (aOR:1.54, 95% CI: 1.01–2.37). In a model considering only gender, age, residential area, type of health insurance and subjective knowledge of the German language, all variables showed significant influ-ences on having no GP. People without good German language skills had significant higher odds to have no GP in this model.
Discussion
As it is aspired in German healthcare that GPs are the first point of contact for people with health complaints and guide through at all steps of treatment, this study exam-ines influencing factors on not having a GP for the first time in Germany. Especially people with a two-sided migration background, young adults, men and people liv-ing in big cities showed significant higher odds of havliv-ing no GP.
A special focus has to be set on the result that people with migration background had odds of 1.61 to have no
GP compared to people without a migration back-ground. There are several possible barriers this popula-tion group may be confronted with in order to find a GP: Migrants of the first generation have to adapt to a new and often different healthcare system. Especially the importance and function of the GP differs a lot depend-ing on the country, e.g. in Turkey there was no family medicine-centered primary care till 2005 and it still dif-fers from the German system [26]. In an Austrian study, a country with a healthcare system quite similar to the German one, the migration status of participants has also been identified as a predictor for consulting special-ists without having seen a GP before. Especially men born in Turkey, also representing the most common mi-gration background in Germany, used outpatient depart-ments (OR = 3.05) or hospitals (OR = 5.00) instead of GP services [27]. It is necessary to investigate the causes and backgrounds of the differing utilization patterns of the population with a migration background for example if there is an information deficit about the healthcare sys-tem or if there are culturally manifested beliefs about healthcare use.
Table 3Comparison of study population with and without a migration background and having no GP with adjusted odds ratios (aOR) and 95% confidence intervals (CI) estimated from logistic regression (DEGS1)
study population
(no migration background)n= 6552
study population
(migration background) n = 1102
Having no GP
(migration population only) n = 1102
na(%) na(%b) aOR (95% CI)c
Having a GP
Yes 6081 (91.9) 970 (85.2) –
No 471 (8.1) 132 (14.8) –
Migration background
two-sided – 753 (76.0) 2.02 (0.82–4.97)
one-sided – 349 (24.0) ref.
Migration generation
First generation – 653 (66.3) 1.01 (0.45–2.26)
Second generation – 449 (33.7) ref.
Knowledge of the German language (subjectively)
Average/bad/very bad – 111 (14.1) 1.64 (0.92–2.92)
Native speaker/very good/good – 981 (85.9) ref.
Gender *
Male 3116 (50.0) 518 (49.1) 1.78 (1.11–2.85)
Female 3436 (50.0) 584 (50.9) ref.
Age groups (years) *
18–44 2220 (41.2) 509 (58.0) 1.67 (1.03–2.71)
45–79 4332 (58.8) 593 (42.0) ref.
Residential area (inhabitants)
Big city (100,000+) 1721 (28.2) 425 (42.0) 1.54 (1.01–2.37)
Rural/Small town/Medium-sized town (< 100,000)
4831 (71.8) 677 (58.0) ref.
Marital status
Single/divorced/widowed 2237 (38.0) 369 (36.7) 1.06 (0.62–1.83)
Married 4276 (62.0) 724 (63.3) ref.
SES
Low 886 (16.0) 253 (29.5) 0.79 (0.39–1.57)
Medium 4004 (62.3) 606 (54.4) 0.57 (0.28–1.15)
High 1656 (21.7) 241 (16.2) ref.
Excess work (≥50 h/week)
Yes 516 (8.7) 73 (6.7) 0.92 (0.43–1.97)
No/non-working/65+ years 5946 (91.3) 1012 (93.3) ref.
General state of health
Average/bad/very bad 1658 (24.5) 302 (24.9) 0.94 (0.46–1.92)
Very good/good 4872 (75.5) 796 (75.1) ref.
Chronic diseases
Yes 2137 (29.9) 322 (23.2) 0.42 (0.17–1.09)
Do not know 303 (5.3) 67 (6.5) 1.53 (0.63–3.73)
No 4112 (64.8) 713 (70.4) ref.
Health insurance
occurs in the first generation of immigrants and d-ecreases over time [40] and our results showed no sig-nificant difference between migration generations, this effect will not have a large impact.
Differences in having no GP with respect to gender were also in line with previous findings and may be ex-plained by a higher health awareness of women [41, 42]. Differences in the outcome depending on age may result from an insufficient transition process from a pediatrician to a GP and therefore more young people without a GP. Older adults may be more familiar with the German health care system and they are used to have a GP as regular point of contact in case of any medical problem. The difference between people living in urban or rural areas may be explained by the fact that medical specialists are rare in rural areas in Germany and people sometimes have no choice but to establish contact to a GP [43,44]. A medically unjusti-fied preference of patients in big cities to visit special-ists instead of GPs would be a misallocation. In contrast to results reported in most of the literature, not only participants with a low SES but also those with a high SES were less likely to have a GP, especially women [5, 6, 45]. Those with a high SES may again prefer to approach medical specialists. For adults with a low SES, the requirement to pay a “practice fee” of ten Euro, which was raised at that time, may have kept them from getting in contact with a GP.
A new aspect uncovered by the analyses is that every fifth privately insured adult did not have a GP compared to only every twelfth person with statutory health insurance. Waiting times for an appointment at a specialist for privately insured patients are significantly shorter than for statutorily insured patients [46]. In line with this, privately insured adults were found to consult specialists instead of GPs more frequently in a previous analysis of DEGS1 [47]. Further research is ne-cessary why this effect is more prevalent among men. This possible misallocation also manifests in the high number of people visiting emergency departments with minor com-plaints in Germany instead of making use of GP services [48]. It should also be taken into account that there may be participants who, although they have a GP, consult other health professionals first in the event of illness.
Limitations
DEGS1 provides a representative sample of the German population aged 18 to 79 years. Still, there is a chance that results are biased as all the information was based on self-reported data. As in many other population-based surveys, chronically ill people might be underrep-resented [22]. Besides having a GP to visit first in case of any health problems does not mean that a participant actually makes use of the services of a GP. There may also be participants who contact other medical special-ists instead of a GP in case of health problems and therefore negotiating the question. It has to be consid-ered that the DEGS1 dataset is not representative con-cerning the population with migration background. Despite an oversampling of this group and the applica-tion of translated quesapplica-tionnaires, people with migraapplica-tion background are underrepresented [23, 24]. Moreover, translated questionnaires have only been provided in a restricted number of other languages. However, accord-ing to weightaccord-ing of the data, the proportion of persons with a migration background was almost the same as in the general population (weighted: 19.9%, microcensus: 19.2%) [14]. For some variables like immigrant gener-ation the DEGS1 dataset is still biased, because people of the first generation are underrepresented. Stratifying for gender among people with migration background was not possible due to the small sample. The results concerning people with a migration background should not be generalised since there is no homogenous group. When comparing the results with international stud-ies, attention should be paid to how migrant groups are defined because there are no uniform definitions of migration terms. In the present study only the im-migrant generation and German language skills were considered as a differentiation of the migration back-ground. Indicators such as country of origin, duration and status of stay and religious orientations should be given more attention.
Conclusions
[image:8.595.65.541.110.169.2]This study, for the first time in Germany, examined the dif-ferences in frequency of having no GP among people with and without a migration background and characteristics Table 3Comparison of study population with and without a migration background and having no GP with adjusted odds ratios (aOR) and 95% confidence intervals (CI) estimated from logistic regression (DEGS1)(Continued)
study population
(no migration background)n= 6552
study population
(migration background) n = 1102
Having no GP
(migration population only) n = 1102
na(%) na(%b) aOR (95% CI)c
Statutory 5640 (86.3) 1016 (94.0) ref.
a
Unweighted n may not add up to total n due to missing responses
b
Weighted results to match the German population structure on 31th December 2010
c
that keep people to have a GP. It is necessary to investigate the causes of the differing utilization of healthcare by people with a migration background and, if necessary, to take measures for an equal access to healthcare for all population groups. Besides young citizens, people living in urban areas and privately insured citizens have to be con-sidered in detail. Further analyses are necessary to under-stand the patterns of health-seeking behaviour.
Additional files
Additional file 1:Study population: having no GP with adjusted odds ratios (aOR) and 95% confidence intervals (CI) estimated from logistic regression stratified by gender (DEGS1)–complete case analysis (n= 7111). Results of the complete case analysis (n = 7111) (DOCX 22 kb)
Additional file 2:Migration population: having no GP with adjusted odds ratios (aOR) and 95% confidence intervals (CI) estimated from logistic regression (DEGS1)–complete case analysis (n= 1001). Results of the complete case analysis (n = 1001) (DOCX 18 kb)
Abbreviations
aOR:Adjusted odds ratio; CI: Confidence interval; DEGS1: German Health Interview and Examination Survey for Adults (first wave); GP: General practitioner; SES: Socioeconomic status
Funding Not applicable.
Availability of data and materials
The dataset analysed during the current study is available from the Robert Koch Institute for researchers who meet the criteria for access [49]. Data about the migration background of participants has to be requested separately.
Author’s contributions
JT, EM and KW mainly devised the basic idea. JT wrote the manuscript, performed background research on the topic, wrote parts of the results and the discussion. MP wrote parts of the methods and results and performed the statistical analyses with contributions by JT and EM. LF wrote parts of the methods and methodical discussion and gave significant contribution to the interpretation of data. KW and MK wrote parts of the abstract and discussion and acted as advisors with medical knowledge. They gave significant contribution to the interpretation of data. EM gave substantial contributions to conception and design of the publication, advised in all important steps and revised the article critically. All authors read and approved the final manuscript and are accountable for all aspects of the work.
Ethics approval and consent to participate
Not applicable as the analysis is based on secondary data. However, DEGS1 was approved by the Charité-Universitätsmedizin Berlin ethics committee (No. EA2/047/08) and participants provided written informed consent prior to the interview and examination [22].
Consent for publication Not applicable.
Competing interests
The authors declare that they have no competing interests.
Publisher’s Note
Springer Nature remains neutral with regard to jurisdictional claims in published maps and institutional affiliations.
Author details
1Institute of General Practice and Family Medicine, University of Bonn, 53127
Bonn, Germany.2Department of Medical Biometry, Informatics and
Epidemiology (IMBIE), University Hospital of Bonn, 53127 Bonn, Germany. 3Department of Epidemiology and Health Monitoring, Robert Koch Institute,
13353 Berlin, Germany.
Received: 24 July 2018 Accepted: 27 September 2018
References
1. Döring A, Paul F. The German healthcare system. EPMA J. 2010;1:535–47.
https://doi.org/10.1007/s13167-010-0060-z.
2. Robert Koch-Institut, Statistisches Bundesamt. Health in Germany. Berlin: Robert Koch institute; Federal Statistical Office; 2008.
3. Gerlach FM, Szecsenyi J. Hausarztzentrierte Versorgung. Inhalte und Qualität sind entscheidend. Deutsches Ärzteblatt. 2011;108:996–8.
4. Freytag A, Biermann J, Ochs A, Lux G, Lehmann T, Ziegler J, et al. The impact of GP-centered healthcare. Dtsch Arztebl Int. 2016;113:791–8.https:// doi.org/10.3238/arztebl.2016.0791.
5. Fjær EL, Balaj M, Stornes P, Todd A, McNamara CL, Eikemo TA. Exploring the differences in general practitioner and health care specialist utilization according to education, occupation, income and social networks across Europe: findings from the European social survey (2014) special module on the social determinants of health. Eur J Pub Health. 2017;27:73–81.https:// doi.org/10.1093/eurpub/ckw255.
6. Jørgensen JT, Andersen JS, Tjønneland A, Andersen ZJ. Determinants related to gender differences in general practice utilization: Danish diet, Cancer and health cohort. Scand J Prim Health Care. 2016;34:240–9.https:// doi.org/10.1080/02813432.2016.1207141.
7. Hessel A, Gunzelmann T, Geyer M, Brähler E. Inanspruchnahme
medizinischer Leistungen und Medikamenteneinnahme bei über 60jährigen in Deutschland. Z Gerontol Geriatr. 2000;33:289–99.https://doi.org/10.1007/ s003910070049.
8. Schlichthorst M, Sanci LA, Pirkis J, Spittal MJ, Hocking JS. Why do men go to the doctor? Socio-demographic and lifestyle factors associated with healthcare utilisation among a cohort of Australian men. BMC Public Health. 2016;16:1028.https://doi.org/10.1186/s12889-016-3706-5.
9. Lindert J, Schouler-Ocak M, Heinz A, Priebe S. Mental health, health care utilisation of migrants in Europe. European Psychiatry. 2008;23:14–20.
https://doi.org/10.1016/S0924-9338(08)70057-9.
10. Hinton L, Franz C, Friend J. Pathways to dementia diagnosis: evidence for cross-ethnic differences. Alzheimer Dis Assoc Disord. 2004;18:134–44. 11. Mukadam N, Cooper C, Basit B, Livingston G. Why do ethnic elders present
later to UK dementia services? A qualitative study. Int Psychogeriatr. 2011; 23:1070–7.https://doi.org/10.1017/S1041610211000214.
12. Mukadam N, Cooper C, Livingston G. A systematic review of ethnicity and pathways to care in dementia. Int J Geriatr Psychiatry. 2011;26:12–20.
https://doi.org/10.1002/gps.2484.
13. Statistisches Bundesamt. Bevölkerung und ErwerbstätigkeitBevölkerung mit Migrationshintergrund: - Ergebnisse des Mikrozensus 2015. Wiesbaden: Destatis; 2016.
14. Statistisches Bundesamt. Bevölkerung und Erwerbstätigkeit: Bevölkerung mit Migrationshintergrund. Ergebnisse des Mikrozensus 2016. 2017.
15. Razum O, Brzoska P. Menschen mit Migrationshintergrund in der Rehabilitation: Zugänglichkeit und Ergebnisse. Bonn: Friedrich Ebert Stiftung; 2016.
16. Brzoska P, Voigtländer S, Spallek J, Razum O. Utilization and effectiveness of medical rehabilitation in foreign nationals residing in Germany. Eur J Epidemiol. 2010;25:651–60.https://doi.org/10.1007/s10654-010-9468-y. 17. Rommel A, Saß AC, Born S, Ellert U. Die gesundheitliche Lage von
Menschen mit Migrationshintergrund und die Bedeutung des sozioökonomischen Status: Erste Ergebnisse der Studie zur Gesundheit Erwachsener in Deutschland (DEGS1). Bundesgesundheitsblatt
Gesundheitsforschung Gesundheitsschutz. 2015;58:543–52.https://doi.org/ 10.1007/s00103-015-2145-2.
18. Mahmoud I. Immigrants and the utilization of hospital emergency departments. World J Emerg Med. 2012;3:245.https://doi.org/10.5847/wjem. j.issn.1920-8642.2012.04.001.
19. Norredam M, Mygind A, Nielsen AS, Bagger J, Krasnik A. Motivation and relevance of emergency room visits among immigrants and patients of Danish origin. Eur J Pub Health. 2007;17:497–502.https://doi.org/10.1093/ eurpub/ckl268.
Gesundheitsforschung Gesundheitsschutz. 2009;52:557–70.https://doi.org/ 10.1007/s00103-009-0843-3.
21. Gößwald A, Lange M, Dölle R, Hölling H. The first wave of the German health interview and examination survey for adults (DEGS1). Participant recruitment, fieldwork, and quality assurance. Bundesgesundheitsblatt Gesundheitsforschung Gesundheitsschutz. 2013;56:611–9.https://doi.org/10. 1007/s00103-013-1671-z.
22. Scheidt-Nave C, Kamtsiuris P, Gößwald A, Hölling H, Lange M, Busch MA, et al. German health interview and examination survey for adults (DEGS) -design, objectives and implementation of the first data collection wave. BMC Public Health. 2012;12:730.https://doi.org/10.1186/1471-2458-12-730. 23. Kamtsiuris P, Lange M, Hoffmann R, Schaffrath Rosario A, Dahm S, Kuhnert R, Kurth BM. The first wave of the German health interview and examination survey for adults (DEGS1). Sampling design, response, weighting, and representativeness. Bundesgesundheitsblatt Gesundheitsforschung Gesundheitsschutz. 2013;56:620–30.https://doi.org/10.1007/s00103-012-1650-9. 24. Saß A-C, Grüne B, Brettschneider A-K, Rommel A, Razum O, Ellert U.
Beteiligung von Menschen mit Migrationshintergrund an
Gesundheitssurveys des Robert Koch-Instituts. Bundesgesundheitsblatt Gesundheitsforschung Gesundheitsschutz. 2015;58:533–42.https://doi.org/ 10.1007/s00103-015-2146-1.
25. IBM Corp. IBM SPSS statistics 25.0. Armonk: IBM Corp; 2017.
26. Atun R. Transforming Turkey's health system--lessons for universal coverage. N Engl J Med. 2015;373:1285–9.https://doi.org/10.1056/NEJMp1410433. 27. Hoffmann K, Stein KV, Maier M, Rieder A, Dorner TE. Access points to
the different levels of health care and demographic predictors in a country without a gatekeeping system. Results of a cross-sectional study from Austria. Eur J Pub Health. 2013;23:933–9.https://doi.org/10. 1093/eurpub/ckt008.
28. Giese A, Uyar M, Uslucan HH, Becker S, Henning BF. How do hospitalised patients with Turkish migration background estimate their language skills and their comprehension of medical information - a prospective cross-sectional study and comparison to native patients in Germany to assess the language barrier and the need for translation. BMC Health Serv Res. 2013;13: 196.https://doi.org/10.1186/1472-6963-13-196.
29. Deutscher Bundestag. Dolmetscher im Rahmen der gesundheitlichen Versorgung. Anspruch und Kostenübernahme: Sachstandsbeschluss WD 9-3000-021/17. 2017.
30. Flores G. The impact of medical interpreter services on the quality of health care: a systematic review. Med Care Res Rev. 2005;62:255–99.https://doi. org/10.1177/1077558705275416.
31. Jacobs EA, Shepard DS, Suaya JA, Stone E-L. Overcoming language barriers in health care: costs and benefits of interpreter services. Am J Public Health. 2004;94:866–9.
32. Karliner LS, Jacobs EA, Chen AH, Mutha S. Do professional interpreters improve clinical care for patients with limited English proficiency? A systematic review of the literature. Health Serv Res. 2007;42:727–54.https:// doi.org/10.1111/j.1475-6773.2006.00629.x.
33. Leanza Y, Boivin I, Rosenberg E. Interruptions and resistance: a comparison of medical consultations with family and trained interpreters. Soc Sci Med. 2010;70:1888–95.https://doi.org/10.1016/j.socscimed.2010.02.036. 34. O’Donnell CA, Burns N, Mair FS, Dowrick C, Clissmann C, van den
Muijsenbergh M, et al. Reducing the health care burden for marginalised migrants: the potential role for primary care in Europe. Health Policy. 2016; 120:495–508.https://doi.org/10.1016/j.healthpol.2016.03.012.
35. Weinick RM, Krauss NA. Racial/ethnic differences in children's access to care. Am J Public Health. 2000;90:1771–4.
36. Daker-White G, Beattie AM, Gilliard J, Means R. Minority ethnic groups in dementia care: a review of service needs, service provision and models of good practice. Aging Ment Health. 2002;6:101–8.https://doi.org/10.1080/ 13607860220126835.
37. Eh K, McGill M, Wong J, Krass I. Cultural issues and other factors that affect self-management of type 2 diabetes mellitus (T2D) by Chinese immigrants in Australia. Diabetes Res Clin Pract. 2016;119:97–105.https://doi.org/10. 1016/j.diabres.2016.07.006.
38. Richter M, Hurrelmann K. Gesundheitliche Ungleichheit: Grundlagen, Probleme, Konzepte. 1st ed. Wiesbaden: VS Verlag für Sozialwissenschaften; 2006. 39. Kliewer E. Epidemiology of diseases among migrants. Int Migr. 1992;30:141–
65.https://doi.org/10.1111/j.1468-2435.1992.tb00781.x.
40. Williams R. Health and length of residence among south Asians in Glasgow: a study controlling for age. J Pub Health. 1993;15:52–60.https://doi.org/10. 1093/oxfordjournals.pubmed.a042820.
41. Hurrelmann K, Kolip P. Geschlecht, Gesundheit und Krankheit: Männer und Frauen im Vergleich. 1st ed. Bern: Huber; 2002.
42. Lange C. Daten und Fakten: Ergebnisse der Studie“Gesundheit in Deutschland aktuell 2012”. Berlin: Robert-Koch-Inst; 2014.
43. Bertelsmann Stiftung. Faktencheck Gesundheit: Regionale Verteilung von Arztsitzen (Ärztedichte). Gütersloh: Bertelsmann Stiftung; 2015.
44. Hansen H, Pohontsch NJ, Bole L, Schäfer I, Scherer M. Regional variations of perceived problems in ambulatory care from the perspective of general practitioners and their patients - an exploratory focus group study in urban and rural regions of northern Germany. BMC Fam Pract. 2017;18:68.https:// doi.org/10.1186/s12875-017-0637-x.
45. Kert S,Švab I, Sever M, MakivićI, PavličDR. A cross-sectional study of socio-demographic factors associated with patient access to primary care in Slovenia. Int J Equity Health. 2015;14:39.https://doi.org/10.1186/s12939-015-0166-y. 46. Sundmacher L, Kopetsch T. Waiting times in the ambulatory sector--the
case of chronically ill patients. Int J Equity Health. 2013;12:77.https://doi. org/10.1186/1475-9276-12-77.
47. Rattay P, Butschalowsky H, Rommel A, Prütz F, Jordan S, Nowossadeck E, et al. Inanspruchnahme der ambulanten und stationären medizinischen Versorgung in Deutschland: Ergebnisse der Studie zur Gesundheit Erwachsener in Deutschland (DEGS1). Bundesgesundheitsblatt
Gesundheitsforschung Gesundheitsschutz. 2013;56:832–44.https://doi.org/ 10.1007/s00103-013-1665-x.
48. Scherer M, Lühmann D, Kazek A, Hansen H, Schäfer I. Patienten in Notfallambulanzen: Querschnittstudie zur subjektiv empfundenen Behandlungsdringlichkeit und zu den Motiven, die Notfallambulanzen von Krankenhäusern aufzusuchen. Deutsches Ärzteblatt. 2017;114:645–52. 49. Robert Koch-Institut. Abteilung für Epidemiologie und