Page 1 of 13
Open Access
Research article
Patient characteristics associated with differences in patients'
evaluation of their general practitioner
Hanne Nørgaard Heje*, Peter Vedsted, Ineta Sokolowski and Frede Olesen
Address: The Research Unit for General Practice, University of Aarhus, Aarhus, Denmark
Email: Hanne Nørgaard Heje* - [email protected]; Peter Vedsted - [email protected]; Ineta Sokolowski - [email protected]; Frede Olesen - [email protected]
* Corresponding author
Abstract
Background: Knowledge of the extent to which patient characteristics are systematically associated with variation in patient evaluations will enable us to adjust for differences between practice populations and thereby compare GPs. Whether this is appropriate depends on the purpose for which the patient evaluation was conducted. Associations between evaluations and patient characteristics may reflect gaps in the quality of care or may be due to inherent characteristics of the patients. This study aimed to determine such associations in a setting with a comprehensive list system and gate-keeping.
Methods: A nationwide Danish patient evaluation survey among voluntarily participating GPs using the EUROPEP questionnaire, which produced 28,260 patient evaluations (response rate 77.3%) of 365 GPs. In our analyses we compared the prevalence of positive evaluations in groups of patients.
Results: We found a positive GP assessment to be strongly associated with increasing patient age and increasing frequency of attendance. Patients reporting a chronic condition were more positive, whereas a low self-rated health was strongly associated with less positive scores also after adjustment. The association between patient gender and assessment was weak and inconsistent and depended on the focus. We found no association either with the patients' educational level or with the duration of listing with the GP even after adjusting for patient characteristics.
Conclusion: Adjustment for patient differences may produce a more fair comparison between GPs, but may also blur the assessment of GPs' ability to meet the needs of the populations actually served. On the other hand, adjusted results will enable us to describe the significance of specific patient characteristics to patients' experience of care.
Background
Patient evaluations of care are increasingly being included in systematic assessments aimed at improving the quality of general practice. The extent to which patients are able to assess the technical quality of care is being debated
[1,2], however, when the focus is on doctor-patient rela-tionships, patients' experience is an obvious and valuable assessment tool [3,4]. Besides, WHO defines a high degree of patient satisfaction as one of five criteria for good health care quality [5].
Published: 20 August 2008
BMC Health Services Research 2008, 8:178 doi:10.1186/1472-6963-8-178
Received: 14 January 2008 Accepted: 20 August 2008
This article is available from: http://www.biomedcentral.com/1472-6963/8/178
© 2008 Heje et al; licensee BioMed Central Ltd.
Page 2 of 13
Variation in patient evaluations of general practice reflects differences between the evaluated general practitioners (GPs) and their practices, and between the patients them-selves.
A patient's evaluation is shaped by the actual contents and quality of the contacts over time, the patient's experience of the contact, his or her expectations, former experience, needs and the reason for the encounter. These aspects are also influenced by external factors such as family and friends, press and official (health) authorities and the cul-tural and historical setting at the time of the patient's life [6,7].
Knowledge of the extent to which patient characteristics are systematically associated with variation in patient evaluations will help to discover possible gaps in the qual-ity of care and also enable us to adjust for differences between practice populations and thereby compare GPs. In addition, we will be able to calculate the variation attributable to GP factors. On the other hand adjustment for patient characteristics will blur the GPs' ability to tailor care according to the individual patient [8,9].
Many studies and reviews have explored associations between patients' evaluation of care and their characteris-tics. The most consistent finding is that older patients and patients with a low educational level rate care higher than younger patients and better educated patients [2,4,6,10-14]. While many studies find no gender difference in the assessment of the GP, a few studies report women to be more satisfied with care than men [4,10]. Similar results are reported regarding patients' socioeconomic status with a few studies reporting patients with a high socioeco-nomic status being a little more satisfied compared with less well off patients [6,11]. Diverging associations between patients' health and their care assessment have also been described [14].
Earlier studies have been carried out in different settings like hospital, outpatient clinics and general practice thus making comparisons irrelevant. The applied instruments have been of a varying quality and often study popula-tions have often been small [15]. Some authors have set out to measure patients' satisfaction with care, although a proper theory for the construct "satisfaction" has never been worked out [1]. A European tool for patients' assess-ment of specific aspects of general practice care, the EUROPEP instrument, was developed through the 1990s [16,17] on the basis of patients' care priorities [18] and refined through a strict validation procedure [19]. The 23 items are displayed in [see Additional file 1].
Patients' assessment of specific aspects of care may be shaped by the context including the health care
organisa-tion which reduces the transferability of standards between organisations. The Danish health care system is based on self-employed GPs working as gatekeepers for the public health services on a contract basis serving patients on their lists (a brief introduction to the Danish general practice is given in [see Additional file 2]).
This study aimed to determine to which extent variations in patients' evaluation of the GPs were associated with the patients' gender, age, health, educational level, frequency of attendance and adherence to the GP in a setting with a comprehensive list system and gate-keeping.
Methods
Study populationIn 2002–4 all 2181 GPs from ten Danish counties were invited to carry out patient evaluations of their practices. A total of 365 GPs (16–34% of all GPs in these counties) signed in. The participating GPs handed out question-naires to 100 successive patients seen in the surgery or at home visits. The patients were at least 18 years of age, were listed in the practice and were able to read and write Dan-ish. They were informed that their replies were anony-mous to the doctor. Each questionnaire was identified by a serial number connecting it with the GP who handed it out and to the patient. If the GP had not handed out all questionnaires within two weeks, (s)he returned the rest to the project secretariat for registration.
The patients were asked to assess the GP they considered to be their personal GP based on their contact experience over the past 12 months. They were also asked to write the GP's name on the questionnaire to confirm which GP was assessed and to allow individual assessment of GPs in partnership practices. The questionnaires were returned by the patients in prepaid envelopes to the project secre-tariat.
In order to be able to carry out the reminder procedure the GPs registered the names, addresses and serial numbers from the questionnaires handed out. Reminders with new questionnaires were sent to non-responding patients three to five weeks after the GPs' distribution of the patient-questionnaires and the patient lists were thereafter destroyed.
The questionnaire
Page 3 of 13
with "acceptable" as the middle value. Alternatively, the patients could choose a sixth category "not able to answer/not relevant". The questionnaire also included questions about the patient's gender, age, educational level, frequency of attendance to a general practice for the previous 12 months, time listed with the GP, self-rated health and chronic conditions.
In the project secretariat we coded the diagnoses reported by patients with chronic conditions according to the major ICPC-2 groups [20] with the label K for cardiovas-cular, R for respiratory and T for endocrine diseases along with two ad hoc-groups labelled C for patients reporting cancer diagnoses and M for patients with multiple diag-noses.
Assessments of the GPs
Within each dimension, a patients' evaluation was included only if 50% or more of the items had been answered in one of the six categories. An answer was con-sidered positive if it fell in one of the two most favourable categories. The assessment of the dimension was catego-rised as 100%, 50–99% or 0–49% positive depending on how many of the items marked on the 5-point Likert scale were positive. We compared the prevalences of assess-ments in the 100%-category between strata and the prev-alences in the 0–49%-category, respectively. We excluded responses from patients not indicating which GP they assessed or assessing non-participating GPs from our anal-yses.
Patient characteristics
The patients' age was calculated on the basis of their year of birth and the year of assessment. The patients were grouped into 13 five-year age categories. The patients' level of further education (theoretical education or for-malized vocational training after grammar or high school) were categorised as none, less than 2, 2–4 or 5 or more years. Patients undergoing education and patients who could not specify the length of their education formed a separate category. The frequency of attending a GP and the duration of the patient's listing with a particular GP or practice were included as categorical variables (Table 1). Self-rated health was included with its five categories (excellent, very good, good, poor and bad [21]). Patients with chronic conditions were grouped according to the ICPC main category.
Statistics
We investigated univariate associations between the patient characteristics and the assessment scores for each of the five dimensions, accounting for the clustering of patients by GPs [22]. Prevalence ratios (PR) with 95%-confidence intervals (95% CI) were preferred to odds ratios (OR) which would tend to overestimate the
associ-Table 1: Distribution of characteristics among participating patients.
N %
Gender
N = 27313 Female 18985 69.5
Male 8328 30.5
Age (years)
N = 27379 18–24 1284 4.7
25–29 2296 8.4 30–34 3060 11.2 35–39 2872 10.5 40–44 2392 8.7 45–49 1988 7.3 50–54 2169 7.9 55–59 2376 8.7 60–64 2109 7.7 65–69 1945 7.1 70–74 1813 6.6 75–79 1551 5.7 80+ 1524 5.6
Further education (years)
N = 25870 None 4766 18.4
Less than 2 2019 7.8 2–4 14094 54.5 5 or more 3591 13.9 Undergoing education or other 1400 5.4
Frequency of attendance (last 12 months)
N = 25860 0–1 2434 9.4
2–3 7848 30.4 4–5 6535 25.3 6–7 3534 13.7 8–9 1840 7.1 10+ 3669 14.2
Duration of listing with the GP (years)
N = 18134 Less than 1 1431 7.9
1–2 2065 11.4 3–7 5600 30.9 8–12 3962 21.9 13+ 5076 28.0
Self-rated health
N = 27087 Excellent 2350 8.7
Very good 8121 30.0 Good 10488 38.7 Fair 5141 19.0 Poor 987 3.6
Chronic condition
N = 26801 No 13703 51.1
Yes-KRTC1 4509 16.8 Yes-other or multiple 8589 32.1
Chronic condition
N = 182122 None 13703 72.1
K – Cardiovascular 2029 10.7 R – Respiratory 1095 5.8 T – Endocrine 1085 5.7 C – Cancer 300 1.6
1 Reported conditions categorised according to ICPC-2 main categories: K, R and T and the ad hoc-category C (cancer).
[image:3.612.311.551.113.702.2]Page 4 of 13
ations because the prevalence of the variables was high [23,24]. We used generalised linear models (GLM) with log link for Bernoulli family, i.e., modelling the PR. Because of the high prevalence, some of the adjusted GLM analyses could not converge with the Bernoulli family. In these situations we used Poisson regression with robust variance [25]. Furthermore, we adjusted for confounders associated with both assessment and patient characteris-tics. We found correlations (Pearson's correlation coeffi-cient) between age and frequency of attendance and self-rated health, and accordingly adjusted for these three var-iables adding gender to the multiple regression analyses. Even though significantly associated with assessment, educational level was not correlated with other patient characteristics and we chose not to adjust for it in the model. Due to relatively high collinearity, we chose to adjust for self-rated health rather than for chronic condi-tions. In these analyses we also accounted for the cluster-ing of patients. Analyses were performed uscluster-ing complete data only, i.e., the univariate and the GLM analyses were performed using the same data set. We used Stata 9.1 for data processing [26].
Ethical approval
Questionnaire surveys such as the present study do not fall within the scope of The Danish National Committee on Biomedical research Ethics. Therefore, we did not need any ethical approval to carry out this study.
Informed consent
The participation in this study of both the doctors and the patients was voluntary. The data in this study derive entirely from the evaluation of doctors who had responded to an individual participation to be evaluated by the patients. The patients were asked to answer the questionnaire and as such were free not to do so. The patients knew that aggregated and anonymised replies were fed back to the doctors.
Results
The GPs distributed a total of 36,561 questionnaires. Valid responses were obtained from 28,260 patients (response rate 77.3%). More than twice as many respond-ents were female (Table 1) which reflects that women attend a GP twice as often as men [27] and that women are more prone to respond to questionnaires than men (Heje et al., submitted).
Gender differences in assessments (Tables 2, 3, 4, 5, 6 (one table per dimension)) were statistically significant, but numerically quite small. Adjusted analysis showed that male patients assessed "medical care" and "informa-tion and support" less favourably, but "organisa"informa-tion of care" more favourably than female patients. In all dimen-sions the scores increased statistically significantly with
increasing patient age. This trend was robust to adjusting. In all dimensions but "medical care", crude PRs for posi-tive evaluations tended to decline with a rising level of education, but this association was eliminated by adjust-ing.
Scores for all dimensions rose with an increasing fre-quency of attendance. Adjustment for patient characteris-tics eliminated this association for "medical care", but not for the other dimension. Scores also tended to increase the longer time the patients had been listed with the GP, but not after adjusting for confounding patient characteristics.
We found consistent, statistically significantly decreasing scores with decreasing self-rated health in all dimensions which was even more pronounced after controlling for confounders.
Patients reporting a chronic condition gave more positive assessments of their GP – the most positive being the patients with "KRTC-conditions". The associations were modified but not eliminated upon adjustment except for "accessibility" where we found no association.
Discussion
We found a positive GP assessment to be associated with increasing patient age and increasing frequency of attend-ance. Patients reporting a chronic condition were more positive, whereas a poor self-rated health was strongly associated with less positive scores also after adjustment. The association between patient gender and assessment was weak and inconsistent and depended on the focus. We found no association either with the patients' educa-tional level or with the duration of listing with the GP even after adjusting for patient characteristics.
This project was part of a larger national patient evalua-tion project, which may have introduced some sources of bias. Thus, all GPs in the involved counties were invited and those who signed in may not necessarily be a repre-sentative sample. The method for patient inclusion would ideally secure a random sample of the doctor-seeking part of the listed patients where frequently attending patients, evidently, would be overrepresented. We do not know to what extent GPs forgot to hand out questionnaires or even if they more systematically let some patients out. How-ever, in this study we focused on adjusted associations between assessments and patient characteristics. Selection bias would therefore seem to have a smaller impact than if we had studied actual levels of assessment.
Page 5 of 13
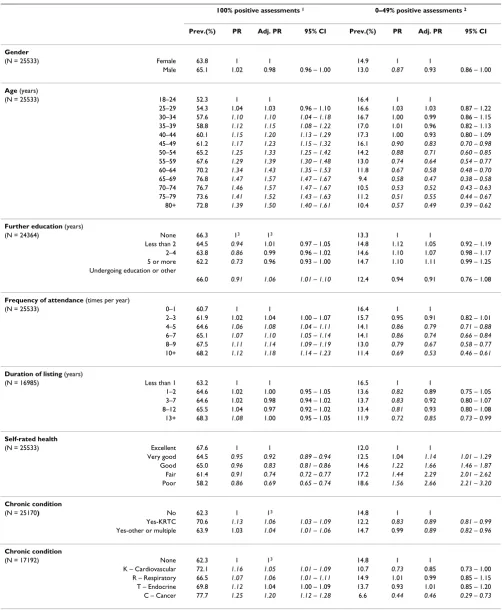
Table 2: Dimension 1: Crude and adjusted associations between patient characteristics and patients' evaluation of aspects of the doctor-patient relationship.
100% positive assessments 1 0–49% positive assessments 2
Prev.(%) PR Adj. PR 95% CI Prev.(%) PR Adj. PR 95% CI
Gender
(N = 25533) Female 63.8 1 1 14.9 1 1
Male 65.1 1.02 0.98 0.96 – 1.00 13.0 0.87 0.93 0.86 – 1.00
Age (years)
(N = 25533) 18–24 52.3 1 1 16.4 1 1
25–29 54.3 1.04 1.03 0.96 – 1.10 16.6 1.03 1.03 0.87 – 1.22 30–34 57.6 1.10 1.10 1.04 – 1.18 16.7 1.00 0.99 0.86 – 1.15 35–39 58.8 1.12 1.15 1.08 – 1.22 17.0 1.01 0.96 0.82 – 1.13 40–44 60.1 1.15 1.20 1.13 – 1.29 17.3 1.00 0.93 0.80 – 1.09 45–49 61.2 1.17 1.23 1.15 – 1.32 16.1 0.90 0.83 0.70 – 0.98
50–54 65.2 1.25 1.33 1.25 – 1.42 14.2 0.88 0.71 0.60 – 0.85
55–59 67.6 1.29 1.39 1.30 – 1.48 13.0 0.74 0.64 0.54 – 0.77
60–64 70.2 1.34 1.43 1.35 – 1.53 11.8 0.67 0.58 0.48 – 0.70
65–69 76.8 1.47 1.57 1.47 – 1.67 9.4 0.58 0.47 0.38 – 0.58
70–74 76.7 1.46 1.57 1.47 – 1.67 10.5 0.53 0.52 0.43 – 0.63
75–79 73.6 1.41 1.52 1.43 – 1.63 11.2 0.51 0.55 0.44 – 0.67
80+ 72.8 1.39 1.50 1.40 – 1.61 10.4 0.57 0.49 0.39 – 0.62
Further education (years)
(N = 24364) None 66.3 13 13 13.3 1 1
Less than 2 64.5 0.94 1.01 0.97 – 1.05 14.8 1.12 1.05 0.92 – 1.19 2–4 63.8 0.86 0.99 0.96 – 1.02 14.6 1.10 1.07 0.98 – 1.17 5 or more 62.2 0.73 0.96 0.93 – 1.00 14.7 1.10 1.11 0.99 – 1.25 Undergoing education or other
66.0 0.91 1.06 1.01 – 1.10 12.4 0.94 0.91 0.76 – 1.08
Frequency of attendance (times per year)
(N = 25533) 0–1 60.7 1 1 16.4 1 1
2–3 61.9 1.02 1.04 1.00 – 1.07 15.7 0.95 0.91 0.82 – 1.01 4–5 64.6 1.06 1.08 1.04 – 1.11 14.1 0.86 0.79 0.71 – 0.88
6–7 65.1 1.07 1.10 1.05 – 1.14 14.1 0.86 0.74 0.66 – 0.84
8–9 67.5 1.11 1.14 1.09 – 1.19 13.0 0.79 0.67 0.58 – 0.77
10+ 68.2 1.12 1.18 1.14 – 1.23 11.4 0.69 0.53 0.46 – 0.61
Duration of listing (years)
(N = 16985) Less than 1 63.2 1 1 16.5 1 1
1–2 64.6 1.02 1.00 0.95 – 1.05 13.6 0.82 0.89 0.75 – 1.05 3–7 64.6 1.02 0.98 0.94 – 1.02 13.7 0.83 0.92 0.80 – 1.07 8–12 65.5 1.04 0.97 0.92 – 1.02 13.4 0.81 0.93 0.80 – 1.08 13+ 68.3 1.08 1.00 0.95 – 1.05 11.9 0.72 0.85 0.73 – 0.99
Self-rated health
(N = 25533) Excellent 67.6 1 1 12.0 1 1
Very good 64.5 0.95 0.92 0.89 – 0.94 12.5 1.04 1.14 1.01 – 1.29
Good 65.0 0.96 0.83 0.81 – 0.86 14.6 1.22 1.66 1.46 – 1.87
Fair 61.4 0.91 0.74 0.72 – 0.77 17.2 1.44 2.29 2.01 – 2.62
Poor 58.2 0.86 0.69 0.65 – 0.74 18.6 1.56 2.66 2.21 – 3.20
Chronic condition
(N = 25170) No 62.3 1 13 14.8 1 1
Yes-KRTC 70.6 1.13 1.06 1.03 – 1.09 12.2 0.83 0.89 0.81 – 0.99
Yes-other or multiple 63.9 1.03 1.04 1.01 – 1.06 14.7 0.99 0.89 0.82 – 0.96
Chronic condition
(N = 17192) None 62.3 1 13 14.8 1 1
K – Cardiovascular 72.1 1.16 1.05 1.01 – 1.09 10.7 0.73 0.85 0.73 – 1.00 R – Respiratory 66.5 1.07 1.06 1.01 – 1.11 14.9 1.01 0.99 0.85 – 1.15 T – Endocrine 69.8 1.12 1.04 1.00 – 1.09 13.7 0.93 1.01 0.85 – 1.20 C – Cancer 77.7 1.25 1.20 1.12 – 1.28 6.6 0.44 0.46 0.29 – 0.73 Prevalence ratio (PR) for 100% positive assessments and for 0–49% positive assessments associated with different patient characteristics. Crude PRs are adjusted for clustering of patients. Adjusted PRs are adjusted for patients' gender, age, frequency of attending a GP, self-rated health and clustering of frequency patients. Numbers in italics are used to indicate statistical significance.
1 Patients who marked 100% of the answered questions in one of the two most positive answering categories.
Page 6 of 13
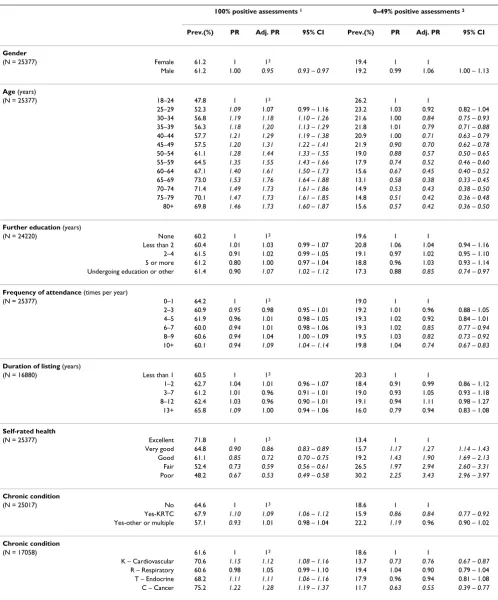
Table 3: Dimension 2: Crude and adjusted associations between patient characteristics and patients' evaluation of aspects of the medical care.
100% positive assessments 1 0–49% positive assessments 2
Prev.(%) PR Adj. PR 95% CI Prev.(%) PR Adj. PR 95% CI
Gender
(N = 25377) Female 61.2 1 13 19.4 1 1
Male 61.2 1.00 0.95 0.93 – 0.97 19.2 0.99 1.06 1.00 – 1.13
Age (years)
(N = 25377) 18–24 47.8 1 13 26.2 1 1
25–29 52.3 1.09 1.07 0.99 – 1.16 23.2 1.03 0.92 0.82 – 1.04 30–34 56.8 1.19 1.18 1.10 – 1.26 21.6 1.00 0.84 0.75 – 0.93
35–39 56.3 1.18 1.20 1.13 – 1.29 21.8 1.01 0.79 0.71 – 0.88
40–44 57.7 1.21 1.29 1.19 – 1.38 20.9 1.00 0.71 0.63 – 0.79
45–49 57.5 1.20 1.31 1.22 – 1.41 21.9 0.90 0.70 0.62 – 0.78
50–54 61.1 1.28 1.44 1.33 – 1.55 19.0 0.88 0.57 0.50 – 0.65
55–59 64.5 1.35 1.55 1.43 – 1.66 17.9 0.74 0.52 0.46 – 0.60
60–64 67.1 1.40 1.61 1.50 – 1.73 15.6 0.67 0.45 0.40 – 0.52
65–69 73.0 1.53 1.76 1.64 – 1.88 13.1 0.58 0.38 0.33 – 0.45
70–74 71.4 1.49 1.73 1.61 – 1.86 14.9 0.53 0.43 0.38 – 0.50
75–79 70.1 1.47 1.73 1.61 – 1.85 14.8 0.51 0.42 0.36 – 0.48
80+ 69.8 1.46 1.73 1.60 – 1.87 15.6 0.57 0.42 0.36 – 0.50
Further education (years)
(N = 24220) None 60.2 1 13 19.6 1 1
Less than 2 60.4 1.01 1.03 0.99 – 1.07 20.8 1.06 1.04 0.94 – 1.16 2–4 61.5 0.91 1.02 0.99 – 1.05 19.1 0.97 1.02 0.95 – 1.10 5 or more 61.2 0.80 1.00 0.97 – 1.04 18.8 0.96 1.03 0.93 – 1.14 Undergoing education or other 61.4 0.90 1.07 1.02 – 1.12 17.3 0.88 0.85 0.74 – 0.97
Frequency of attendance (times per year)
(N = 25377) 0–1 64.2 1 13 19.0 1 1
2–3 60.9 0.95 0.98 0.95 – 1.01 19.2 1.01 0.96 0.88 – 1.05 4–5 61.9 0.96 1.01 0.98 – 1.05 19.3 1.02 0.92 0.84 – 1.01 6–7 60.0 0.94 1.01 0.98 – 1.06 19.3 1.02 0.85 0.77 – 0.94
8–9 60.6 0.94 1.04 1.00 – 1.09 19.5 1.03 0.82 0.73 – 0.92
10+ 60.1 0.94 1.09 1.04 – 1.14 19.8 1.04 0.74 0.67 – 0.83
Duration of listing (years)
(N = 16880) Less than 1 60.5 1 13 20.3 1 1
1–2 62.7 1.04 1.01 0.96 – 1.07 18.4 0.91 0.99 0.86 – 1.12 3–7 61.2 1.01 0.96 0.91 – 1.01 19.0 0.93 1.05 0.93 – 1.18 8–12 62.4 1.03 0.96 0.90 – 1.01 19.1 0.94 1.11 0.98 – 1.27 13+ 65.8 1.09 1.00 0.94 – 1.06 16.0 0.79 0.94 0.83 – 1.08
Self-rated health
(N = 25377) Excellent 71.8 1 13 13.4 1 1
Very good 64.8 0.90 0.86 0.83 – 0.89 15.7 1.17 1.27 1.14 – 1.43
Good 61.1 0.85 0.72 0.70 – 0.75 19.2 1.43 1.90 1.69 – 2.13
Fair 52.4 0.73 0.59 0.56 – 0.61 26.5 1.97 2.94 2.60 – 3.31
Poor 48.2 0.67 0.53 0.49 – 0.58 30.2 2.25 3.43 2.96 – 3.97
Chronic condition
(N = 25017) No 64.6 1 13 18.6 1 1
Yes-KRTC 67.9 1.10 1.09 1.06 – 1.12 15.9 0.86 0.84 0.77 – 0.92
Yes-other or multiple 57.1 0.93 1.01 0.98 – 1.04 22.2 1.19 0.96 0.90 – 1.02
Chronic condition
(N = 17058) 61.6 1 13 18.6 1 1
K – Cardiovascular 70.6 1.15 1.12 1.08 – 1.16 13.7 0.73 0.76 0.67 – 0.87
R – Respiratory 60.6 0.98 1.05 0.99 – 1.10 19.4 1.04 0.90 0.79 – 1.04 T – Endocrine 68.2 1.11 1.11 1.06 – 1.16 17.9 0.96 0.94 0.81 – 1.08 C – Cancer 75.2 1.22 1.28 1.19 – 1.37 11.7 0.63 0.55 0.39 – 0.77 Prevalence ratio (PR) for 100% positive assessments and for 0–49% positive assessments associated with different patient characteristics. Crude PRs are adjusted for clustering of patients. Adjusted PRs are adjusted for patients' gender, age, frequency of attending a GP, self -rated health and clustering of frequency patients. Numbers in italics are used to indicate statistical significance.
1 Patients who marked 100% of the answered questions in one of the two most positive answering categories.
Page 7 of 13
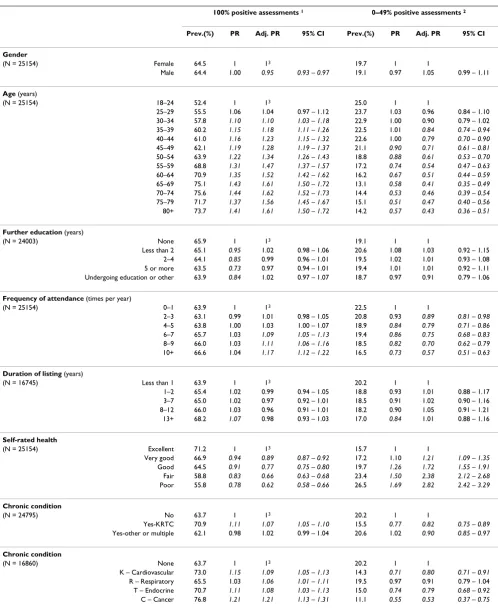
Table 4: Dimension 3: Crude and adjusted associations between patient characteristics and patients' evaluation of aspects of the information and support.
100% positive assessments 1 0–49% positive assessments 2
Prev.(%) PR Adj. PR 95% CI Prev.(%) PR Adj. PR 95% CI
Gender
(N = 25154) Female 64.5 1 13 19.7 1 1
Male 64.4 1.00 0.95 0.93 – 0.97 19.1 0.97 1.05 0.99 – 1.11
Age (years)
(N = 25154) 18–24 52.4 1 13 25.0 1 1
25–29 55.5 1.06 1.04 0.97 – 1.12 23.7 1.03 0.96 0.84 – 1.10 30–34 57.8 1.10 1.10 1.03 – 1.18 22.9 1.00 0.90 0.79 – 1.02 35–39 60.2 1.15 1.18 1.11 – 1.26 22.5 1.01 0.84 0.74 – 0.94
40–44 61.0 1.16 1.23 1.15 – 1.32 22.6 1.00 0.79 0.70 – 0.90
45–49 62.1 1.19 1.28 1.19 – 1.37 21.1 0.90 0.71 0.61 – 0.81
50–54 63.9 1.22 1.34 1.26 – 1.43 18.8 0.88 0.61 0.53 – 0.70
55–59 68.8 1.31 1.47 1.37 – 1.57 17.2 0.74 0.54 0.47 – 0.63
60–64 70.9 1.35 1.52 1.42 – 1.62 16.2 0.67 0.51 0.44 – 0.59
65–69 75.1 1.43 1.61 1.50 – 1.72 13.1 0.58 0.41 0.35 – 0.49
70–74 75.6 1.44 1.62 1.52 – 1.73 14.4 0.53 0.46 0.39 – 0.54
75–79 71.7 1.37 1.56 1.45 – 1.67 15.1 0.51 0.47 0.40 – 0.56
80+ 73.7 1.41 1.61 1.50 – 1.72 14.2 0.57 0.43 0.36 – 0.51
Further education (years)
(N = 24003) None 65.9 1 13 19.1 1 1
Less than 2 65.1 0.95 1.02 0.98 – 1.06 20.6 1.08 1.03 0.92 – 1.15 2–4 64.1 0.85 0.99 0.96 – 1.01 19.5 1.02 1.01 0.93 – 1.08 5 or more 63.5 0.73 0.97 0.94 – 1.01 19.4 1.01 1.01 0.92 – 1.11 Undergoing education or other 63.9 0.84 1.02 0.97 – 1.07 18.7 0.97 0.91 0.79 – 1.06
Frequency of attendance (times per year)
(N = 25154) 0–1 63.9 1 13 22.5 1 1
2–3 63.1 0.99 1.01 0.98 – 1.05 20.8 0.93 0.89 0.81 – 0.98
4–5 63.8 1.00 1.03 1.00 – 1.07 18.9 0.84 0.79 0.71 – 0.86
6–7 65.7 1.03 1.09 1.05 – 1.13 19.4 0.86 0.75 0.68 – 0.83
8–9 66.0 1.03 1.11 1.06 – 1.16 18.5 0.82 0.70 0.62 – 0.79
10+ 66.6 1.04 1.17 1.12 – 1.22 16.5 0.73 0.57 0.51 – 0.63
Duration of listing (years)
(N = 16745) Less than 1 63.9 1 13 20.2 1 1
1–2 65.4 1.02 0.99 0.94 – 1.05 18.8 0.93 1.01 0.88 – 1.17 3–7 65.0 1.02 0.97 0.92 – 1.01 18.5 0.91 1.02 0.90 – 1.16 8–12 66.0 1.03 0.96 0.91 – 1.01 18.2 0.90 1.05 0.91 – 1.21 13+ 68.2 1.07 0.98 0.93 – 1.03 17.0 0.84 1.01 0.88 – 1.16
Self-rated health
(N = 25154) Excellent 71.2 1 13 15.7 1 1
Very good 66.9 0.94 0.89 0.87 – 0.92 17.2 1.10 1.21 1.09 – 1.35
Good 64.5 0.91 0.77 0.75 – 0.80 19.7 1.26 1.72 1.55 – 1.91
Fair 58.8 0.83 0.66 0.63 – 0.68 23.4 1.50 2.38 2.12 – 2.68
Poor 55.8 0.78 0.62 0.58 – 0.66 26.5 1.69 2.82 2.42 – 3.29
Chronic condition
(N = 24795) No 63.7 1 13 20.2 1 1
Yes-KRTC 70.9 1.11 1.07 1.05 – 1.10 15.5 0.77 0.82 0.75 – 0.89
Yes-other or multiple 62.1 0.98 1.02 0.99 – 1.04 20.6 1.02 0.90 0.85 – 0.97
Chronic condition
(N = 16860) None 63.7 1 13 20.2 1 1
K – Cardiovascular 73.0 1.15 1.09 1.05 – 1.13 14.3 0.71 0.80 0.71 – 0.91
R – Respiratory 65.5 1.03 1.06 1.01 – 1.11 19.5 0.97 0.91 0.79 – 1.04 T – Endocrine 70.7 1.11 1.08 1.03 – 1.13 15.0 0.74 0.79 0.68 – 0.92
C – Cancer 76.8 1.21 1.21 1.13 – 1.31 11.1 0.55 0.53 0.37 – 0.75 Prevalence ratio (PR) for 100% positive assessments and for 0–49% positive assessments associated with different patient characteristics. Crude PRs are adjusted for clustering of patients. Adjusted PRs are adjusted for patients' gender, age, frequency of attending a GP, self -rated health and clustering of frequency patients. Numbers in italics are used to indicate statistical significance.
1 Patients who marked 100% of the answered questions in one of the two most positive answering categories.
Page 8 of 13
Table 5: Dimension 4: Crude and adjusted associations between patient characteristics and patients' evaluation of aspects of the organisation of care.
100% positive assessments 1 0–49% positive assessments 2
Prev.(%) PR Adj. PR 95% CI Prev.(%) PR Adj. PR 95% CI
Gender
(N = 24154) Female 64.5 1 13 23.4 1 1
Male 68.3 1.06 1.01 0.99 – 1.03 19.4 0.83 0.91 0.85 – 0.96
Age (years)
(N = 24154) 18–24 58.4 1 13 28.1 1 1
25–29 55.8 0.96 0.95 0.89 – 1.01 28.9 1.03 1.04 0.93 – 1.17 30–34 58.6 1.00 1.00 0.95 – 1.07 27.0 1.00 0.94 0.84 – 1.05 35–39 60.0 1.03 1.05 0.99 – 1.11 25.2 1.01 0.85 0.76 – 0.95
40–44 62.0 1.06 1.11 1.04 – 1.18 24.3 1.00 0.78 0.69 – 0.89
45–49 61.8 1.06 1.12 1.05 – 1.19 25.3 0.90 0.80 0.70 – 0.91
50–54 65.5 1.12 1.20 1.13 – 1.28 22.2 0.88 0.68 0.60 – 0.78
55–59 68.7 1.18 1.27 1.20 – 1.35 20.3 0.74 0.62 0.55 – 0.70
60–64 71.6 1.23 1.33 1.25 – 1.41 18.0 0.67 0.55 0.48 – 0.64
65–69 76.3 1.31 1.42 1.34 – 1.50 14.9 0.58 0.46 0.39 – 0.53
70–74 77.7 1.33 1.44 1.36 – 1.53 14.9 0.53 0.46 0.39 – 0.55
75–79 76.1 1.30 1.43 1.34 – 1.52 14.5 0.51 0.44 0.37 – 0.52
80+ 76.5 1.31 1.44 1.36 – 1.54 16.3 0.57 0.48 0.41 – 0.57
Further education (years)
(N = 23058) None 68.5 1 1 20.4 1 1
Less than 2 65.1 0.96 1.00 0.96 – 1.03 22.2 1.09 1.00 0.90 – 1.11 2–4 64.6 0.84 0.97 0.95 – 1.00 22.8 1.12 1.07 0.99 – 1.15 5 or more 64.8 0.79 0.98 0.95 – 1.01 23.0 1.13 1.11 1.00 – 1.22 Undergoing education or other 67.8 0.85 1.05 1.01 – 1.10 20.5 1.00 0.94 0.81 – 1.08
Frequency of attendance (times per year)
(N = 24154) 0–1 66.1 1 13 24.3 1 1
2–3 64.3 0.97 0.99 0.96 – 1.03 24.4 1.00 0.96 0.88 – 1.05 4–5 65.1 0.98 1.01 0.97 – 1.04 22.5 0.93 0.87 0.80 – 0.95
6–7 65.7 0.99 1.04 1.00 – 1.08 21.2 0.87 0.78 0.70 – 0.86
8–9 68.0 1.03 1.08 1.03 – 1.13 19.4 0.80 0.70 0.62 – 0.80
10+ 68.2 1.03 1.12 1.08 – 1.17 18.7 0.77 0.63 0.57 – 0.69
Duration of listing (years)
(N = 16168) Less than 1 65.6 1 13 25.8 1 1
1–2 64.8 0.99 0.97 0.92 – 1.02 23.8 0.92 0.97 0.86 – 1.10 3–7 65.6 1.00 0.96 0.92 – 1.01 21.9 0.85 0.92 0.82 – 1.04 8–12 68.1 1.04 0.98 0.93 – 1.03 20.2 0.78 0.89 0.78 – 1.01 13+ 70.7 1.08 1.00 0.95 – 1.05 17.5 0.68 0.79 0.69 – 0.90
Self-rated health
(N = 24154) Excellent 70.0 1 13 19.6 1 1
Very good 67.1 0.96 0.92 0.89 – 0.95 21.2 1.08 1.18 1.07 – 1.30
Good 66.3 0.95 0.82 0.79 – 0.84 21.8 1.11 1.51 1.37 – 1.65
Fair 61.1 0.87 0.71 0.69 – 0.74 25.3 1.29 2.02 1.82 – 2.24
Poor 60.8 0.87 0.70 0.65 – 0.74 25.1 1.28 2.11 1.82 – 2.44
Chronic condition
(N = 23810) No 64.9 1 13 23.4 1 1
Yes-KRTC 71.2 1.10 1.03 1.01 – 1.06 17.9 0.77 0.88 0.81 – 0.96
Yes-other or multiple 63.8 0.98 1.00 0.98 – 1.03 22.7 0.97 0.93 0.88 – 1.00
Chronic condition
(N = 16049) None 64.9 1 13 23.4 1 1
K – Cardiovascular 66.3 1.14 1.05 1.01 – 1.09 19.8 0.68 0.85 0.76 – 0.96
R – Respiratory 73.8 1.02 1.02 0.97 – 1.07 16.0 0.95 0.96 0.85 – 1.09 T – Endocrine 66.2 1.09 1.03 0.99 – 1.08 22.1 0.81 0.92 0.80 – 1.07 C – Cancer 70.5 1.16 1.12 1.04 – 1.21 18.8 0.56 0.62 0.46 – 0.84 Prevalence ratio (PR) for 100% positive assessments and for 0–49% positive assessments associated with different patient characteristics. Crude PRs are adjusted for clustering of patients. Adjusted PRs are adjusted for patients' gender, age, frequency of attending a GP, self-rated health and clustering of patients. Numbers in italics are used to indicate statistical significance. 1 Patients who marked 100% of the answered questions in one of the two most positive answering categories.
Page 9 of 13
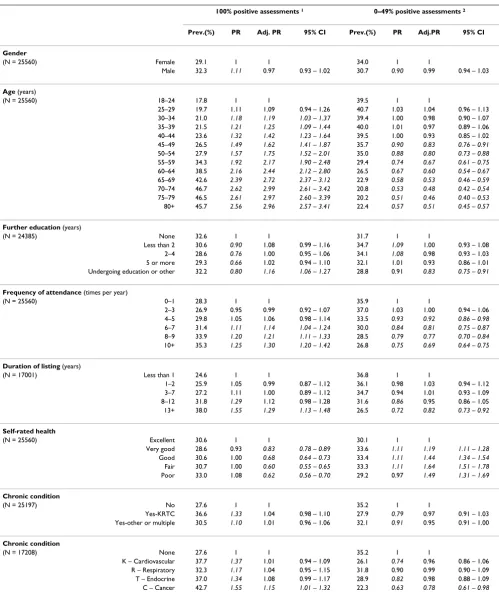
Table 6: Dimension 5: Crude and adjusted associations between patient characteristics and patients' evaluation of aspects of the accessibility.
100% positive assessments 1 0–49% positive assessments 2
Prev.(%) PR Adj. PR 95% CI Prev.(%) PR Adj.PR 95% CI
Gender
(N = 25560) Female 29.1 1 1 34.0 1 1
Male 32.3 1.11 0.97 0.93 – 1.02 30.7 0.90 0.99 0.94 – 1.03
Age (years)
(N = 25560) 18–24 17.8 1 1 39.5 1 1
25–29 19.7 1.11 1.09 0.94 – 1.26 40.7 1.03 1.04 0.96 – 1.13 30–34 21.0 1.18 1.19 1.03 – 1.37 39.4 1.00 0.98 0.90 – 1.07 35–39 21.5 1.21 1.25 1.09 – 1.44 40.0 1.01 0.97 0.89 – 1.06 40–44 23.6 1.32 1.42 1.23 – 1.64 39.5 1.00 0.93 0.85 – 1.02 45–49 26.5 1.49 1.62 1.41 – 1.87 35.7 0.90 0.83 0.76 – 0.91
50–54 27.9 1.57 1.75 1.52 – 2.01 35.0 0.88 0.80 0.73 – 0.88
55–59 34.3 1.92 2.17 1.90 – 2.48 29.4 0.74 0.67 0.61 – 0.75
60–64 38.5 2.16 2.44 2.12 – 2.80 26.5 0.67 0.60 0.54 – 0.67
65–69 42.6 2.39 2.72 2.37 – 3.12 22.9 0.58 0.53 0.46 – 0.59
70–74 46.7 2.62 2.99 2.61 – 3.42 20.8 0.53 0.48 0.42 – 0.54
75–79 46.5 2.61 2.97 2.60 – 3.39 20.2 0.51 0.46 0.40 – 0.53
80+ 45.7 2.56 2.96 2.57 – 3.41 22.4 0.57 0.51 0.45 – 0.57
Further education (years)
(N = 24385) None 32.6 1 1 31.7 1 1
Less than 2 30.6 0.90 1.08 0.99 – 1.16 34.7 1.09 1.00 0.93 – 1.08 2–4 28.6 0.76 1.00 0.95 – 1.06 34.1 1.08 0.98 0.93 – 1.03 5 or more 29.3 0.66 1.02 0.94 – 1.10 32.1 1.01 0.93 0.86 – 1.01 Undergoing education or other 32.2 0.80 1.16 1.06 – 1.27 28.8 0.91 0.83 0.75 – 0.91
Frequency of attendance (times per year)
(N = 25560) 0–1 28.3 1 1 35.9 1 1
2–3 26.9 0.95 0.99 0.92 – 1.07 37.0 1.03 1.00 0.94 – 1.06 4–5 29.8 1.05 1.06 0.98 – 1.14 33.5 0.93 0.92 0.86 – 0.98
6–7 31.4 1.11 1.14 1.04 – 1.24 30.0 0.84 0.81 0.75 – 0.87
8–9 33.9 1.20 1.21 1.11 – 1.33 28.5 0.79 0.77 0.70 – 0.84
10+ 35.3 1.25 1.30 1.20 – 1.42 26.8 0.75 0.69 0.64 – 0.75
Duration of listing (years)
(N = 17001) Less than 1 24.6 1 1 36.8 1 1
1–2 25.9 1.05 0.99 0.87 – 1.12 36.1 0.98 1.03 0.94 – 1.12 3–7 27.2 1.11 1.00 0.89 – 1.12 34.7 0.94 1.01 0.93 – 1.09 8–12 31.8 1.29 1.12 0.98 – 1.28 31.6 0.86 0.95 0.86 – 1.05 13+ 38.0 1.55 1.29 1.13 – 1.48 26.5 0.72 0.82 0.73 – 0.92
Self-rated health
(N = 25560) Excellent 30.6 1 1 30.1 1 1
Very good 28.6 0.93 0.83 0.78 – 0.89 33.6 1.11 1.19 1.11 – 1.28
Good 30.6 1.00 0.68 0.64 – 0.73 33.4 1.11 1.44 1.34 – 1.54
Fair 30.7 1.00 0.60 0.55 – 0.65 33.3 1.11 1.64 1.51 – 1.78
Poor 33.0 1.08 0.62 0.56 – 0.70 29.2 0.97 1.49 1.31 – 1.69
Chronic condition
(N = 25197) No 27.6 1 1 35.2 1 1
Yes-KRTC 36.6 1.33 1.04 0.98 – 1.10 27.9 0.79 0.97 0.91 – 1.03 Yes-other or multiple 30.5 1.10 1.01 0.96 – 1.06 32.1 0.91 0.95 0.91 – 1.00
Chronic condition
(N = 17208) None 27.6 1 1 35.2 1 1
K – Cardiovascular 37.7 1.37 1.01 0.94 – 1.09 26.1 0.74 0.96 0.86 – 1.06 R – Respiratory 32.3 1.17 1.04 0.95 – 1.15 31.8 0.90 0.99 0.90 – 1.09 T – Endocrine 37.0 1.34 1.08 0.99 – 1.17 28.9 0.82 0.98 0.88 – 1.09 C – Cancer 42.7 1.55 1.15 1.01 – 1.32 22.3 0.63 0.78 0.61 – 0.98 Prevalence ratio (PR) for 100% positive assessments and for 0–49% positive assessments associated with different patient characteristics. Crude PRs are adjusted for clustering of patients. Adjusted PRs are adjusted for patients' gender, age, frequency of attending a GP, self-rated health and clustering of patients. Numbers in italics are used to indicate statistical significance. 1 Patients who marked 100% of the answered questions in one of the two most positive answering categories.
Page 10 of 13
have affected indications of frequency of attendance and duration of listing with the GP. Such information bias may be differentiated which would tend to overestimate the magnitude, but not the direction of the associations found [24].
We learned from our pilot-study that many patients did not understand the expression "chronic illness", so we added "or a serious disease lasting more than three months". This probably enhanced the sensitivity of the question but lowered its specificity, resulting in overrepre-sentation of more trivial conditions. In order to be able to compare evaluations by patients with a genuine chronic disease with that of those with no chronic conditions, we divided the respondents into three groups: those report-ing no chronic condition, those reportreport-ing a cardiovascu-lar, respiratory, endocrine or cancer diagnosis (ICPC-2-categories K, R and T and the ad hoc category C), and those reporting other or multiple diagnoses. This may have resulted in the exclusion of some very ill patients with for instance cardiovascular disease in addition to dia-betes thus tending to underestimate the significance of suffering from a chronic condition.
This study enjoyed a very high statistical power with over 27,000 cases included. We were therefore able to detect quite small, statistically significant associations. Some sta-tistically significant associations were so small that their clinical relevance could be questioned. However, the con-siderable power of our analyses is accompanied by an almost negligent risk of overlooking associations (type II-error).
While some earlier studies have presented diverging results on the association between patient gender and assessment [6,13,28], we found only small and inconsist-ent associations, which is in concordance with a meta-analysis performed by Hall et al. [11]. This finding may be rooted in the absence of any gender influence on the way patients experience health care or in the GPs' possible intuitive adjustment of their care to the different needs of different patients [9].
The adjusted analyses showed a strong positive associa-tion between patient age and assessment level, which is also a consistent finding in other studies [6,11]. This asso-ciation may be rooted not only in the long-standing rela-tionship with their GP and a higher age-related morbidity, but also in a more realistic view on health, health care expectancies and doctors' skills due to the patients' life experience. The finding may also be due to a general pos-itivity of – some may say more mellow way of judging by – older people [29]. However, we could also be facing to a cohort-effect which, though, is less probable considering the linearity of the association.
Crude analysis showed an expected negative association between educational level and assessment scores, which is in concordance with earlier findings [11]. In our study, however, the association was eliminated after adjustment except for the heterogenous group of patients undergoing education and patients who were unable to report the length of their education, which indicates that the associ-ation may have been confounded by other characteristics. This difference may be due to the use of different methods for measuring educational level, but it may also reflect that associations found in one cultural setting may not necessarily be valid in another.
Frequency of attendance is a multifaceted variable. For example, we do not know if a high number of encounters is the result of the patient's or the GP's initiative (ex. half-yearly control-appointments for chronic disease). Still, it is an indicator of the intensity of the doctor-patient rela-tionship, just as the duration of listing with the GP is an indicator of the relational continuity between the GP and his patient [30]. Patients' age, time on the GP's list, fre-quency of attendance and health are closely intercon-nected. Our adjusted PRs therefore capture a more "clean" effect on the assessment of being listed for years with the same GP and of the frequency of attending the GP. Adjust-ment of the latter for health ensured that the positive assessment was not an expression of the ill patient relying on the quality of the GP care [28].
Continuity is one of the core qualities of the doctor-patient-relationship in a health care system where the GP is the patient's primary contact with the health care system [31]. The possible migration of dissatisfied patients from the GPs' lists favours a positive association between assessment and time on the GPs list. However, unlike Hjortdahl and Laerum [32] we found no association with the duration of the relationship but a positive association with the intensity. This may indicate that the positive association between continuity and assessment demon-strated in earlier studies [10,33,34] may be correlated with other characteristics which we adjusted for in the present study.
Page 11 of 13
Both Hall et al. [36,37] and Wensing et al. [38] found an association between less positive assessments and poor self-rated health. We also found this strong negative asso-ciation between self-rated health and assessment after adjusting for confounders, but we also found that patients who reported a chronic condition assessed more posi-tively in all dimensions except accessibility with patients suffering from cardiovascular, respiratory, endocrine and cancer diseases giving the most positive assessments. This is an assessment paradox because GPs received more neg-ative assessments from patients with a poor self-rated health, but more positive assessments from patients with chronic illness. This was also found by Zapka et al. [39]. This may be due to our adjusting for self-rated health which may be somewhat risky when dealing with chronic illness. On the other hand, a possible explanation may be that the GPs were more capable at handling patients with exact diagnoses and maybe even capable of improving their self-rated health, than at handling patients who rated their health as poor did not fit into a specific disease cate-gory – e.g. patients with somatization disorders [40]. We may have been demonstrating an effect of the clinical rec-ommendations on the handling of different chronic dis-eases that have been implemented in Danish general practice through the past few years. All in all, these results illustrates how the use of different health indicators may affect the association between health and assessment and that it is crucial to specify how health is measured when-ever this parameter is being used.
We only included a limited number of patient variables. Inclusion of more and specific variables reflecting psycho-socio-cultural aspects might have added value to the study; in particular, it might have helped explain the oppositely directed associations between self-rated health, chronic conditions and assessments.
If patients' demands, expectations and experience, which are determinants of satisfaction in most models [6,7], were always in balance we would probably see no assess-ment variation between patients with different character-istics. But, as we have demonstrated, assessments do vary with patient characteristics. In this paper we chose to pub-lish the crude as well as the adjusted results of the analyses of possible associations between patient characteristics and evaluations. This kind of results serves to point out possible quality deficits in general, and to serve this pur-pose the results need to be adjusted for possible con-founders. However, our study offers no possibility for deciding whether the source for evaluation differences between groups of patients is embedded with the patient or with the care and hence with the GP.
Whether or not the results from patient evaluations of care providers should be adjusted for uneven distribution of
patient characteristics also depends on the purpose for which they are produced. Adjustment for patient differ-ences may produce a more fair comparison between GPs, and when patient evaluations are used for accreditation purposes it may also seem fair to adjust for differences in the evaluated GPs' patient populations. Yet, adjustment may also blur the assessment of GPs' ability to meet the needs of the populations actually served [9,11] and thus render quality improvement at a GP level difficult.
Conclusion
In a setting with a comprehensive list system and gate-keeping, we performed a patient evaluation study using a validated international questionnaire among voluntarily participating GPs and a large number of patients, thus producing results with high statistical precision. After adjusting for patients' gender, age, frequency of attending a GP and self-rated health we confirmed findings from earlier studies that there is a positive association between patients' age and frequency of attendance and their assess-ment of their GP and a weak and inconsistent association with patients' gender. We also showed that patients reporting a chronic condition were more positive in their assessment of the GP than patients without a chronic con-dition, whereas in the same population assessing the same aspects of practice, the assessments turned out less posi-tive with decreasing self-rated health. We were not able to demonstrate associations with patients' level of education or the time the patients had been listed with the GP.
In this study we demonstrated statistically significant but yet minor associations between patients' characteristics and their assessment of the GP. Some of the variation may also be associated with GP and practice characteristics as we have demonstrated in a related already published paper [41]. The results from this study may lead to further investigations into the causes behind the found associa-tions and to improving activities in case they are due to quality deficits. We will leave it to the relevant parties to discuss and decide whether or not they should be used for standardising future quality assessments for comparison purposes.
Competing interests
The authors declare that they have no competing interests.
Authors' contributions
Page 12 of 13
Additional material
Acknowledgements
This study was carried out as part of the national project on patient evalu-ations, DanPEP. We wish to thank all the GPs and patients whose evalua-tion provided this project with valuable data and Ms. Gitte Hove, cand. scient. bibl., for her competent management of the data. The DanPEP study was supported by grants from the Central Committee on Quality Develop-ment and Informatics in General Practice and the Danish Ministry of the Interior and Health. Direct expenses incurred by the participating GPs were refunded by the local Committees for Quality Improvement in Gen-eral Practice in the counties of Aarhus, Frederiksborg, Funen, Ribe, South-ern Jutland, Vejle and WestSouth-ern Zealand and the municipalities of Bornholm, Copenhagen and Frederiksberg.
References
1. Williams B: Patient satisfaction: a valid concept? Soc Sci Med
1994, 38:509-516.
2. Lewis JR: Patient views on quality care in general practice: lit-erature review. Soc Sci Med 1994, 39:655-670.
3. Donabedian A: Quality assurance in health care: Consumers' role. Quality in Health Care 1992, 1:247-251.
4. Cleary PD, McNeil BJ: Patient satisfaction as an indicator of quality care. Inquiry 1988, 25(1):25-36.
5. Shaw CD, Kalo I: A background for national quality policies in health systems. Copenhagen, WHO; 2002:1-48.
6. Sitzia J, Wood N: Patient satisfaction: a review of issues and concepts. Soc Sci Med 1997, 45:1829-1843.
7. Thompson AG, Sunol R: Expectations as determinants of patient satisfaction: concepts, theory and evidence. Int J Qual Health Care 1995, 7:127-141.
8. Fox JG, Storms DM: A different approach to sociodemographic predictors of satisfaction with health care. Soc Sci Med [A]
1981, 15:557-564.
9. Perneger TV: Adjustment for patient characteristics in satis-faction surveys. Int J Qual Health Care 2004, 16:433-435. 10. Pascoe GC: Patient satisfaction in primary health care: A
lit-erature review and analysis. Evaluation and program planning
1983, 6:185-210.
11. Hall JA, Dornan MC: Patient sociodemographic characteristics as predictors of satisfaction with medical care: a meta-anal-ysis. Soc Sci Med 1990, 30:811-818.
12. Mainz J, Vedsted P, Olesen F: [How do patients evaluate their general practitioners? Danish results from a European study] (in Danish). Ugeskr Laeger 2000, 162:654-658.
13. Campbell JL, Ramsay J, Green J: Age, gender, socioeconomic, and ethnic differences in patients' assessments of primary health care. Qual Health Care 2001, 10:90-95.
14. Rahmqvist M: Patient satisfaction in relation to age, health sta-tus and other background factors: a model for comparisons of care units. Int J Qual Health Care 2001, 13:385-390.
15. Sitzia J: How valid and reliable are patient satisfaction data? An analysis of 195 studies. Int J Qual Health Care 1999, 11:319-328.
16. Grol R, Wensing M, Mainz J, Jung HP, Ferreira P, Hearnshaw H, Hjort-dahl P, Olesen F, Reis S, Ribacke M, Szecsenyi J: Patients in Europe evaluate general practice care: an international comparison.
Br J Gen Pract 2000, 50:882-887.
17. Grol R, Wensing M: Patients evaluate general/family practice. The EUROPEP instrument. EQuiP, WONCA Region Europe 2000. 18. Wensing M, Mainz J, Ferreira PL, Hearnshaw H, Hjortdahl P, Olesen F, Reis S, Ribacke M, Szecsenyi J, Grol R: General practice care and patients' priorities in Europe: an international compari-son. Health Policy 1998, 45:175-186.
19. Wensing M, Mainz J, Grol R: A standardised instrument for patient evaluations of general practice care in Europe. Euro-pean Journal of General Pratice 2000, 6:82-87.
20. Lamberts H, Wood M: ICPC. [International Classification for Primary Care], Danish version Oxford Medical Publications; 1990.
21. Bjørner JB, Damsgaard MT, Watt T, Bech P, Rasmussen NK, Kris-tensen TS, Modvig J, Thunedborg K: [The Danish manual for SF-26. A health status questionnaire], (in Danish) Copenhagen: Lif; 1997. 22. Stata Statistical Software: Release 8.0 College Station, TX: Stata
Corpo-ration; 2003.
23. Clayton D, Hills M: Statistical Models in Epidemiology Oxford: Oxford University Press; 1993.
24. Rothman KJ, Greenland S: Modern Epidemiology Second edition. Phila-delphia: Lippicott-Raven Publishers; 1998.
25. Barros AJ, Hirakata VN: Alternatives for logistic regression in cross-sectional studies: an empirical comparison of models that directly estimate the prevalence ratio. BMC Med Res Methodol 2003, 3:21.
26. Stata Statistical Software: Release 9.0 College Station, TX: StataCorp LP; 2005.
27. Statistics Denmark, Statbank Denmark [http://www.stat bank.dk]. (Accessed November 2005)
28. Hall JA, Dornan MC: What patients like about their medical care and how often they are asked: a meta-analysis of the satisfaction literature. Soc Sci Med 1988, 27:935-939.
29. Isaacowitz DM, Vaillant GE, Seligman ME: Strengths and satisfac-tion across the adult lifespan. Int J Aging Hum Dev 2003, 57:181-201.
30. Haggerty JL, Reid RJ, Freeman GK, Starfield BH, Adair CE, McKendry R: Continuity of care: a multidisciplinary review. BMJ 2003, 327:1219-1221.
31. Freeman GK, Olesen F, Hjortdahl P: Continuity of care: an essen-tial element of modern general practice? Fam Pract 2003, 20:623-627.
32. Hjortdahl P, Laerum E: Continuity of care in general practice: effect on patient satisfaction. BMJ 1992, 304:1287-1290. 33. Baker R, Mainous AG III, Gray DP, Love MM: Exploration of the
relationship between continuity, trust in regular doctors and patient satisfaction with consultations with family doctors.
Scand J Prim Health Care 2003, 21:27-32.
34. Donahue KE, Ashkin E, Pathman DE: Length of patient-physician relationship and patients' satisfaction and preventive service use in the rural south: a cross-sectional telephone study.
BMC Fam Pract 2005, 6:40.
35. Hall JA, Milburn MA, Roter DL, Daltroy LH: Why are sicker patients less satisfied with their medical care? Tests of two explanatory models. Health Psychol 1998, 17:70-75.
36. Hall JA, Feldstein M, Fretwell MD, Rowe JW, Epstein AM: Older patients' health status and satisfaction with medical care in an HMO population. Med Care 1990, 28:261-270.
37. Hall JA, Milburn MA, Epstein AM: A causal model of health status and satisfaction with medical care. Med Care 1993, 31:84-94. 38. Wensing M, Grol R, Asberg J, van Montfort P, van Weel C, Felling A:
Does the health status of chronically ill patients predict their judgements of the quality of general practice care? Qual Life Res 1997, 6:293-299.
39. Zapka JG, Palmer RH, Hargraves JL, Nerenz D, Frazier HS, Warner CK: Relationships of patient satisfaction with experience of system performance and health status. J Ambul Care Manage
1995, 18:73-83.
40. Smith GR Jr, Monson RA, Ray DC: Patients with multiple unex-plained symptoms. Their characteristics, functional health, and health care utilization. Arch Intern Med 1986, 146:69-72. 41. Heje HN, Vedsted P, Sokolowski I, Olesen F: Doctor and practice
characteristics associated with differences in patient evalua-tions of general practice. BMC Health Serv Res 2007, 7(46):46.
Additional file 1
The EUROPEP-questionnaire. Click here for file
[http://www.biomedcentral.com/content/supplementary/1472-6963-8-178-S1.pdf]
Additional file 2
Danish general practice. Click here for file
Publish with BioMed Central and every scientist can read your work free of charge
"BioMed Central will be the most significant development for disseminating the results of biomedical researc h in our lifetime."
Sir Paul Nurse, Cancer Research UK
Your research papers will be:
available free of charge to the entire biomedical community
peer reviewed and published immediately upon acceptance
cited in PubMed and archived on PubMed Central
yours — you keep the copyright
Submit your manuscript here:
http://www.biomedcentral.com/info/publishing_adv.asp
BioMedcentral
Page 13 of 13
Pre-publication history
The pre-publication history for this paper can be accessed here: