R E S E A R C H A R T I C L E
Open Access
Clinicians
’
and patients
’
views of metrics of
change derived from patient reported outcome
measures (PROMs) for comparing providers
’
performance of surgery
Zoe Hildon, Jenny Neuburger, Dominique Allwood, Jan van der Meulen and Nick Black
*Abstract
Background:Patient reported outcome measures (PROMs) are increasingly being used to compare the
performance of health care providers. Our objectives were to determine the relative frequency of use of different metrics that can be derived from PROMs, explore clinicians’and patients’views of the options available, and make recommendations.
Methods:First a rapid review of the literature on metrics derived from two generic (EQ-5D and EQ-VAS) and three disease-specific (Oxford Hip Score; Oxford Knee Score; Aberdeen Varicose Vein Questionnaire) PROMs was
conducted. Next, the findings of the literature review were mapped onto our typology of metrics to determine their relative frequency of use, Finally, seven group meetings with surgical clinicians (n = 107) and six focus groups with patients (n = 45) were held which were audio-taped, transcribed and analysed thematically.
Results:Only nine studies (9.3% of included papers) used metrics for comparing providers. These were derived from using either the follow-up PROM score (n = 3) or the change in score as an outcome (n = 5), both adjusted for pre-intervention score. There were no recorded uses of the proportion reaching a specified (‘good’) threshold and only two studies used the proportion reaching a minimally important difference (MID).
Surgical clinicians wanted multiple outcomes, with most support expressed for the mean change in score, perceiving it to be more interpretable; there was also some support for the MID. For patients it was apparent that rather than the science behind these measures, the most important aspects were the use of language that would make the metrics personally meaningful and linking the metric to a familiar scale.
Conclusions:For clinicians the recommended metrics are the mean change in score and the proportion achieving a MID, both adjusted for pre-intervention score. Both need to be clearly described and explained. For patients we recommend the proportion achieving a MID or proportion achieving a significant improvement in hip function, both adjusted for pre-intervention score.
Background
There is increasing use of patient reported outcome mea-sures (PROMs) to assess and compare the performance of health care providers. Since April 2009, their use for meas-uring the outcome of four common elective operations (hip and knee replacement, hernia repair, varicose vein surgery), using before and after data, has been mandatory in the
NHS in England. [1,2] Their use is likely to expand in the future. It is envisaged that PROMs will help improve the quality of care through several mechanisms: enhancing pa-tient choice, encouraging clinicians and managers to review patient care, informing commissioners' decisions and pro-viding information for regulators. [3-5]
Although PROMs have been subjected to extensive test-ing of their measurement properties, less attention has been paid to the range of metrics that can be derived from before and after PROMs data. Our aim was to recommend the most appropriate metrics for comparison of the * Correspondence:Nick.Black@LSHTM.ac.uk
Department of Health Services Research & Policy, London School of Hygiene & Tropical Medicine, 15-17 Tavistock Place, London WC1H 9SH, UK
providers of surgery for presentation to clinicians and to patients. To achieve this, the objectives were: to identify the different metrics that can be derived from PROMs; to as-sess the relative frequency with which these have appeared in the literature; and to explore the views of clinicians and patients of different metrics for comparing health care pro-vider performance. Different formats for presenting such data to lay and to clinical audiences, which will anchor the choice of metric, have been reported elsewhere [6-8].
Methods
Literature review: Frequency of use of different types of metrics
The review sought to identify which metrics had been derived fromeach of the five PROMs used in the National PROMs Programme and what their relative frequency of use has been. The measures include: two generic (EQ-5D and EQ-VAS) [9-11] and three disease-specific PROMs (Aberdeen Varicose Vein Questionnaire (AVVQ) [12]; Oxford Hip Score (OHS) [13]; Oxford Knee Score (OKS) [14]).
As the original conception of these instruments was to measure treatment outcomes, we expected that most of the literature would be evaluations of clinical interven-tions rather than comparisons of providers. We there-fore did not limit our search to the latter use. This ensured that we would capture a wide range of metrics.
We conducted a ‘rapid review’ [15] of the literature using systematic searching and screening methods to produce a sample of literature that would give the range and relative frequency of the metrics of interest. As we were not aiming to provide a comprehensive account of the total number of uses of each metric that had appeared in the literature, a full systematic review was deemed inappropriate.
The searching was conducted across seven databases, hosted by the Ovid interface: EMBASE; Medliner; Global Health; Health Management Information Consortium; Psy-chInfo; PsychExtra; Social Policy and Practice. The search string combined EQ-5D search terms with a set of terms developed to capture measurement of change and longitu-dinal studies. Only the EQ-5D required limiting in such a way, as disease-specific PROMs have been used less fre-quently so were sought using their names only. The full search string was therefore: (EQ-5D terms AND change measurement terms) OR (AVVQ terms or OKS terms or OHS terms).
Expert recommendations for grey literature (i.e. not pub-lished in a peer reviewed journal) or for literature currently in press were asked for within our immediate team and teams with overlapping research interests, and were included for screening. Selection was carried out using agreed criteria at title, abstract and full-text screening to capture how the selected PROMs had been applied to
measuring change. The primary inclusion criterion was that the paper reported change on at least two occasions, using one of the included PROMs instruments. Full inclusion and exclusion criteria are summarised in Table 1. The following information was extracted from each paper: sample size; number of health care providers; data collection time points; number of outcome measures; methods of deter-mining change in health status.
The typology was constructed around two criteria: the type of outcome (a measure of post-intervention health status or the extent of change in health status following an intervention); and whether the metric was based on a continuous variable (eg a mean score) or a categorical variable (eg proportion achieving a defined outcome). Our focus was on identifying frequencies with which these types of metrics were currently used and on gener-ating a shortlist of distinctive metrics appropriate for comparing performance of healthcare providers. Full statistical methods for routine comparisons of perform-ance have been explored elsewhere [16].
Our selections were based on a pre-requisite for such analyses, the potential for complex case-mix adjustment, that is an outcome that could be included as a dependent variable in a statistical model adjusting for the impact of patient characteristics (eg linear or logis-tic regression to account for socio-demographic, co-morbidities, previous admissions). Metrics that could not be adjusted or were only crudely adjusted (eg strati-fication) in simple analyses were recorded but deemed unsuitable for our purposes.
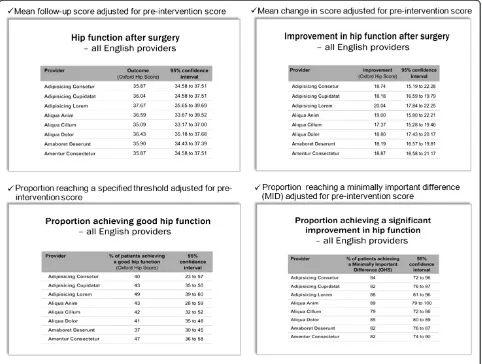
Four suitable metrics were selected (all would be adjusted for pre-intervention score) to propose to clini-cians and patients:
✓Mean follow-up score
✓Mean change in score
✓Proportion reaching a specified (‘good’) threshold at follow-up
✓Proportion reaching a minimally important difference (MID)
These were chosen to represent the range available from our typology; although we recognise that some measure the same thing (i.e. the mean follow-up and change score would give identical rankings) [17]. And others, if accur-ately and consistently derived, would likely produce the same or very similar rankings (i.e. using a minimally im-portant difference or a specified threshold for a‘good’ out-come in the follow-up score).
Qualitative study: Exploring clinician and patient views on selected metrics
Views of selected metrics were elicited aroundaccuracy
whether metrics successfully captured differences attrib-utable to provider performance. On interpretability we sought views on the meaningfulness of the proposed metrics.
To obtain such views from surgical clinicians’meetings were held at six hospitals, supplemented with one meeting at a national conference for clinical staff involved in pre-operative assessment. Meetings took place between September and December 2010. A pragmatic approach to the setting, duration and attendance was adopted given we had to fit in with clinicians’limited availability. The hospitals were selected from those that had partici-pated in the Patient Outcomes in Surgery (POiS) Audit given that those clinicians had demonstrated an interest in the topic [18]. Seven meetings took place (N= 107). Con-sultants were present at all meetings, nurses or allied health professionals at five meetings, and junior doctors at four meetings (Table 2).
To obtain the views of patients, six focus groups were undertaken between October and December 2010, hav-ing obtained ethics approval from a Multicentre research Ethics Committee. Arthritis Care (the leading patient organisation for arthritis in the UK) identified 11 partici-pants for the first focus group of whom eight agreed to
take part. Participants for the other five groups were selected from those who had taken part in the POiS Audit. Of the 376 people invited, 76 agreed to partici-pate (20%). Selection was stratified by the surgical oper-ation they had undergone, age (54 and under; 55–74; 75 and above), sex and index of multiple deprivation (IMD). This resulted in 45 people attending five meet-ings; including six partners or lay carers, in response to requests from some patients (Table 3). Consent to par-ticipate and for the discussions to be audio-taped was obtained.
Meetings with clinicians and patients were facilitated by one of the authors, accompanied by an observer who took notes. Meetings with clinicians lasted about an hour and with patients about one and a half hours. We sought participants’views not only of metrics that could be derived from PROMs but also the format and content of how to present data (reported elsewhere [7,8]). To aid the discussions, the Oxford Hip Score was used as the example of a PROM and the four different metrics were explained using this instrument and illustrated in Power-Point as depicted in Figure 1.
[image:3.595.60.537.97.226.2]The recordings were transcribed verbatim. Data from clinicians were independently analysed by NB
Table 2 Description of clinicians who participated in hospital meetings
Meeting Specialty Type of meeting
Profession
Consultant Junior doctor
Nurse; AHP*
Other**
A (N= 7) Orthopaedic surgery Clinical governance 4 3 -
-B (N= 17) Pre-operative assessment National conference session 5 - 10 2
C (N= 7) General surgery Pre-arranged meeting 4 - 1 2
D (N =30) Orthopaedic surgery Clinical governance meeting 5 16 9
-E (N= 6) General surgery; Orthopaedic Pre-arranged meeting 2 - 4
-F (N= 20) General surgery; Care of the Elderly
Hospital wide teaching 4 16 -
-G (N= 20) Orthopaedic surgery Clinical governance 5 9 4 2
Totals (N= 107) All were surgical units Tagged to existing agendas or specifically pre-arranged
29 44 28 6
*AHP = Allied Health Professional.
[image:3.595.56.542.554.717.2]**Managers, administrators, IT staff, clinical audit staff.
Table 1 Inclusion and exclusion criteria
Inclusion criteria Exclusion criteria
Uses one of five PROMs (EQ-5D on its own or supplemented by EuroQol VAS; OHS; OKS; AVVQ) as a study outcome
Focus is not onusinginstruments but assessing if we should use them at all (i.e. review of instruments, assessing psychometric properties, reliability etc.)
Reports change in PROM at two or more time points: At title screen: possible focus on included
instrument and measuring change.
At abstract screen: focus on included instrument and measuring change.
At full-text screen: describes analyses of change using included instrument
Focus is not on included instruments, these must be used as a study outcome (i.e. EQ-5D used in QALY outcomes, and analyses using only EuroQol VAS are excluded)
and DA, data from patients by NB and ZH. Thematic analyses (of first and second order concepts) on the views of each metric were summarised with illustra-tive quotes for each audience. Both sets of findings
[image:4.595.57.539.100.225.2]were then reordered and interpreted (ZH and JN) in a framework analysis that accounted for concepts of accuracy and interpretability which had been identi-fied as two core second order concepts across both
[image:4.595.58.540.347.711.2]Figure 1Metrics displays.
Table 3 Description of patient and other focus group participants
Group Sex Operation Age (years) Socio- Economic Status (IMD* quintiles) Not known
M F Hip Knee VVs none 40-55 56-75 >75 1 2 3 4 5
-A(N = 8) 3 5 5 2 0 1 2 3 3 2 0 0 0 0 6
B(N = 7) 4 3 2 3 0 2 2 3 2 0 2 1 3 0 1
C(N = 6) 4 2 0 4 0 2 1 2 3 0 2 2 2 0 0
D(N = 8) 4 4 0 8 0 0 2 4 2 3 2 2 1 0 0
E(N = 9) 5 4 8 0 0 1 1 4 4 1 2 3 2 1 0
F(N = 7) 2 5 0 0 7 0 1 5 1 1 1 4 1 0 0
Totals (N= 45) 22 23 15 17 7 6 9 21 15 7 9 12 9 1 7
*Index of multiple deprivation, 1 least deprived to 5 most deprived, or NK = Not known. VVs = varicose vein surgery.
audiences. Paired analysis found a high level of inter-rater agreement; where differences occurred, a consensus was achieved through discussion.
Results
Literature review
Screening and selection
Literature searches carried out in March 2010 identified 439 potential papers. On title screening 67 duplicates and 9 non-English language papers were removed, leav-ing 363. Of these, 15 cited more than one PROM, thus yielding 388 reported uses of the included measures. Ab-stract screening led to 72% being excluded because they did not use PROMs as a study outcome or did not re-port on change in health status. A further seven papers were excluded at full-text screening for the same rea-sons, leaving 96 papers for analysis (Figure 2).
Descriptive information from included studies
Allowing for papers covering more than one measure, the number reporting on each PROM was: EQ-5D 49, EQ-VAS 18, AVVQ 8, OHS 32, OKS 17. About 20% of studies used a single PROM; more commonly several instruments were used, though some which are not included in this review. Sample sizes ranged widely (10 to 9430) with only around 10% having over 1000 cases. The number of time points across which PROMs were collected ranged from two to eight, the mean being two. The length of follow-up for most studies was 6– 12 months.
PROMs were used to compare services or health care providers in only six studies [19-24]. Audiences for all the included studies were clinicians, academics or policy-makers. The most frequent use of PROMs was in randomised (n = 29 papers) or non-randomised (n = 41) evaluations of clinical or psycho-social interventions. Other uses were to report differences in outcomes be-tween patient groups (seven papers), variations in out-comes within a specific population (n = 12 studies) or change in people’s health status over time with no inter-vention (one study).
Frequency of use of the different types of metrics
In terms of the typology of metrics, see Figure 3grids A-J, or the range of anticipated analyses and outcomes, the most frequent metric was simple analyses that reported raw follow-up means or medians, grid A, (n = 76). These averages were compared to pre-intervention averages, im-plicitly assessing change. Explicit change outcomes in the simple analyses were far fewer, grid B, with eight papers reporting mean differences, and 11 using standardised change outcomes (standardised effect sizes or response means). The latter was used for comparing different instru-ments on consistent scales.
Proportions (categorical outcomes) were also less fre-quently used in the simple studies. No papers that fitted our inclusion criteria reported on the proportion report-ing a specified threshold (e.g.42 points on the OHS as a desired outcome [24]), as represented by grid C. Five studies, grid D, compared different ways of deriving meaningful benchmarks in change scores based on min-imally important differences (MIDs). [24-28].
Earlier studies referred to‘minimally clinically important difference’(MCID) [29,30] and‘minimally clinically import-ant change’(MCIC) [31]. MIDs can be determined in two ways. The anchor-based method which uses retrospective categorical reports of the success or failure of an interven-tion (clinician reported initially but more recently patient reported) to determine when a meaningful change occurs. An example of a patient reported anchor would be report-ing health as ‘good’ or ‘very good’ after surgery. The distribution-based approach derives the MID by statistical methods, most frequently using half a standard deviation [25,32].
Although the stated long-term aim of the studies was to identify the proportion of patients who achieved a MID and thus help the ‘interpretability’ [31] of the data, most simply evaluated and tested the best method of calculating a MID. A simpler, although perhaps less meaningful way of deriving a proportionate change, was reporting proportions of patients that were worse, the same, or improved (grid E,
n = 6).
Predominance of explicit change outcomes in complex analyses
Only nine studies carried out analysis using complex case-mix adjustment [24,26,27,33-38]. In marked contrast to the simpler analyses, only three studies reported on using a follow-up score,grid F.Most used the explicit change out-come in some form. It appears that this outout-come may be easier to understand even though the pre-score is double counted. Five complex analyses, grid G, used the change score in a linear regression model. No studies specified a threshold for the follow-up score,grid H. A couple of stud-ies determining the MID using patient reported anchors,
grid I,chose to model these in outcomes in logistic regres-sion. Only one paper,grid J, considered the proportion im-provement, which was reported as arbitrarily selected.
Clinicians’and patients’views on selected metrics
While some patients expressed their views about the differ-ent metrics, many found it hard to understand information presented in a quantitative way:
From my point of view, you’re using a language I don’t understand.
To the ordinary man in the street, a lot of its gobbledygook.
In contrast, many clinicians perceived each metric to provide different information to such an extent that they found it difficult to express a preference. They therefore wanted more than one to be made available:
Why can’t we have all of them? I mean, we’re used to reading papers and understanding data, and they all tell you something slightly different.
They all look quite important, really. So, I expect if you asked four different clinicians, they’ll say yes to each of them.
[image:6.595.59.538.90.563.2]Nevertheless, some clinicians were quick to dismiss the options presented to them until they were satis-fied that case-mix (characteristics of patients that might affect the outcome of their care such as age, comorbidity and severity) was adequately accounted for, which we were quick to reassure them was part of the analysis:
What I want is value added. I want it compared to what we started from.
These issues also arose in the patient focus groups, but not explicitly in relation to the different metrics; instead they were expressed in terms of how we might account for some hospitals starting with patients who were sicker than they might be in other hospitals.
Apart from‘all or nothing’ preferential statements, the differences in the metrics were discussed in terms of their perceived accuracy (justified or erroneous) in indicating the performance or quality of providers and their inter-pretability, or perceptions around how easy they were to
understand. The clinicians were far more vocal on accur-acy than the patients, who cared more about interpretabil-ity. Each metric (Mean follow-up; mean change in score; proportion reaching a specified‘good’threshold at follow-up; and proportion reaching a minimally important differ-ence (MID) will be considered in turn relative to these concepts.
Mean follow-up score
Accuracy
[image:7.595.60.536.252.699.2]Clinicians voiced concerns about the accuracy of the mean follow-up score, questioning whether a mean
score would be sensitive enough to detecting change over time:
An improvement in that average might not be
possible over quite a few years. Even putting in a great effort, you’ll never show an improvement when you’ve got an average.
A related concern expressed by this audience was that the metric was not transparent enough about the degree of dispersion of individual patient scores to accurately portray performance:
You’ve got no concept of what your range is. . .your spread could be enormous or could be really tight. That really matters because you may be making some people worse but if you’re making enough people really good, your mean’s going to be okay.
Patients similarly talked about lack of information on in-dividual variation using this measure, questioning whether this metric may be too subjective to accurately capture per-formance:
Everybody’s sense of pain is different, so you can’t say that one person’s average is another person’s good. . . Some days it’s 20, some days it’s 40 [points].
This criticism of the metric, also levelled by clinicians at the other continuous metric (change outcome), was interesting because it is no less true of the metrics using categorical outcomes or proportions. Since the unit of analysis is the hospital rather than the patient, outcomes for all proposed metrics would be aggregated at the patient level. Yet both audiences did not think this was a problem with the logistic models presented as proportions.
Interpretability
Nevertheless, there was support among some clinicians for the interpretability of mean follow-up score. It was thought to be straightforward and likely to influence clinical practice:
If you present data like this people are going to use it. . .The main things you’re going to use this for are for the [surgical] department itself to monitor changes within the department.
It was however clear from the discussion surrounding the change score metric (see below), that some clinicians did not recognise that the mean follow-up score was an implicit measure of change; and would give the same
results as the explicit measure, given that the pre-intervention score featured in both models.
Patients, on the other hand, did not raise issues to do with explicitly measuring change, but struggled to make sense of what a particular score meant in terms of symptoms and disability:
Points mean nothing to me. . .So, before my operation I thought“Where would I like to go to afterwards to get better?”Now, if you could relate from my point of view to my objective, then you’re going somewhere. But if you talk points I’m almost switching off.
These comments were often followed by championing the virtues and universality of the percentage, or a 1–10 scale.
Mean change in score
Accuracy
Many clinicians preferred the mean change to the mean follow-up score. The former was seen as more accurate; since it explicitly took account of the pre-operative score, despite both metrics adjusting for this:
Change in score is far more useful than an average post-op score. . .[which] is completely related to where they start and so I don’t believe you could fully take account what it was. So somebody starting with 24 and getting to 48, the fact that they’ve improved by 24 is far more important than. . .the average [follow-up score].
The lack of understanding around case-mix adjust-ment was also seen to render the mean change score po-tentially less accurate as a measure of performance, because it would favour providers whose patients who had greater scope to improve:
A change in the score is probably going to favour our work because, statistically, our work base is actually older and more severely diseased than most other units.
It’s a bit like Ryanair being the most improved airline of the year. . .It’s the baseline level, isn’t it? We need to know what the baseline is before you can assess whether the average change has been important or not.
What Joe Public won’t know is, is this average change starting from 42 and going to 52 or is it an average change of ten points from 20 points to 30? So in fact, although they’ve got a ten point average change, which suggests it’s a good improvement, they may be going from poor to still less than good, whereas somewhere else might be going from very good to excellent.
Patients however, had little comment to pass of the ac-curacy of this metric.
Interpretability
Clinicians, on the whole liked the explicit use of a change metric, finding it meaningful and intuitive, even using the continuous score:
The change is much more important than a fixed number you’re trying to get people to get to or their point in time score
Except that, as with the post-operative adjusted metric, patients were unclear what the actual change score meant in terms of improvement in symptoms and disability:
Patient A: Eight points. Eight points of what? If all I felt was 8% better I wouldn’t bother to do it unless I was going to die from it. They don’t mean a thing to me. Patient B: That’s right, isn’t it, eight points of what? Patient A: You haven’t told anybody what the points are.
Patients in many ways preferred an outcome to be defined in terms of an experience rather than a number.
Proportion reaching a specified (‘good’) threshold
Accuracy
The accuracy of using the proportion reaching a speci-fied (‘good’) threshold in follow-up score, as a perform-ance indicator, was questioned by clinicians. First, they noted that some patients who would never be able to reach the threshold may still have benefited from sur-gery:
[Proportion above threshold] is rubbish, I think, because you don’t know what they start off with. . .if they come in paralysed from the neck down and you actually enable them to sit up by their own without outside help, then it’s an absolute miracle. . .You have to know the starting point.
I did somebody yesterday who’s never going to get to the [threshold] but, actually, considering she started off like this, just getting her sitting up and being able
to take five steps with her frame is going to be a huge success for her.
Second, there was concern as to how a threshold for ‘good’outcome would be determined:
You’d probably have to be a bit more specific about what [the threshold score] means.
Can I just say that 42 and over, I think that’s exceptionally high to give a good hip function score. We’ve got a lot of patients who come back with a score of 32, 33, they’re exceptionally happy with the outcome of their surgery.
Although to date clinical appraisal has been used to select the appropriate thresholds [39], it is more fitting that patient reports be used to inform appropriate thresholds in PROMs analyses.
Interpretability
The proportion reaching a specified threshold, along with the proportion of patients achieving a MID (see below), was perceived by clinicians to be easier for patients, for instance, to interpret over time. The speci-fied threshold was also the metric seen to be the patients favourite:
These [the proportion over a threshold and
proportion with MID] are much more likely to be of benefit to patients because I think they’re easier to understand and you’ll be able to show year-on-year improvement or some solution to a perceived problem much more easily.
I’d choose that one [proportion over a threshold] because it’s–to me it’s the most important thing that the patients are interested in.
Patients confirmed this, finding it easier to grasp than mean scores:
The proportion of patients achieving good hip function tells us something about the success and failure of the number of operations that’s being carried out.
I think that 62% is a good number to latch onto, whereas if you’ve got a point score, peoples’points out [of however many] are quite different. Whereas if 62% says,“Look, I really feel pretty good”. . .
The percentages sign, once again, winning this audience over.
Accuracy
Despite much support, there were also some concerns expressed by clinicians about the accuracy of using a MID as a performance indicator. They suggested that the value of a MID would depend on a patient’s starting point, which was not taken into account:
[This metric] doesn’t account for non-linearity of the scale. In other words, eight points might be not important at 30 but very important at 40.
They also perceived a potential difficulty in defining what constitutes a MID though assumed it would be decided by clinicians rather than using anchor-based (patient reports) or statistical methods:
The problem. . .is you have to establish what’s a minimally acceptable difference. And I suspect we’ll all argue about that. Whereas if you just go for the change we’re achieving, it’s not so debatable.
Their other concern was that, by definition, this metric assessed providers in terms of a minimum standard ra-ther than something more demanding:
If I, as a patient, had an eight point improvement, well, what does that mean compared to the normal improvement that one would expect from that operation? So am I scoring eight points, when really I should be getting 15.
It was also noted (erroneously) by one clinician that unlike achieving a specified threshold in the follow-up score, using the MID metric would not put providers who operated on more severe patients at a disadvantage:
They may have a population of people living there who are all 97 and are all crocked or whatever, or start with a very low baseline anyway, that’s just the way they are. You’re still improving their lives by taking them from one to ten.
A lot of assumptions were made about the MID, per-haps because this one of the more complex metrics to derive. Interestingly, this aspect of the measure was not criticised, nor did the clinicians appear phased by expla-nations of the MID.
Interpretability
Clinicians argued that despite some drawbacks around accuracy the proportion reaching a MID would be one of the most interpretable metrics, particularly to patients:
This minimally important difference is clearly what’s important to patients because. . .it relates to them
doesn’t it, not to us? So that would be my favourite one.
From the patient’s point of view, what they want is an improvement in, presumably, pain and function, so that’s the one that defines that most accurately, I think.
However, some of the support for this metric may have been based on confusing it with the previous one, achieving a threshold:
The minimally important difference is going to be the threshold, isn’t it? It’s going to be that proportion of patients who can walk with no pain versus those that walk with a bit of pain.
Patients’ interest in this metric was indeed confirmed with the concept of a MID or ‘significant’ improvement being readily interpretable:
In my case, there was a very significant improvement. I was absolutely hopeless before. . .I’ve always been really athletically inclined as it were and the people around me are all involved in a club atmosphere, and they noticed that prior I just went sort of down the hill as it were. When I came back I was back up the top of the hill again. So in that respect, the significant difference was that.
If you knew. . .a change of five points was not very significant, but a change of eight to ten was more significant. . .If you knew that before you started, that would be more meaningful.
A criticism often levelled at this metric and anchor based methods of deriving it is that it relies on a single item categorical measure of change, which may itself be imperfect [40]. This issue was not raised by either of the audiences we that we talked to.
Discussion Main findings
The literature review found that the explicit change out-come was the most frequently used. In the audiences of interest to us, both clinicians and patients initially struggled to make a selection when presented with a choice of metrics, though for different reasons. Clini-cians wanted variety, as they perceived that most of the metric provided something of value and interest. Patients at times could not distinguish between the four options, but liked a percentage, or what was for them in-tuitive scaling.
terms of accuracy, both the metrics based on continuous scores were seen by clinicians as limited in the scope of variation that they allowed to discern; this was not however unique to these metrics, but to the analyses, and applied equally to the categorical or dichotomous metrics. In addition, both patients and clinicians ques-tioned whether continuous outcomes would be able to re-port actual ‘improvement’ in the quality of care, which was necessarily required to evaluate performance; it was clear from these queries that the adjusted follow-up out-come was not readily identified as an implicit measure of change.
This said some clinicians identified this metric as the most straightforward measure, quickly grasping the scor-ing; for patients on the other hand, unlike measures of height or weight, PROMs scores are unfamiliar and their values have no immediate meaning. It’s therefore neces-sary to transform them into interpretable forms, or in-deed into experiences rather than metrics, to make them useful. The language used to express the MID seemed to resonate with patients because it captured something of the patient experience. Clinicians echoed the patient en-dorsement of categories of change, spotting that these that these would be most interpretable to the public.
Categories were seen as easy to understand and sensitive to improvements in performance. However, for clinicians, there were also reservations. They argued that depending on where a threshold was set, the use of this metric might fail to acknowledge the benefit patients would gain from moving from a very severe to a moderately severe condi-tion. In terms of accuracy, therefore the preference was for the using the MIDs despite some concern that this metric only assessed whether a provider was achieving a minimum level of care. The other concerns were methodological: how a threshold or MID would be defined and how non-linearity would be managed.
Limitations
Given the paucity of literature on comparing provider performance, the review depended on extrapolating from analyses using PROMs in other types of comparison. This nevertheless allowed for consideration of habitual use of these data giving insight into how clinical audi-ences at least might generally expect to see them used.
[image:11.595.59.538.92.394.2]clinicians but be biased towards those who are more supportive of the use of PROMs. In addition, this study has been limited to the use of PROMs in surgery and, therefore, to the views of surgical clinicians. Clinicians in other areas of health care may hold different views. It was not possible to control the number of attendees, duration and room layout. This made some of the groups quite large and, inevitably, not everyone partici-pated in the discussions.
The heterogeneity of professions and grades that attended the meetings may have affected the views people were prepared to express (e.g. concern about the opinions of peers). It was reassuring that, as regards the medical staff, junior doctors participated as much as their senior colleagues. Although non-medical clinicians attended, they made few contribu-tions such that the majority of the views expressed were those of doctors.
As regards patients, most participants had recently undergone surgery so their views may not therefore rep-resent those of people who are still to make a choice of provider. In addition, their views will have been influ-enced by their personal experiences of surgery. Whilst representative of patients in terms of age and sex, people from the poorest socio-economic group were under-represented, which may mean that our sample were also more educated.
Conclusions
Although there was a lack of unanimity both among clini-cians and patients as to the best metric policy-makers should choose, a decision has to be made as to which options would be best for dissemination to each audience. Lack of unanimity does not mean there was no discernable consensus. In addition, the discussions helped us to glean how best to explain the metrics in written instructions and labelling, and how to clarify common misunderstandings. These included the use of standard colours, consistent dir-ection of ranking (from best to worst) and clear explana-tions of concepts such as confidence intervals.
For clinicians, in response to requests for multiple metrics we recommend a categorical and a continuous outcome be used. The mean change in score (adjusted for pre-intervention score) was the most readily grasped. Although some confusion around case-mix would need clarifying, these issues may be easier to address than conveying the implicit change measurement conferred by the mean follow-up metric. Similarly, we recommend using the MID as a dichotomous outcome, and clearly outlining the methodology by which it was derived.
For patients it was apparent that rather than the sci-ence behind these measures, the most important aspect of clearly relaying them was using language that would make the metrics personally meaningful and linking
these to familiar scaling. For this audience, therefore we propose using the proportion achieving a MID (adjusted for pre-intervention score) or ‘proportion achieving a significant improvement in hip function’.
Competing interests
The authors declare that they have no competing interests.
Authors’contributions
ZH and NB conceived the study; JN, DA and ZH undertook the literature review; DA, ZH and NB undertook the qualitative research and analysis; all authors contributed to drafting the paper. All authors read and approved the final manuscript.
Acknowledgements
We thank the Department of Health’s Directorate of System Management and New Enterprise for funding; Andrew Hutchings, Susan Charman and David Smith for comments; Jiri Chard for advice; and the Library staff at the Royal College of Surgeons and the London School of Hygiene & Tropical Medicine for their efficiency in sourcing and delivering the numerous relevant texts required for the review. Finally, we are grateful to participants that took part in the clinician meetings and to participants who shared their views with us in the focus groups.
Received: 13 September 2011 Accepted: 21 June 2012 Published: 21 June 2012
References
1. Guidance on the routine collection of Patient Reported Outcome Measures (PROMs) for the NHS in England.Department of Health2009/10, [http://www.dh.gov.uk/prod_consum_dh/groups/dh_digitalassets/@dh/ @en/documents/digitalasset/dh_092625.pdf].
2. Black N, Jenkinson C:How can patients' views of their care enhance quality improvement?BMJ2009,339:202–6.
3. The NHS improvement plan: putting people at the heart of public services.Department of Health2010, [http://www.dh.gov.uk/prod_ consumdh/groups/dh_digitalassets/@dh/@en/documents/digitalasset/ dh_4084522.pdf].
4. Robertson R, Thorlby R:Patient choice.The Kings Fund2008,2008. 5. Department of Health:The NHS in England: the operating framework for
2008/9. 2010, [http://www.dh.gov.uk/prod_consum_dh/groups/ dh_digitalassets/@ dh/@en/documents/digitalasset/dh_091446.pdf]. 6. Hildon Z, Allwood D, Black N:Impact of format and content of visual
display of data on comprehension, choice and preference: a systematic review.Int J Qual Health Care2012,24:55–64.
7. Hildon Z, Allwood D, Black N:Patients’views of the format and content of statistical comparisons of healthcare performance.Patient Educ Couns, in press.
8. Allwood D, Hildon Z, Black N:Clinicians’views of formats of performance comparisons.J Eval Clin Pract2011. doi:10.1111/j.1365-2753.2011.01777.x. 9. Brooks R, EuroQol Group:EuroQol: the current state of play.Health Policy
1996,37:53–72.
10. Cheung K, Oemar M, Oppe M, Rabin R:EQ-5D User Guide: Basic Information on how to Use the EQ-5D.Version 2.0. Rotterdam: EuroQoL Group; 2009. 11. The EuroQol group:Euroqol–a new facility for the measurement of
health-related quality of life.Health Policy1990,16:199–208.
12. Garratt AM, Macdonald LM, Ruta DA, Russell IT, Buckingham JK, Krukowski ZH: Towards measurement of outcome for patients with varicose veins.
Qual Health Care1993,2:5–10.
13. Dawson J, Fitzpatrick R, Carr A, Murray D:Questionnaire on the perceptions of patients about total hip replacement.J Bone Joint Surg Br
1996,78:185–90.
14. Dawson J, Fitzpatrick R, Murray D, Carr A:Questionnaire on the perceptions of patients about total knee replacement.J Bone Joint Surg Br1998,80-B:63–9. 15. Petticrew M, Roberts H:Systematic reviews in the social sciences: A practical
guide. Oxford: Wiley-Blackwell; 2005.
17. Laird N:Comparative analyses of pre-test:post-test research designs.
Amer Statistician1983,37:329–330.
18. Chard J, Kuczawski M, Black N, van der Meulen J:Outcomes of elective surgery undertaken in Independent Sector Treatment Centres and NHS providers in England: the Patient Outcomes in Surgery Audit.BMJ2011, 343:d6404. doi:10.1136/bmj.d6404.
19. Shepperd S, Harwood D, Jenkinson C, Gray A, Vessey M, Morgan P: Randomised controlled trial comparing hospital at home care with inpatient hospital care. I: Three month follow up of health outcomes.
BMJ1998,316:1786–1791.
20. Round A, Crabb T, Buckingham K, Mejzner R, Pearce V, Ayres R, Weeks C, Hamilton W:Six month outcomes after emergency admission of elderly patients to a community or a district general hospital.Family Practice
2004,21:173–179.
21. Campbell A:The evaluation of a model of primary mental health care in rural Tasmania.Aust J Rural Health2005,13:142–148.
22. Siggeirsdottir K, Olafsson O, Jonsson H, Iwarsson S, Gudnason V, Jonsson BY: Short hospital stay augmented with education and home-based rehabilitation improves function and quality of life after hip replacement: Randomized study of 50 patients with 6 months of follow-up.Acta Orthop
2005,76:555–562.
23. Ryan T, Enderby P, Rigby AS:A randomized controlled trial to evaluate intensity of community-based rehabilitation provision following stroke or hip fracture in old age: Results at 12-month follow-up.Int J Disabil Hum Dev2006, 5:83–89.
24. Browne J, Jamieson E, Lewsey J, van der Meulen J, Black N, Cairns J, Lamping D, Smith S:Patient Reported Outcome Measures (PROMs) in elective surgery.Department of Health2007, [http://www.lshtm.ac.uk/php/ hsrp/research/proms_report_12_dec_07.pdf].
25. Browne J, van der Meulen JH, Lewsey JD, Lamping DL, Black N:Mathematical coupling accounted for the association between baseline severity and minimally important difference value.J Clin Epidemiol2009,63:865–874. 26. Judge A, Arden N, Cooper C, Dieppe P:A statistical tool for individual prediction for individual risk and benefit from knee replacement surgery. London: NHS Institute for Innovation and Improvement; 2010.
27. van Eck JWM, van Hemel NM, van den BA, Taks W, Grobbee DE, Moons KGM: Predictors of improved quality of life 1 year after pacemaker implantation.
Am Heart J2008,156:491–97.
28. Walters SJ, Brazier JE:Comparison of the minimally important difference for two health state utility measures: EQ-5D and SF-6D.Qual Life Res2005, 14:1523–32.
29. Jaeschke R, Singer J, Guyatt GH:Measurement of health status. Ascertaining the minimal clinically important difference.Control Clin Trials1989,10:407e15. 30. Kvien TK, Heiberg T, Hagen KB:Minimal clinically important improvement/
difference (MCII/MCID) and patient acceptable symptom state (PASS): what do these concepts mean?Ann Rheum Dis2007,66(Suppl-3):iii40–iii41. 31. van der Roer N, Ostelo RW, Bekkering GE, van Tulder MW, de Vet HC:
Minimal clinically important change for pain intensity, functional status, and general health status in patients with nonspecific low back pain.
Spine2006,31:578–82.
32. Norman G, Wyrwich KW, Sloan JA:Interpretation of changes in health-related quality of life: the remarkable universality of half a standard deviation.
Med Care2003,41:582–92.
33. Alonso J, Croudace T, Brown J, Gasquet I, Knapp M, Suarez D, Novick D: Health-related quality of life (HRQL) and continuous antipsychotic treatment: 3-year results from the schizophrenia health outcomes (SOHO) study.Value Health
2009,12:536–543.
34. Anis AH, Nosyk B, Sun H, Guh DP, Bansback N, Li X, Barnett PG, Joyce V, Swanson KM, Kyriakides TC, Holodniy M, Cameron DW, Brown ST:Quality of life of patients with advanced HIV/AIDS: Measuring the impact of both AIDS-defining events and non-AIDS serious adverse events.J Acquir Immune Defic Syndr2009,51:631–639.
35. Darlington A, Dippel DWJ, Ribbers GM, van Balen R, Passchier J, Busschbach JJ: Coping strategies as determinants of quality of life in stroke patients: A longitudinal study.Cerebrovasc Dis2007,23:401–407.
36. Hajat S, Fitzpatrick R, Morris R, Reeves B, Rigge M, Williams O, Murray D, Gregg P: Does waiting for total hip replacement matter? Prospective cohort study.
J Health Serv Res Policy2002,7:19–25.
37. Lacey EA, Walters SJ:Continuing inequality: Gender and social class influences on self perceived health after a heart attack.J Epidemiol Community Health
2003,57:622–627.
38. Schluessmann E, Diel P, Aghayev E, Zweig T, Moulin P, Roder C, SWISSspine Registry Group:SWISSspine: A nationwide registry for health technology assessment of lumbar disc prostheses.Eur Spine J2009,18:851–61. 39. Kalairajah Y, Azurza K, Hulme C, Molloy S, Drabu KJ:Health Outcome Measures
in the evaluation of total hip Arthroplasties–a comparison between the Harris Hip score and the Oxford Hip Score.J Arthroplasty2005,20:1037–1041. 40. Streiner DL, Norman GR:Health Measurement Scales. A practical guide to
their development and use. Oxford: Oxford University Press; 2008.
doi:10.1186/1472-6963-12-171
Cite this article as:Hildonet al.:Clinicians’and patients’views of metrics of change derived from patient reported outcome measures
(PROMs) for comparing providers’performance of surgery.BMC Health
Services Research201212:171.
Submit your next manuscript to BioMed Central and take full advantage of:
• Convenient online submission
• Thorough peer review
• No space constraints or color figure charges
• Immediate publication on acceptance
• Inclusion in PubMed, CAS, Scopus and Google Scholar
• Research which is freely available for redistribution