MAXILLARY PROTRACTION USING DIFFERENT
MINIPLATE DIAMETERS AND FORCE LEVELS -A3
DIMENSIONAL FINITE ELEMENT ANALYSIS
Dissertation submitted to
The Tamil Nadu Dr M.G.R. Medical University
In partial fulfillment of the degree of
MASTER OF DENTAL SURGERY
BRANCH V
ORTHODONTICS AND DENTOFACIAL ORTHOPEDICS
First and foremost, praises and thanks to the God, the Almighty, for His
showers of blessings throughout my research work to complete the research
successfully.
I would like to acknowledge and thank my guide, Dr.P.ANIL KUMAR
MDS, Professor and Head, Department of Orthodontics, Sree Mookambika
Institute of Dental Sciences, Kulashekaram. I consider myself extremely
fortunate to have had the opportunity to train under him. His enthusiasm,
integral view on research, tireless pursuit for perfection and mission for
providing ‘high quality work’, has made a deep impression on me. He has
always been a source of inspiration to strive for better not only in academics
but also in life. His patience and technical expertise that he has shared
throughout the duration of the course has encouraged me in many ways.
I express my sincere thanks to Dr.ELIZABETH KOSHI MDS,
Principal, Sree Mookambika Institute of Dental Sciences, Kulashekaram for
allowing me to utilize the clinical material and facilities for the completion of
this dissertation.
I am privileged to express my extreme gratefulness to my respected
Co-Guide, Dr.AMAL S NAIR, MDS SMIDS Kulashekaram for his undying
enthusiasm and guidance which helped me complete this study. His everlasting
part of my post graduate course during which I have come to know his outlook
towards life and wish to inculcate it someday.
I express my deep sense of gratitude and indebtedness to Dr.ANTONY
SHIJOY AMALDAS, MDS, Reader, SMIDS Kulashekaram for always being
a pillar of support and encouragement. His simplicity, innovative approaches
and impetus throughout the duration of my course has encouraged me in many
ways.
I am exceptionally gratified and sincerely express my thanks to
Dr.DAVIS.T.DANNY, Senior Lecturer. SMIDS Kulashekaram without whose
counsel this study would be incomplete. He has taught me the methodology to
carry out the research and to present the research works as clearly as possible.
I would like to acknowledge Dr.ANJANA.S.NAIR MDS, SMIDS
Kulashekaram, for her support, enthusiasm & professional assistance
throughout my post graduate course. I would also like to thank her for her
friendship, empathy, and great sense of humor.
I would also express my gratitude to Dr.JEBILA MDS, SMIDS,
Kulashekaram, for her constant encouragement and help.
I would also like to acknowledge and express my gratitude to former
days.
This would have been impossible without the help, guidance and
inspiration of two persons. My sincere thanks go out to Dr.JIJI C.V, Principal,
and Dr.ARUN V.T Associate Professor, CET, Thiruvananthapuram for
providing me with an opportunity to utilize the facilities available in this
institution in order to conduct this study and for his valuable suggestions during
my statistical work.
I would also like to thank my seniors Dr.Harsha, Dr.Thasneem,
Dr.Surya and Dr.Chandana for all the valuable guidance throughout my
postgraduate days.
My heartfelt thanks to my wonderful immediate juniors
Dr.Gnananandhan and Dr.Megha, who were more like a family, and were
cheerfully available at all times to help me. I wish them a successful career
ahead.
I thank my subjuniors Dr.Krishnadharani and Dr.Naveena for all their
support and cheerful moments.
And to My parents-my world, I am forever indebted. They have always
been there to show me the right path and to correct me when I have strayed.
Life, as I see it is only because of the love, guidance and support they have
law for all of the sacrifices that you’ve made on my behalf. Your prayer for me
was what sustained me thus far.
And finally, I want to thank my truly amazing husband, Dinesh D.M,
who is my best friend, closest advisor, dedicated co parent and the love of my
life. He supported me every step of the way, as he always does, with patience,
great insight, humor and love.
May god bless you all abundantly.
SPECIAL ACKNOWLEDGEMENT
I take this opportunity to thank Dr.C.K Velayudhan Nair MS,
Chairman, Dr.Rema.V.Nair MD, Director, Trustees Dr.R.V Mookambika
MD,DM, and Dr.Vinu Gopinath MS, MCh and Dr.Elizabeth Koshi MDS,
Principal Sree Mookambika Institute of Dental Sciences, Kulasekharam, Tamil
Nadu for giving me an opportunity to utilize the facilities available in this
S NO
TITLE
PAGE NO
1
LIST OF ABBREVIATIONS
i
2
LIST OF FIGURES
ii-vi
3
LIST OF TABLES
vii
4
LIST OF GRAPHS
viii
5
LIST OF ANNEXURES
ix
6
ABSTRACT
x-xi
7
INTRODUCTION
1-9
8
AIMS AND OBJECTIVES
10
9
REVIEW OF LITERATURE
11-41
10
MATERIALS AND METHODS
42-47
11
RESULTS AND OBSERVATIONS
48-53
12
TABLES
54-61
13
DISCUSSION
62-72
14
SUMMARY AND CONCLUSION
73-75
i
ANOVA Analysis of Variance
BAMP Bone Anchored Maxillary Protraction
CAD Computer aided design
CT Computerized Tomography
FEA Finite Element Analysis
FEM Finite Element Method
FM Facemask
MARPE Minimplant assisted rapid palatal expansion
MI Minimplants
Mpa Megapascals
MP Miniplate
N Newton
PS Primary Stability
RPE Rapid Palatal Expansion
STL Standard Tessellation Language
TSAD Temporary screw anchorage system
TAD Temporary Anchorage Device
3 D Three Dimensional
ii
FIGURE NO DETAILS
Figure No-1 Diagrammatic representation of 1.5mm implant diameter-0.5mm pitch
Figure No-2 Diagrammatic representation of 1.5mm implant diameter-1 mm pitch
Figure No-3 Diagrammatic representation of 1.5mm implant diameter-1.5 mm pitch
Figure No-4 Diagrammatic representation of 2mm implant diameter-0.5 mm pitch
Figure No-5 Diagrammatic representation of 2mm implant diameter-1 mm pitch
Figure No-6 Diagrammatic representation of 2mm implant diameter-1.5 mm pitch
Figure No-7 Dia Diagrammatic representation of 2.5mm implant diameter-0.5 mm
pitch
Figure No-8 Diagrammatic representation of 2.5mm implant diameter-1 mm pitch
Figure No-9 Diagrammatic representation of 2.5mm implant diameter-1.5 mm pitch
Figure No-10 Wire framework of implant with bone model
Figure No-11 3 D model of implant with bone model
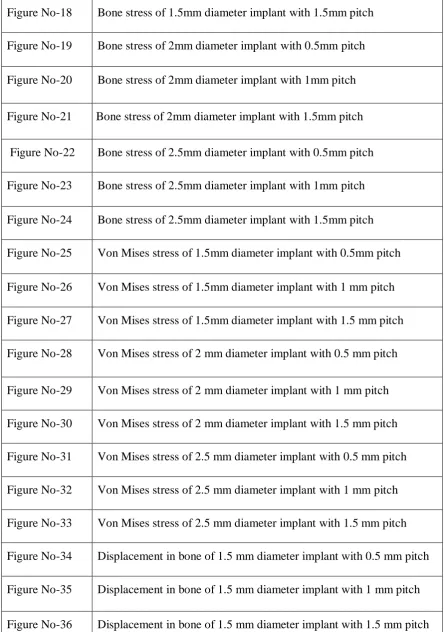
Figure No-12 Mesh frame of 3 D model
Figure No-13 Contact mesh of implant with bone
Figure No-14 Fixed support
Figure No-15 Force Direction
Figure No-16 Bone stress of 1.5mm diameter implant with 0.5mm pitch
iii
Figure No-19 Bone stress of 2mm diameter implant with 0.5mm pitch
Figure No-20 Bone stress of 2mm diameter implant with 1mm pitch
Figure No-21 Bone stress of 2mm diameter implant with 1.5mm pitch
Figure No-22 Bone stress of 2.5mm diameter implant with 0.5mm pitch
Figure No-23 Bone stress of 2.5mm diameter implant with 1mm pitch
Figure No-24 Bone stress of 2.5mm diameter implant with 1.5mm pitch
Figure No-25 Von Mises stress of 1.5mm diameter implant with 0.5mm pitch
Figure No-26 Von Mises stress of 1.5mm diameter implant with 1 mm pitch
Figure No-27 Von Mises stress of 1.5mm diameter implant with 1.5 mm pitch
Figure No-28 Von Mises stress of 2 mm diameter implant with 0.5 mm pitch
Figure No-29 Von Mises stress of 2 mm diameter implant with 1 mm pitch
Figure No-30 Von Mises stress of 2 mm diameter implant with 1.5 mm pitch
Figure No-31 Von Mises stress of 2.5 mm diameter implant with 0.5 mm pitch
Figure No-32 Von Mises stress of 2.5 mm diameter implant with 1 mm pitch
Figure No-33 Von Mises stress of 2.5 mm diameter implant with 1.5 mm pitch
Figure No-34 Displacement in bone of 1.5 mm diameter implant with 0.5 mm pitch
Figure No-35 Displacement in bone of 1.5 mm diameter implant with 1 mm pitch
Figure No-36 Displacement in bone of 1.5 mm diameter implant with 1.5 mm pitch
[image:15.595.86.531.73.705.2]iv
Figure No-39 Displacement in bone of 2 mm diameter implant with 1.5 mm pitch
Figure No-40 Displacement in bone of 2.5 mm diameter implant with 0.5 mm pitch
Figure No-41 Displacement in bone of 2.5 mm diameter implant with 1 mm pitch
Figure No-42 Displacement in bone of 2.5 mm diameter implant with 1.5mm pitch
Figure No-43 Displacement of 1.5 mm diameter implant with 0.5 mm pitch-Y
direction
Figure No-44 Displacement of 1.5mm diameter implant with 1mm pitch-Y direction
Figure No-45 Displacement of 1.5 mm diameter implant with 1.5mm pitch-Y
direction
Figure No-46 Displacement of 2 mm diameter implant with 0.5 mm pitch-Y
direction
Figure No-47 Displacement of 2 mm diameter implant with 1 mm pitch-Y direction
Figure No-48 Displacement of 2 mm diameter implant with 1.5 mm pitch-Y
direction
Figure No-49 Displacement of 2.5 mm diameter implant with 0.5 mm pitch-Y
direction
Figure No-50 Displacement of 2.5 mm diameter implant with 1 mm pitch-Y
direction
Figure No-51 Displacement of 2.5mm diameter implant with 1.5 mm pitch-Y
direction
v
Figure No-54 Von Mises stress of 1.5mm implant diameter of 0.5mm pitch-2N
Figure No-55 Von Mises stress of 1.5mm implant diameter of 0.5mm pitch-4N
Figure No-56 Von Mises stress of 1.5mm implant diameter of 0.5mm pitch-6N
Figure No-57 Von Mises stress of 1.5mm implant diameter of 0.5mm pitch-8N
Figure No-58 Von Mises stress of 1.5mm implant diameter of 1mm pitch-2N
Figure No-59 Von Mises stress of 1.5mm implant diameter of 1mm pitch-4N
Figure No-60 Von Mises stress of 1.5mm implant diameter of 1mm pitch-6N
Figure No-61 Von Mises stress of 1.5mm implant diameter of 1mm pitch-8N
Figure No-62 Von Mises stress of 1.5mm implant diameter of 1.5mm pitch-2N
Figure No-63 Von Mises stress of 1.5mm implant diameter of 1.5mm pitch-4N
Figure No-64 Von Mises stress of 1.5mm implant diameter of 1.5mm pitch-6N
Figure No-65 Von Mises stress of 1.5mm implant diameter of 1.5mm pitch-8N
Figure No-66 Von Mises stress of 2mm implant diameter of 0.5mm pitch-2N
Figure No-67 Von Mises stress of 2mm implant diameter of 0.5mm pitch-4N
Figure No-68 Von Mises stress of 2mm implant diameter of 0.5mm pitch-6N
Figure No-69 Von Mises stress of 2mm implant diameter of 0.5mm pitch-8N
Figure No-70 Von Mises stress of 2mm implant diameter of 1mm pitch-2N
vi
Figure No-73 Von Mises stress of 2mm implant diameter of 1mm pitch-8N
Figure No-74 Von Mises stress of 2mm implant diameter of 1.5mm pitch-2N
Figure No-75 Von Mises stress of 2mm implant diameter of 1.5mm pitch-4N
Figure No-76 Von Mises stress of 2mm implant diameter of 1.5mm pitch-6N
Figure No-77 Von Mises stress of 2mm implant diameter of 1.5mm pitch-8N
Figure No-78 Von Mises stress of 2mm implant diameter of 1.5mm pitch-2N
Figure No-79 Von Mises stress of 2.5mm implant diameter of 0.5mm pitch-4N
Figure No-80 Von Mises stress of 2.5mm implant diameter of 0.5mm pitch-6N
Figure No-81 Von Mises stress of 2.5mm implant diameter of 0.5mm pitch-8N
Figure No-82 Von Mises stress of 2.5mm implant diameter of 1mm pitch-2N
Figure No-83 Von Mises stress of 2.5mm implant diameter of 1mm pitch-4N
Figure No-84 Von Mises stress of 2.5mm implant diameter of 1mm pitch-6N
Figure No-85 Von Mises stress of 2.5mm implant diameter of 1mm pitch-8N
Figure No-86 Von Mises stress of 2.5mm implant diameter of 1.5mm pitch-2N
Figure No-87 Von Mises stress of 2.5mm implant diameter of 1.5mm pitch-4N
Figure No-88 Von Mises stress of 2.5mm implant diameter of 1.5mm pitch-6N
vii
TABLE NO DETAILS
Table No-1 Von Mises stress in bone(Mpa)
Table No-2 Displacement in micrometer
Table No-3 Maximum Von Mises stress of 1.5mm implant diameter
Table No-4 Displacement in bone of 1.5mm implant diameter
Table No-5 Maximum Von Mises stress of 2mm implant diameter
Table No-6 Displacement in bone of 1.5mm implant diameter
Table No-7 Maximum Von Mises stress of 2.5mm implant diameter
Table No-8 Displacement in bone of 1.5mm implant diameter
Table No-9 Calculation of maximum von Mises stress on bone for various
implants
Table No-10 ANOVA - 1.5mm Diameter ImplantStress
Table No-11 ANOVA - 2mm Diameter Implant Stress
Table No-12 ANOVA – 2.5mm Diameter Implant Stress
Table No-13 ANOVA- Total Samples Stress
viii
GRAPH NO DETAILS
Graph No-1 Stress distribution vs pitch of different implant diameters
Graph No-2 Displacement vs pitch of different implant diameters
Graph No-3 Stress distribution vs pitch for 1.5mm diameter implant
Graph No-4 Displacement vs pitch for 1.5mm diameter implant
Graph No-5 Stress distribution vs pitch for 2 mm diameter implant
Graph No-6 Displacement vs pitch for 2 mm diameter implant
Graph No-7 Stress vs pitch for 2.5 mm diameter implant
Graph No-8 Displacement vs pitch for 2.5 mm diameter implant
Graph No-9 Stress vs implant diameter for 0.5 mm pitch
Graph No-10 Stress vs implant diameter for 1 mm pitch
ix
Annexure No Details
1. Institutional Research Committee Certificate
2. Institutional Human Ethics Committee Certificate
3. Certification for FEM
x Introduction
The purpose of the study is to compare the stress distribution pattern in
maxilla and mandible during maxillary protraction with different miniplate diameters
(1.5 mm,2 mm,2.5mm)of different miniimplant thread pitches (0.5 mm,1mm,1.5mm)
using different intermaxillary elastics (2 N,4 N,6 N,8 N).
Materials and methods
A 3D finite element model of maxilla with miniplate at infrazygomatic
buttress and mandible with miniplate at mandibular parasymphysis was prepared
using Autocad software along with the plate geometry. The stress distributions and
displacement were analyzed using Ansys software, in the form of Von Mises stress.
Results
In implant study,the Von Mises stress in bone(Mpa) of 2mm diameter implant
with 1 mm pitch is 142 Mpa which was least compared to 0.5mm pitch is 170 Mpa
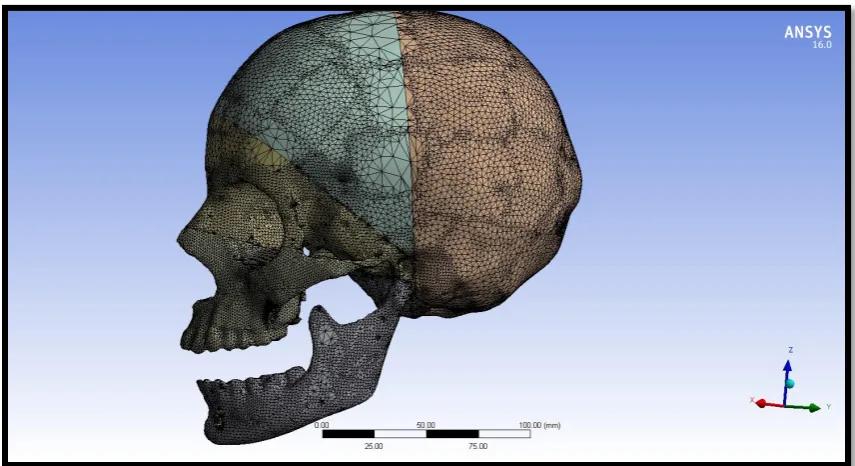
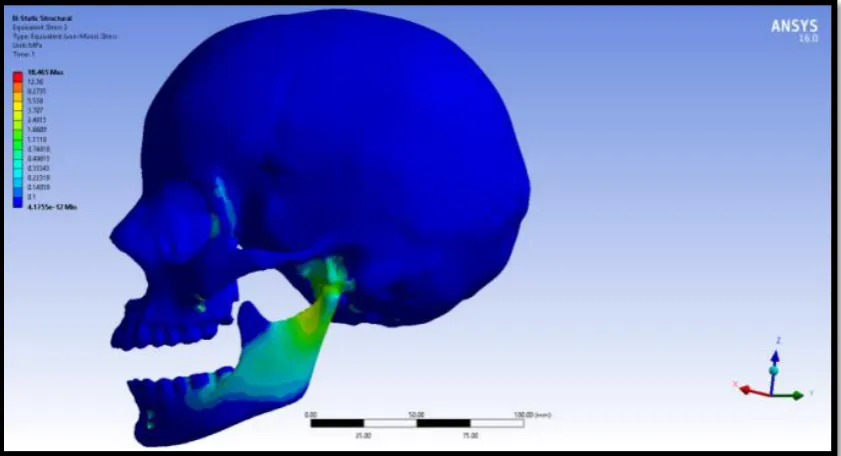
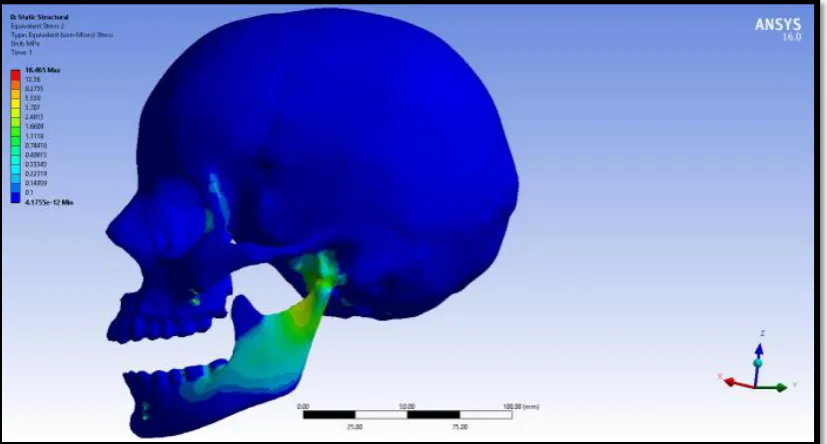
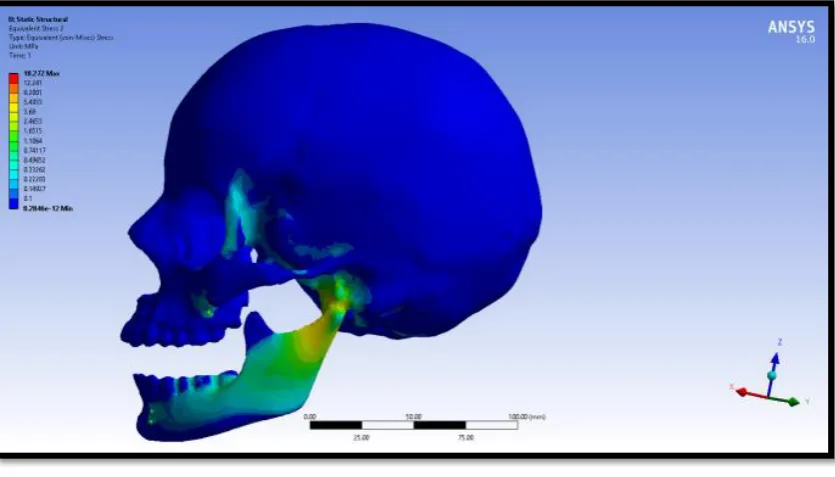
and 1.5mm pitch is 233 Mpa.In skull study,when different forces of 2 N,4N,6N and
8N was applied, the maximum Von Mises stress of the skull of 2 mm implant
diameter with 0.5mm,1mm and 1.5mm pitch was (18.454 Mpa,18.47 Mpa and 18.344
Mpa), (18.465 Mpa,18.492 Mpa and 18.244 Mpa),(18.388 Mpa,18.43 Mpa and
18.086 Mpa), (18.272 Mpa,18.324 Mpa and 17.883 Mpa) respectively which was
similar compared to other two diameters.
xi Conclusion
In implant study, when 1.5mm,2mm and 2.5mm diameter implant of
0.5mm,1mm and1.5mm pitch were compared,2mm diameter of 1 mm pitch shows
the least stress in bone. In skull study, 2 mm diameter minimplants showed similar
stress distribution pattern in the maxilla and mandible regardless of pitch
variants and different force application.
Keywords
1 Facial and smile attractiveness play a key role in social interaction. An esthetic
smile is comprised of proper tooth alignment, inclination and symmetric dental arch 1.
The craniofacial anomaly we describe today as the Class III malocclusion was
described as early as the 18th century by Bourdet who called “attention to the
deformity in children with protruding chins”. In the 19th century, Delabarre used the
terms “edge-to-edge” and “underbite to describe the malocclusion. Many other
descriptive terms have been used throughout the literature to denote the malocclusion
such as mesial occlusion, infraversion, anteversion, prenormal, progenic,
macrognathic and mandibular overbite2 .
Angle first published his classification of malocclusion in 1899 in which he
described Class III as “the relation of the jaws was abnormal, all the lower teeth
occluded mesial to the normal width of one bicuspid or even more in extreme cases”3.
A normal occlusion is generally characterised by a union of a balanced facial skeleton
and harmony in the growth between the mandible, maxilla and cranial base in size,
position and form. Class III malocclusions are characterised as a facial dysplasia
produced by excessive growth disharmony of the mandible in size, form and position
with respect to the maxilla and/ or cranial base2. Therefore it may imply that the
malocclusion is associated with a different manner of craniofacial growth when
compared with normal occlusion. There is a paucity of data on the growth
characteristics of Class III malocclusions. This is not only because of the relatively
low prevalence of this malocclusion in the different ethnic groups, but also due to the
well recognized need for early intervention by both the public and dental
2 The recurring theme of the characteristic growth of the malocclusion is that it
is not self-correcting and will worsen with time. Treatment of the Class III
malocclusion poses a challenge to the clinician. The timing of treatment varies from
early intervention during the pre-pubertal stages of growth, to intervention after the
patient has completed their active growth. The treatment modalities range from
dentofacial orthopaedic treatment, to camouflage orthodontic treatment to a combined
orthognathic surgical and orthodontic approach. Protraction facemask with maxillary
expansion has been advocated as one of the treatment modalities in the early
treatment of Class III malocclusion4. This involves using an extra-oral appliance for
14-16 hours per day. The expansion is intended to open the circummaxillary sutures
or “disarticulate” the maxilla to allow for its protraction. This has been demonstrated
to produce both dental and skeletal effects to correct the malocclusion4,5,6.
The recent incorporation of skeletal anchorage into the discipline of
orthodontics has led to their utilization in the orthopedic treatment of Class III
malocclusions. Recently surgical plates have been placed in the maxilla and mandible
and intermaxillary Class III elastics have been worn full time to protract the maxilla7.
This eliminates the need for the cumbersome extraoral headgear appliance and the
protraction is maintained full time. The recent advances in the treatment of Class III
malocclusions to “disarticulate” the maxilla and the recent invent of skeletal
anchorage has culminated in my research of the use of skeletal anchorage in
conjunction with intermaxillary Class III elastics in the treatment of Class III
3 The titanium miniplates used for anchorage now offers the possibility to apply
pure bone-borne orthopedic forces between the maxilla and the mandible for 24 hours
per day, avoiding any dento-alveolar decompensations8,9. Currently, miniscrews and
miniplates are being widely used because of their small size and superiority over
endossous implants due to the fact that they can be immediately loaded8. The major
disadvantage of miniscrew is that their primary stability can be lost, which usually
occurs within the first two weeks of treatment.
Primary stability refers to the main factors affecting the patient such as host
bone properties (quantity and quality of the jawbone at the placement site), surgery
procedure (mandibular plane angle, torque and force levels) and design properties of
the miniscrew10. (such as diameter, length, thread shape, thread pitch and screw
material). When the screw loses its primary stability, failure is normally due to
loosening. Among the various design parameters of a miniscrew, thread pitch plays an
important role because of the influence on anchorage surfaces.
Jones (1964) defined thread pitch as: “The distance from the center of the
thread to the center of the next thread, measured parallel to the axis of a screw”11.
Thread pitch performs the function of providing stability for the miniscrew, but it
seems that the changes in the stresses from pitch variants are not yet clearly
recognized because much investigation has not been conducted due to data variation
in published studies. Thread pitch is one of the most important parameters that
provide initial stability for the miniscrew.Miniplates have a very high success rate
4 This study was planned to explore more in detail how from light orthopaedic
forces to heavy orthopedic forces(2N,4N,6N,8N) generated by mini-plates of different
dimensions (1.5mm,2mm,2.5mm) get dissipated within the maxilla and mandible.
Therefore, the aim of this study was to evaluate the pattern of stress distribution in
maxilla and mandible with intermaxillary elastics to various mini-implants, using a
three-dimensional FE study.
AN INTRODUCTION TO FINITE ELEMENT ANALYSIS
Finite element method (FEM) or Finite Element Analysis (FEA) is a
contemporary research tool for an orthodontist.FEM is an engineering method of
calculating stresses and strains in all materials including living tissues12.
The finite element analysis provides the orthodontist with quantitative data
that can extend the understanding of physiologic reactions that occur within the
dentoalveolar complex. Such numerical techniques may yield an improved
understanding of the reactions and interactions of individual tissues
Finite Element Analysis (FEA) dates back to 1943 when R. Courant first
developed this technique..It was applied in dentistry and termed by Clough in
196013.It was introduced in implant dentistry in 1976 by Weinstein12. Growth model documented by MOSS in 1980 used FEM14.
This is a numerical form of analysis that allows stresses and displacements to
be identified. The object to be studied is graphically simulated in a computer in the
5 This mesh is divided by a process called discretization, into a number of
subunits termed elements. These are connected at a finite number of points called
nodes. The results of FEM will be based upon the nature of the modeling systems and
for that reason, the procedure for modeling is most important.By knowing the
mechanical properties of the object such as modulus of elasticity and Poisson’s ratio
one can determine how much distortion each part of the cube undergoes when other
part is moved by a force
BASIC STEPS IN FINITE ELEMENT ANALYSIS15,16
Pre-processing.
Conversion of geometric model into finite element model.
Assembly/Material Property data representation.
Defining the boundary conditions.
Loading Configuration.
Processing.
Post-processing
Pre-Processing basically involves modelling of the structure being studied,
probably the most crucial step. The purpose of the geometric modeling phase is to
represent geometry in terms of points, lines, areas and volume. Complicated or
smooth objects can be represented by geometrically simple pieces (Elements) .This
6
Discretization17 is the process of dividing the structure into several small
elements, connected with nodes .All elements and nodes must be numbered so that a
setup of matrix connectivity is established.the elements could be one, two or
three-dimensional and in various shapes. It is essential that the elements are not overlapping
but are connected only at the key points, which are termed nodes. The joining of
elements at the nodes and eliminating duplicate nodes is termed as ‘Meshing’. The
finite element model generation can be achieved with the help of ANSYS software.
Each element is free to get displaced in all the three planes of space. Equations are
developed for each element in the FEM mesh and assembled into a set of global
equations that model the properties of the entire system.
The minimum properties to be assigned are
a) The Modulus of elasticity and
b)Poisson’s ratio.
The modulus of elasticity18 (= Young’s modulus) E is a material property,
that describes its stiffness and is therefore one of the most important properties of
solid materials. Mechanical deformation puts energy into a material. The energy is
stored elastically or dissipated plastically. The way a material stores this energy is
summarized in stress-strain curves.
Stress is defined as force per unit area and strain as elongation or contraction
7 When a material deforms elastically, the amount of deformation likewise
depends on the size of the material, but the strain for a given stress is always the same
and the two are related by
Hooke´s Law (stress is directly proportional to strain):
σ = E.ϵ
where σ is stress [ MPa ]
E modulus of elasticity [MPa]
ε strain [unitless or %]
From the Hook’s law the modulus of elasticity is defined as the ratio of the stress to
the strain.
E = 𝜎
∈
Stress is not directly measurable. We can calculate it from different formulas
for different types of the loading (tension, flexural stress,…)
Strain is defined as the change of the length divided by the original (initial)
length.
∈ =∆𝑙 𝑙𝑜 =
𝑙1− 𝑙𝑜 𝑙𝑜
where ∆l is change of the length
[m] l1 length after elongation
8
Poisson's ratio is a measure of the Poisson effect, the phenomenon in which a
material tends to expand in directions perpendicular to the direction of compression.
Conversely, if the material is stretched rather than compressed, it usually tends to
contract in the directions transverse to the direction of stretching. Again, the Poisson
ratio will be the ratio of relative contraction to relative expansion and will have the
same value as above. In certain rare cases, a material will actually shrink in the
transverse direction when compressed (or expand when stretched) which will yield a
negative value of the Poisson ratio.
The Poisson's ratio of a stable, isotropic, linear elastic material will be greater
than −1.0 or less than 0.5 because of the requirement for Young's modulus, the shear
modulus and bulk modulus to have positive values19. Assuming that the material is
stretched or compressed along the axial direction (the x axis in the diagram below):
= −𝑑∈ 𝑡𝑟𝑎𝑛𝑠
𝑑∈ 𝑎𝑥𝑖𝑎𝑙
Where
is the resulting Poisson's ratio,
∈ 𝑡𝑟𝑎𝑛𝑠 is transverse strain (negative for axial tension (stretching), positive
for axial compression)
𝑑∈ 𝑎𝑥𝑖𝑎𝑙 is axial strain (positive for axial tension, negative for axial
9
Boundary conditions
Suppose an element is constructed on the computer and a force is applied to it,
it will act like a free-floating rigid body and will undergo a translatory or rotatory
motion or a combination of the two without experiencing deformation. To study its
deformation, some degrees of freedom(movement of the node in each direction x, y,
and z) for some of the nodes must be restricted.Such constraints are termed boundary
conditions20.
Application of force at various points of geometry and its configuration
These can be either force or moments and be directed at any node in all the
three planes of space. The stresses are determined from the strains by Hooke's law.
The output from the Finite Element Analysis is primarily in the numerical form. It
usually consists of nodal values of the field variables and its derivatives. The output is
primarily in the form of color-coded maps6. The quantitative analysis is determined
10 To compare the stress distribution pattern in maxilla and mandible during
maxillary protraction with
1. Different intermaxillary elastics (2 N,4 N,6 N,8 N)
2. Different miniplate diameters (1.5 mm,2 mm,2.5mm)
11
Moss et al (1985)14 described the growth of craniofacial structures by finite
element for the development of a new and potentially clinically useful method.In
practice, the FEM permits analysis of the skull at a scale significantly finer than
previously possible, by considering cranial structures consisting of a relatively large
number of contiguous finite elements.
Tanne et al (1989)21 investigated stress distribution pattern in maxillary
complex using FEM model. A posteriorly directed force of 1.0kg was applied to the
maxillary first molars in the directions parallel and 30° inferior to the occlusal plane.
Results showed that the maxillary complex exhibits posteroinferior displacement with
clockwise rotation from the horizontal headgear force. This becomes more prominent
as the direction of force becomes more inferior.
Sachdeva et al (1988)22 explored the biomechanical impact of a distally directed orthopedic force on the craniofacial complex utilizing finite element model
of craniofacial skeleton of a dry human skull. The model comprised of 2918 nodes
and 1776 elements, and was utilized to explore the biomechanical impact. The force
was applied at the level of the maxillary first molar. The outcomes demonstrated that
the nasomaxillary complex dislodges in a backward and downward course and a
clockwise rotation. The nasomaxillary complex, including the zygomatic bone,
encounters high stress levels with those at the rest of the bones; the stress distribution
in the maxillary basal bone zone is generally uniform; and the stress distribution over
12
Kazuo Tanne et al (1991)23 assessed the biomechanical and clinical changes
in the craniofacial complex when an orthopedic force is applied for maxillary
protraction by finite element method and cephalometric analysis. A model was
created from a young human dry skull. Three prinicipal stresses were resolved in the
complex and its sutures. Lateral cephalograms were taken when maxillary protraction
treatment were analyzed to assess the morphological changes. Maxillary and
zygomatic bones shows tensile stresses in anterior direction. Compressive stresses
were delivered in the sutural frameworks which was initiated by counter clockwise
rotation of the complex. In cephalometric investigation there was a noteworthy
change of the maxillomandibular relationship, yet the development and repositioning
of maxilla were less when contrasted with mean development in the control group.
Hiraga et al (1994)24 examined the pattern of stress distribution in the
craniofacial sutures when orthopedic maxillary protraction forces are applied to the
upper canines. A three-dimensional model of the craniofacial complex was created for
investigation. An orthopedic force of 1 kg was applied to the upper canines in three
distinct ways, i.e. parallel, 30 degrees upwards and downwards to the occlusal plane.
He found that the sutural frameworks was more when 30 degrees of force was applied
upward. Frontonasal and frontomaxillary sutures demonstrated more compressive
stress, when force was applied in both parallel and 30 degress upward because of
forward and upward rotation of the nasomaxillary with considerable contortion of the
complex. When downward force of 30 degrees applied, uniform tensile stress were
delivered in the zygomaticotemporal and zygomaticomaxillary sutures, though
13 show a uniform stretch of the nasomaxillary complex in both anterior and inferior
direction.
Loukota et al (1995)25 directed an investigation to decide the compressive and tensile forces on various sorts of maxillofacial miniplates. A four point twist test
flatwise and edgewise was done after the suggestions of BS 3531 for 5 miniplates
outlines economically accessible, Champy hardened steel, Champy titanium,
Leibinger titanium, DePuy titanium, Stratec/AO titanium. Five examples of each plate
were tried and were situated symmetrically between the rollers and equivalent forces
were applied through the rollers at steady cross head speed of 1.667 x 10⁻² mm s-1. A
second arrangement of test were performed on the plates already twisted. For the
tensile test the plates were screwed through four holes on to strong metallic squares
which at that point were mounted in the testing machine. The plates were tried at a
steady cross head speed of 1.67x 10⁻²mm s-1. A second arrangement of test were
performed of the plates following a 90o curve at the mid-purpose of the plate. The
examination of the outcomes included the record of the peak load during bending and
a numerical equation was formulated to calculate bending stiffness.In the flatwise
bearing all miniplates exhibited a bending stiffness of 0.022 N m/deg to 0.028 N
m/deg. When bending the plates to recreate clinical practice the bending stiffness
decreased. They found that the plates have the ability to perform past the necessities
of the clinical circumstance and that the disappointment happened much of the time at
the screw bone interface.
14
element method. Six types of finite element models were designed to show various
thread pitches from 0.5 to 1.5 mm was the least as compared with the other models. A
traction force of 2N was applied to the head of the mini‐implant or abutment to be at
45° to the bone surface. They mentioned more favorable stress distribution of shorter
screw pitch compared with longer ones.
Beyza Hancioglu Kircellia et al (2006)27 inferred that there was a significant improvement in the mid face when an orthopedic force was applied from miniplates
by means of elastics specifically to the anterior maxillary bone. In a 11-year-old
young lady giving extreme maxillary hypoplasia and hypodontia multipurpose
titanium miniplates were placed on the lateral nasal wall of the maxilla as anchorage
during protraction. The orthopedic force applied specifically to the maxilla brought
about an eight mm maxillary advancement. An expansion appliance was given for
maxillary expansion from the median palatal suture with the intraosseous titanium
screws were likewise placed on the palatal bone, close to the alveolar crest, to give
anchorage. Seven mm of development was accomplished over the buccal sections. No
other tooth anchorage was utilized for the protraction of the maxilla. (A flexible force
of roughly 150 g was applied respectively to the miniplate expansions after the
adjustment of face mask (Leone spa, Firenze, Italy). In the wake of being certain of
the dependability, the force was expanded slowly to 350 g.
Byoun N Y et al(2006)28 compared stress distribution pattern different mini-implant diameters and insertion angle to the bone surface.A cortical bone of 1 mm
width and a hexadron of 15 x 15 x 20 mm was used.Mini-implants were embedded at
15 8 mm length and 1.2 mm, 1.6 mm, and 2.0 mm in diameter.Two hundred grams of
forces was applied to the miniimplant and stress distribution and its magnitude were
analyzed by ANSYS, a three dimensional finite element method. The discoveries of
this investigation demonstrated that most extreme von Mises stresses in the
miniimplant and cortical and cancellous bone were diminished as the diameter
increased from 1.2 mm to 2.0 mm with no connection to the insertion angle.Analysis
of stress distribution in the cortical and cancellous bone demonstrated that the stress
was observed in the cortical bone, and little was transmitted to the cancellous bone.
The contact area increased by the increased width and decreased insertion angle,
however greatest von Mises stress in cortical bone was altogether related with the
contact point of miniimplant into the cortical bone surface than the insertion
angle.The above outcomes propose that the success of the minimplant firmly related
with the diameter and contact point into the cortical bone surface as opposed to the
insertion angle.
Cornelis et al (2007)29 demonstrated the literature of use of skeletal anchorage in orthodontics to decide the functional and morphological tissue actions
around temporary anchorage decives (TAD). The consideration criteria comprises of
animal studies with skeletal anchorage of metallic bone plates or screw inserts of 2.2
mm diameter or less. He concluded that TSAD offers functional anchorage with
better clinical stability because of moderate osseointegration and rare inflammation.
However, research ought to be completed pointing the particular conventions for
16
Marie A Cornelis et al (2008)30 determined the advantages of miniplates over
the miniscrews.A aggregate of 200 miniplates were set for 97 patients where they
finished the questionnaires with respect to their experiences and the 30 orthodontics
concerning miniplate success, handling many-sided quality and whether it streamlined
the treatment. They discovered that success rate was 97.5% and very much tolerated
by the patients. Following one year of followup, 72% of the patients detailed that they
wouldn't feel of placing implant, and 82% said that the surgical experience was
superior to expected, with almost no pain. The most widely recognized issues detailed
were postsurgical swelling, which lasts for 5 days on average, and cheek irritation
experienced at first, however it decreased after some time. Therefore,they inferred
that miniplate were easy to use and are a protected and successful adjunct for complex
orthodontic treatments.
Lee et al (2008)31 assessed the stress distribution pattern in the bone and the
miniscrew when an orthopedic force was applied with two distinct kinds of miniplate
as skeletal anchorage for orthopedic treatment. Finite models were made for 6 hole
miniplate (0.8mm in thickness), which were outlined in two unique shapes-one is
curvilinear molded (C plate, Jeil Medical Co., Korea) and another, Y formed (Y
plate), settled with 3 pieces of miniscrew 2mm diameter and 6mm-long separately. A
traction force of 4 N was applied in -- , and to imaginary axis connecting
two unfixed distalmost holes of the miniplate.They discovered that the most extreme
von Mises stress in the bone was significantly more prominent in the cortical part than
in the cancellous segment. C plate demonstrated more noteworthy greatest von Mises
stress in the cortical bone and displacement of miniscrews than Y plate. The most
17 The more increased the angle of the applied orthopedic force, the greater maximum
von Mises stress in the bone and maximum displacement of the miniscrew. It was
observed that in C plate, the von Mises stress in the bone and displacement of the
miniscrew were distributed around the distalmost screw-fixed area. He concluded that
Y plate should have the advantage over C plate and in the placement of the miniplate,
its imaginary axis should be placed as parallel as possible to the direction of
orthopedic force to obtain its primary stability.
Nam Ki Lee et al (2008)32 determined the stress distribution in bone and
displacement distribution of the miniscrew in view of the length and number of the
miniscrews utilized for fixation of miniplate, and the direction of orthodontic force.
Four kinds of finite element models were intended to demonstrate different lengths (6
mm, 4 mm) and number (3, 2) of 2 mm distance across miniscrew utilized for the
fixation of six openings for a curvilinear miniplate. A traction force of 4 N was
applied at 0°, 30°, 60° and 90° to an imaginary axis connecting the two most distal
unfixed holes of the miniplate. They discovered that there was greatest Von Mises
stresses in the cortical bone than the cancellous bone and increased displacement of
miniscrews when smaller number and shorter length of miniscrews were used. They
discovered that when the point of orthopedic force increased, the more will be the
Von Mises stress. They presumed that the miniplate framework ought to be situated in
the cortical bone with 3 miniscrews of 2 mm measurement and 6 mm length, and its
imaginary axis as parallel as conceivable to the direction of orthodontic force to get
18
Provatidis et al (2008)33 compared the finite element analysis of dry human
skull with the clinical findings of Rapid Maxillary Expansion Appliance to evaluate
the effects on craniofacial complex with different ossification. He found out that the
zygomatico-maxillary suture responded to the expansion forces of the craniofacial
complex, while the maxillolacrymal, the frontomaxillary, the nasomaxillary, the
transverse midpalatal sutures, and the suture between the maxilla and pterygoid
process of the sphenoid bone does not influenced.
Veziroglu et al (2008)34 concluded that the inferior screws of the
miniplates(1.5 mm, Bollard Zygoma Anchor, Surgi-Tec, Bruges, Belgium). are the
most susceptible to stress and strain and to equalize the force distribution new plates
designs that change the location of the force application are required. To determine
the force distribution pattern he compared the Von Mises stress, principal maximum
and minimum stress, and maximum and minimum elastic strain values for each type
of miniplate. A 2 D image was obtained from computed tomographic software
(I-DEAS Arti- san 4.0 Cad-Cam Software, Structural Dynamics Re- search Corp,
Milford, Ohio) of a 14 year old patient to create a three dimensional model of the
posterior maxilla, including zygomatic butters region.Titanium miniplates and screws
were inserted into the zygomatic butterness via simulation. All materials were
assumed to be homogenous, linear elastics and fixed. A 200 gm orthodontic force
directed posterior-anteriorly to the model and evaluated. They concluded that the
newly design L-shape miniplates had little decrease of stress strain values compared
with the standard miniplates. However, more of stress strain value was noted in both
19
Leung et al (2008)35 examined the primary stability mini-implants and
miniplates To determine the stability they made three different skeletal anchorage
system. Two cylindrical mini-implants connected with a 0.021 × 0.025 inch stainless
steel (SS) wire of 1.5 mm diameter, (2) two tapered mini-implants connected with a
0.021 × 0.025 inch SS wire of 1.6 mm diameter and (3) two cylindrical mini-implants
connected by a titanium locking miniplate of 2.0 mm diameter.He concluded that the
connection of 2 miniimplants with miniplate provide a stable system for orthodontic
skeletal anchorage,resulted from higher pull out force,stiffness and yield force to
resist pulling force and deformation.
Christine L Brinley et al (2009)36 concluded that decreasing miniscrew pitch increases pullout strength, and fluting increases both placement torque and pullout
strength. A total of 60 MSIs (15 of each design) were evaluated with synthetic bone; a
split-mouth cadaver model was used to compare the three experimental designs
against the 1 mm control MSIs. Maximum placement torque and pullout strength of
experimental MSIs were compared with those of control MSIs with the use of
synthetic and cadaver bone. MSIs with 1.00 mm pitch were compared with those with
1.25 mm and 0.75 mm pitch; MSIs with three longitudinal flutes were compared with
the same MSIs without flutes.
HugoDe Clerck et al(2009)37 concluded that Titanium miniplates offers greatest anchorage on bone-borne orthopedic forces between the maxilla and the
mandible for 24 hours per day, thereby avoiding any dentoalveolar
compensations.Class III malocclusion is due to maxillary deficiency and/or
20 profile.Facemask therapy was used in younger patients with maxillary hypoplasia to
redirect the mandibular growth.This causes favourable changes in mandibular growth
with forward and downward movement of maxilla.But these resulted in posterior
rotation of the mandible and vertical dimension of the face was increased.
Gavin C Heymann et al(2010)6found out an alternative method for maxillary protraction over conventional method. The conventional method of early Class III
treatment was reverse-pull headgear but usually accompanied with dentoalveolar
compensations. To eliminate this, he used intermaxillary elastics from titanium
miniplates for better skeletal anchorage without causing any unfavourable
dentoalveolar effects. He treated six consecutive patients (3 boys, 3 girls; ages, 10-13
years 3 months) with Class III occlusion and maxillary deficiency with intermaxillary
elastics to titanium miniplates. 3 dimensional models were created using cone-beam
computed tomography scans taken before and after treatment on non growing
structures in the anterior cranial base to determine anatomic changes during
treatment.He found out that the effect of the intermaxillary elastic forces was
throughout the nasomaxillary structures.There was a better improvement in skeletal
relationships of maxillary protraction with little dentoalveolar units in all 6 patients.
HugoDe Clerck et al(2010)38 concluded that the bone anchored maxillary
protraction protocol induced an average increment on skeletal and soft-tissue
advancement of maxillary structures of about 4 mm, and favorable mandibular
changes exceeded 2 mm. The treated sample consisted of 21 Class III patients
consecutively treated with the BAMP protocol before the pubertal growth spurt (mean
21 treated group was compared with a matched control group of 18 untreated Class III
subjects. Significant differences between the treated and control groups were assessed
with independent-sample ttests . Sagittal measurements of the maxilla showed highly
significant improvements during active treatment (about 4 mm more than the
untreated controls), with significant protraction effects at orbitale and
pterygomaxillare. Significant improvements of overjet and molar relationship were
recorded, as well as in the mandibular skeletal measures at Point B and pogonion.
Vertical skeletal changes and modifications in incisor inclination were negligible,
except for a significant proclination of the mandibular incisors in the treated group.
Significant soft-tissue changes reflected the underlying skeletal modifications.
Abuhussein et al (2010)39 examined these factors such as thread pitch, thread
geometry, helix angle, thread depth and width as well as implant crestal module may
affect implant stability.A literature search was conducted using MEDLINE to identify
studies, from simulated laboratory models, animal, to human, related to this topic
using the keywords of implant thread, implant macrodesign, thread pitch, thread
geometry, helix angle, thread depth, thread width and implant crestal module.The
results showed how thread geometry affects the distribution of stress forces around
the implant. They concluded that decreased thread pitch may positively influence
implant stability.
Tung Nguyen et al(2011)40 concluded that bone-anchored maxillary protraction treatment approach produced significant orthopedic changes in the maxilla
and the zygomas in growing Class III patients. Bone-anchored maxillary protraction
22 malocclusions. evaluate 3-dimensional changes in the maxilla, the surrounding hard
and soft tissues, and the circummaxillary sutures after bone-anchored maxillary
protraction treatment. Twenty-five consecutive skeletal Class III patients between the
ages of 9 and 13 years (mean, 11.10 ± 1.1 years) were treated with Class III
intermaxillary elastics and bilateral miniplates (2 in the infrazygomatic crests of the
maxilla and 2 in the anterior mandible). Cone-beam computed tomographs were taken
before initial loading and 1 year out. Three-dimensional models were generated from
the tomographs, registered on the anterior cranial base, superimposed, and analyzed
by using color maps. The maxilla showed a mean forward displacement of 3.7 mm,
and the zygomas and the maxillary incisors came forward 3.7 and 4.3 mm,
respectively.
Handa et al (2011)41evaluated the impact of thread pitch of orthodontic mini-implant on the maximum effective stress in the surrounding jaw bone, using the three
dimensional finite element method. Three Finite Element models were designed with
mini-implants with thread pitches of 0.5mm, 1.0mm & 1.5mm, each being inserted at
30 degrees mesial to mandibular molar at a distance of 1.0 mm. Traction force of 2N
was applied to the head of the mini implant at 45 degrees to the horizontal plane and
overall Von Mises’ stresses and the maximum effective stresses in the cortical bone
surrounding implant were determined. Mini-implants having the thread pitch of 0.5
mm showed least amount of stresses within the bone as compared to the implants with
thread pitch of 1.0 and 1.5mm. The pattern of stress distribution was maximally
concentrated at the point of entry of the mini-implant into the bone i.e. concentrated
23 concluded that stresses in the bone increase as the thread pitch of the orthodontic
mini-implant increases.
Baccetti et al( 2011)42 evaluate the effects of bone-anchored maxillary protraction (BAMP) in the treatment of growing patients with Class III malocclusion.
The shape and size changes in the craniofacial configuration of a sample of 26
children with Class III malocclusions consecutively treated with the BAMP protocol
were compared with a matched sample of 15 children with untreated Class III
malocclusions. All subjects in the two groups were at a prepubertal stage of skeletal
development at time of first observation. Average duration of treatment was 14
months. Significant treatment-induced modifications involved both the maxilla and
the mandible. The most evident deformation consisted of marked forward
displacement of the maxillary complex with more moderate favourable effects in the
mandible. Deformations in the vertical dimension were not detected. The significant
deformations were associated with significant differences in size in the group treated
with the BAMP protocol.
Seung-HakBaek et al(2011)43 presents the treatment of growing class III
patients with the use of the facemask in conjunction with the miniplate (FM/MP),and
also the treatment of postadolescent class III patients camouflaged by the use of
miniimplants as skeletal anchorage. For FM/MP therapy, an orthopaedic force of
more than 500 g per side with a vector of 30 0 downward and forward from the
occlusal plane was applied 12-14 hours per day after placement of the curvilinear type
surgical miniplates in the zygomatic buttress areas of the maxilla. After 16 months of
24 found. side effects of maxillary protraction such as labial tipping of the upper incisors,
extrusion of the upper molars, clockwise rotations of the mandibular plane and bite
opening which are usually observed using tooth borne anchorage were minimized.
Therefore, FM/MP can be effective alternative treatment modality for maxillary
hypoplasia with minimal unwanted side effects.Class III patients in the postadoloscent
period can be camouflaged with fixed appliances by the use of miniimplants as
skeletal anchorage. The authors prefer to install the mini implants in the buccal
attached gingival between the upper second premolar and the first molar. Class I
intrarach elastics can be used to decompensate the already labially inclined upper
incisors. Class III interarch elastics can be used for distal en masse movement of the
lower dentition. Vertical elastics can be used to correct an open bite problem if
present. Extrusion or intrusion of the lower molars can be controlled with strategic
positioning of the mini implants in the lower arch. The careful use of miniplates and
mini implants can expand the boundaries and scope of conventional fixed appliance
therapy.
Trandem et al (2011)44 did an investigation to found out that if miniplates
could withstand orthopedic forces, when the forces were applied to a miniplate
without a perpetual misshapening of the lever arm. Miniplates from Synthes
(Kalamazoo, Mich), KLS Martin (Tuttlingen, Germany), and Stryker (West Chester,
Pa) brands were taken as thirty-six miniplates, twelve from each brand were tested.
The means of yield load, maximum stress at proportional limit, and elastic modulus
for each brand were compared. Beam twisting test was utilized to decide the yield
stress that samples had more noteworthy yield strength, ranged from 1280 to 3000
25 KLS Martin tests were bring down at 2364 GPa, and the Synthes tests were 43 6 GPa.
In view of the testing, three industrially brands of miniplates could withstand
orthopedic forces KLS Martin and Synthes showed higher yield loads that were
altogether unique in relation to that of Stryker.
Lu et al (2011)45 investigated the mechanical strength of miniplates placed in artificial bone. In this study, 10 sets of orthopedic miniscrews and miniplates
(Leibinger, Muhlheim-Stetten, Germany) were determined.(Sawbones, Pacific
Research Laboratories, Vashon, WA, USA). Each miniscrews and miniplates
orthopedic set was made out of one miniplate and two miniscrews (every 7 mm long).
40 pounds for each cubic foot (pcf), g/cm3 of a cell unbending polyurethane sheet
(cortical bone; 2 mm thick) was joined to a 20-pcf square (cancellous bone, 250 mm
thick) with an acrylate attach to mimic the jawbone. All miniscrews were physically
embedded into the issue that was separated with a distance of 7 mm and insertion
torque was estimated by an advanced torque transducer (Lutron, Taipei,
Taiwan.Pull-out tests were done with a material testing machine (Lloyd, Berwyn, PA, USA).
Results demonstrated that the two groups had comparative addition torques for each
miniscrew.. Contrasting the pull out strengths, that in the horizontal direction was
significantly greater than that in the vertical direction. As indicated by the outcomes
showed in the study miniplates can provide retention forces more noteworthy than
conventional orthopedic and orthodontic forces in the vertical and horizontal
direction.
26 related with intermaxillary mechanics. The early finding and treatment of skeletal
Class III is as yet a much talked about theme in orthodontic writing. Maxillary
protraction related with rapid maxillary expansion is the most prominent approach,
creating the best outcomes in the briefest time of time. The test comprised of 10
patients with Pattern III, whose mean age was 8 years and 2 months toward the start
of treatment, continuously treated with a modified Haas expander, modified lingual
arch, intermaxillary elastics and Petit facemask for maxillary protraction during a
9-month duration. Four lateral cephalograms were taken of every patient, one toward
the start of treatment and the other three at general 3-month interims (T1, T2, T3 and
T4). Cephalometric estimations at every one of the four times were looked at utilizing
ANOVA difference for repeated measures and supplemented by Tukey's test.It was
found that the most noteworthy skeletal changes happened in the initial 3 months of
treatment. After that period the progressions stayed steady until the finish of
treatment. There were couple of dental compensations and the vertical changes which
happened demonstrated decreased clinical significance.The treatment utilized as a part
of this examination achieved the overjet correction as well as improvements in the
sagittal relationship of the basal bones and in soft tissue esthetics.
Eline De Clerk et al (2011)47 assessed the achievement rate of Bollard
miniplate anchorage for bone anchored maxillary protraction (BAMP).Twenty-five
patients (mean age, 12.0 ± 1.2 years; go, 8.7– 14.8 years) with maxillary hypoplasia
without congenital and acquired anomalies were incorporated into this investigation.
A sum of 100 Bollard miniplates were put by a similar specialist. Ninety-nine
miniplates were embedded under general anesthesia, and one was put under local
27 (extend, 11– 38 days) after surgery. Mean follow-up was given at 20.8 ± 11.1 months
(extend, 6.5– 46.2 months).The general achievement rate of miniplate anchorage far
as stability was 97%. During orthodontic loading, five miniplates showed
mobility.Skeletal anchorage by Bollard modified miniplates is powerful for BAMP.
Achievement relies upon legitimate presurgical patient guiding, minimal invasive
surgery, great postsurgical guidelines, and orthodontic followup.
Cagla Sar et al (2011)49 assessed the skeletal, dentoalveolar, and soft tissue impacts of maxillary protraction with miniplates contrasted and ordinary facemask
treatment and an untreated Class III control group. Forty-five subjects who were in
prepubertal or pubertal skeletal development periods were incorporated into the
investigation and separated into 3 groups of 15 patients each. All subjects had skeletal
and dental Class III malocclusions with maxillary inadequacy, vertically normal
growth pattern,anterior crossbite,angle Class III molar relationship, normal and
increased overbite, and retrusive nasomaxillary complex. Before maxillary
protraction,rapid maxillary expansion with bonded appliance was performed in both
treatment groups. In the primary group (MP+FM), comprising of 5 young ladies and
10 young men (mean age, 10.91 years), facemasks were connected from 2 titanium
miniplates carefully set horizontally to the apertura piriformis areas of the maxilla.
The second group(FM) of 7 young ladies and 8 young men (mean age, 10.31 years)
got maxillary protraction treatment with regular facemasks connected from hooks of
maxillary expansion appliance. The third group of 8 young ladies and 7 young men
(mean age, 10.05 years) was the untreated control group. cephalometric films were
taken toward the start and end of treatment or perception in all groups and dissected
28 Wilcoxon and Kruskal-Wallis tests.Treatment periods were 6.78 and 9.45 months in
the MP+FM and FM groups, individually, and the perception time frame in the
control group was 7.59 months. The differences were critical between the 3 groups
and the MP+FM and FM groups. The maxilla pushed ahead for 2.3 mm in the
MP+FM group and 1.83 mm in the FM assemble with maxillary protraction. The
distinction was noteworthy between 2 groups. The protraction rates were 0.45 mm for
every month in the MP+FM gathering and 0.24 mm for each month in the FM
gathering. The maxilla demonstrated anterior rotation after facemask treatment in the
FM group; there was no huge difference in the MP+FM group. Posterior rotation of
the mandible and increased facial height were more apparent in the FM group
compared with the MP+FM gathering.Both the maxilla and the mandible pushed
ahead altogether in the control group. Protrusion and mesialization of the maxillary
teeth in the FM bunch were disposed of in the MP+FM gathering. The
maxillomandibular relationships and the soft tissue profile were enhanced surprisingly
in both treatment groupsThe undesired impacts of traditional facemask treatment were
lessened or disposed of with miniplate anchorage, and proficient maxillary protraction
was accomplished in a shorter treatment period.
Chang et al (2012)49 concluded that modification of the mini-implant design
can substantially affect the mechanical properties. The finite element method is an
effective tool to identify optimal design parameters and allow for improved
miniimplant designs. Finite element analyses were conducted first for identification of
optimal design parameters. Four types of mini-implants with different design
parameters were then custom manufactured and tested mechanically. All mechanical
29 variability associated with bone. Finite element results showed that, for mini-implants
with a fixed external diameter of 2 mm, a thread length of 9.82 mm, and a pitch of
0.75 mm, those with greater thread depths, smaller taper degrees, and shorter taper
lengths generated higher maximum stresses on the bone and thread elements. These
mini-implants also had larger relative displacements. Maximum pullout resistance
was attained with a core/external diameter ratio of 0.68. All mechanical results were
compatible with the findings in the finite element analyses.
Ramzi duaibis et al (2012)50 assessed different sorts of stress in cortical bone
around miniscrew implants utilizing finite element analysis . Twenty-six
three-dimensional congregations of miniscrew models set in alveolar bone squares were
developed utilizing Abaqus (Dassault Syste`mes Simulia Corp, Provision, RI), a finite
element software.The model factors included implant design factors and bone-related
variables. All miniscrews were loaded by 2 N. Von Mises stress in cortical bone were
compared between the models for each factor. The outcomes shown that a few
elements influenced the stress in bone (implant diameter, implant head length, thread
size, thread pitch and modulus of cancellous bone). Miniscrew implant diameter,
head length, and thread size as well as the elastic modulus of cancellous bone affect
the stresses in cortical bone layer surrounding the miniscrew implant and may
therefore affect its stability.
Giuseppe Coscia et al(2012)51 reasoned that the treatment of maxillary insufficiency with orthopedic force from skeletal anchorage coordinated to the hooks
of an altered lower acrylic resin plate bonded on the mandibular tooth surfaces, is by
30 with a protraction facemask can deliver forward development of the maxilla however
with posterior rotation of the mandible and dentoalveolar compensations. A sum of 6
patients with skeletal Class III malocclusion were treated with intermaxillary elastics .
This traction was connected between the modified miniplates set in the maxilla and
an altered lower acrylic resin plate bonded on mandibular tooth surfaces. To assess
the orthodontic changes, lateral cephalograms were taken toward the beginning of the
treatment (T1), toward the finish of the orthopedic treatment (T2) and at the follow up
(T3). All patients demonstrated orthopedic adjustment of the skeletal Class III
association with decrease of facial concavity. No dentoalveolar remunerations or
changes in mandibular position were watched.
Jasmine et al (2012)52 assessed the distribution of stress in bone and
microimplant quickly in loading with various addition angulations of the miniimplants
using finite element analysis. They inferred that the correlation of the most extreme
von Mises stress in the miniimplant demonstrated that, as the insertion angle
expanded from 30° to 90°, stress diminished. The examination of the greatest von
Mises stress in the cortical bone demonstrated that, as the insertion angle expanded
from 30° to 90°, stress diminished. The examination of the most extreme von Mises
stress in the cancellous bone demonstrated that, as the insertion angle expanded from
30° to 90°, little stress was transmitted to the cancellous bone. Miniimplants ought to
be put as perpendicular deep down as feasible for better soundness.
Nalbantgil et al (2012)53 with the finite element analysis analyzed and compared the