Northeast sector of the Greenland Ice Sheet to undergo
the greatest inland expansion of supraglacial
lakes during the 21st century
Ádám Ignéczi1, Andrew J. Sole1, Stephen J. Livingstone1, Amber A. Leeson2, Xavier Fettweis3, Nick Selmes4, Noel Gourmelen5, and Kate Briggs6
1
Department of Geography, University of Sheffield, Sheffield, UK,2Lancaster Environment Centre/Data Science Institute, Lancaster University, Lancaster, UK,3Department of Geography, University of Liège, Liège, Belgium,4Plymouth Marine
Laboratory, Plymouth, UK,5School of Geosciences, University of Edinburgh, Edinburgh, UK,6School of Earth and Environment, University of Leeds, Leeds, UK
Abstract
The formation and rapid drainage of supraglacial lakes (SGL) influences the mass balance and dynamics of the Greenland Ice Sheet (GrIS). Although SGLs are expected to spread inland during the 21st century due to atmospheric warming, less is known about their future spatial distribution and volume. We use GrIS surface elevation model and regional climate model outputs to show that at the end of the 21st century (2070–2099) approximately 9.8 ± 3.9 km3(+113% compared to 1980-2009) and 12.6 ± 5 km3(+174%) of meltwater could be stored in SGLs under moderate and high representative concentration pathways (RCP 4.5 and 8.5), respectively. The largest increase is expected in the northeastern sector of the GrIS (191% in RCP 4.5 and 320% in RCP 8.5), whereas in west Greenland, where the most SGLs are currently observed, the future increase will be relatively moderate (55% in RCP 4.5 and 68% in RCP 8.5).1. Introduction
Supraglacial lakes (SGL) are formed by accumulation of meltwater in surface depressions on a glacier or ice sheet above impermeable snow/ice layers. They predominantly occur on the Greenland Ice Sheet (GrIS) below the Equilibrium Line Altitude (ELA) [Echelmeyer et al., 1991;Selmes et al., 2011;Howat et al., 2013;
Doyle et al., 2014;Leeson et al., 2015]. During a melt season SGLs are formed at progressively higher elevations around the margins of the GrIS and may refreeze (particularly at higher altitudes) or drain over the surface or to the bed of the ice sheet [McMillan et al., 2007; Sundal et al., 2009; Lampkin, 2011; Liang et al., 2012;
Johansson et al., 2013;Morriss et al., 2013;Selmes et al., 2013;Fitzpatrick et al., 2014]. SGLs tend to form in the same positions from year to year, rather than migrating with theflow of ice [Echelmeyer et al., 1991;
Lampkin, 2011; Selmes et al., 2011], indicating that their locations are controlled by the transfer of bed undulations to the surface of the ice sheet [Whillans and Johnsen, 1983;Gudmundsson, 2003;Lampkin and Vanderberg, 2011;Sergienko, 2013].
SGLs influence ice sheet mass balance and dynamics in several ways. Their presence reduces the albedo of the ice sheet thus increasing surface melt [Greuell et al., 2002;Lüthje et al., 2006;Tedesco et al., 2012]. The rapid (<24 h) drainage of SGLs to the bed through hydrofracture [van der Veen, 2007;Das et al., 2008;Krawczynski et al., 2009;Selmes et al., 2011] locally increases the water pressure in the subglacial hydrological system, which reduces the basal friction and causes transient ice-flow speedups [Zwally et al., 2002; Das et al., 2008;Shepherd et al., 2009;Bartholomew et al., 2010;Sole et al., 2011;Joughin et al., 2013]. However, the evo-lution of an efficient subglacial drainage system, which is able to drain water from regions of the ice sheet bed with high basal water pressure, has been shown to cause a net slowdown on annual and decadal time scales in west Greenland within 100 km of the land terminating ice sheet margin [Schoof, 2010;Sole et al., 2013;Tedstone et al., 2015]. Thus, the net ice sheet wide effect of SGL drainage on ice sheet dynamics is still an open research question. Besides the direct effects on iceflow, the formation of surface-to-bed connections and an efficient subglacial drainage system could (1) enable the rapid transfer of surface meltwater to the ice sheet margin, thereby reducing the retention and refreezing of meltwater on the surface [Willis et al., 2015;
Smith et al., 2015]; (2) transfer heat into the ice sheet reducing ice viscosity and promoting faster iceflow [Phillips et al., 2010;Doyle et al., 2014]; and (3) affect the magnitude and timing of freshwater and nutrient delivery to the oceans [Irvine-Fynn et al., 2011;Hawkings et al., 2015].
Geophysical Research Letters
RESEARCH LETTER
10.1002/2016GL070338Key Points:
•We present a comprehensive new data set of potential supraglacial lake locations on the Greenland Ice Sheet
•Supraglacial lakes are predicted to become more prevalent on the ice sheet during the 21st century with an increase in volume of 113–174%
•According to our results, by the end of the 21st century, the majority of supraglacial lakes will be found in northeastern Greenland
Supporting Information:
•Supporting Information S1
Correspondence to:
Á. Ignéczi,
aigneczi1@sheffield.ac.uk
Citation:
Ignéczi, Á., A. J. Sole, S. J. Livingstone, A. A. Leeson, X. Fettweis, N. Selmes, N. Gourmelen, and K. Briggs (2016), Northeast sector of the Greenland Ice Sheet to undergo the greatest inland expansion of supraglacial lakes during the 21st century,Geophys. Res. Lett.,43, 9729–9738, doi:10.1002/2016GL070338.
Received 6 JUL 2016 Accepted 29 AUG 2016
Accepted article online 31 AUG 2016 Published online 23 SEP 2016
©2016. The Authors.
Although SGLs are known to be widespread across the GrIS and have expanded inland during the last two decades [Sundal et al., 2009;Selmes et al., 2011, 2013;Howat et al., 2013], onlyLeeson et al. [2015] have mod-eled their future distribution.Leeson et al. [2015] focused on a ~ 20,000 km2area in southwest Greenland and, using an SGL initiation and growth model [Leeson et al., 2012] forced by moderate and high climate change scenarios, found that lakes form at higher elevations as temperature increases during the 21st century. Using an empirically based extrapolation of these results to the whole ice sheet, they suggested a 48–53% increase in the total area over which SGLs are distributed by 2060 [Leeson et al., 2015]. Here we expand upon these
findings and present a physically based inventory of contemporary and future SGLs across the entire ice sheet. First, we present an ice sheet wide data set of closed surface depressions, which are potential sites for SGL formation, and compare this with contemporary SGL surveys [Selmes et al., 2011;Leeson et al., 2013] considering modeled surface mass balance (SMB) [Fettweis et al., 2013] and SGL volume estimations. Then using the surface depression inventory and regional climate model outputs [Fettweis et al., 2013], we study the changing distribution of SGLs during the 21st century.
2. Data and Methods
2.1. Surface Depression Survey
To estimate the large-scale future distribution of SGLs, we consider every closed surface depression as a poten-tial SGL. This assumes that the location of depressions is controlled by bed topography [Lampkin, 2011;
Sergienko, 2013] and is therefore unlikely to change much during the next century. Closed depressions were surveyed byfilling the sinks in the Greenland Ice Mapping Project (GIMP) digital elevation model (DEM), posted at 30 m resolution [Howat et al., 2014]. The data werefiltered to remove false depressions caused by noise in the DEM and depressions that are unlikely to host SGLs. Small (≤0.125 km2) [Yang et al., 2015], very shallow (mean depth≤1.5 m), very deep (mean depth≥50 m) depressions and depressions located on thin (≤10 m) and ungrounded ice according to BedMachine v.2 data [Morlighem et al., 2014] were removed accordingly. To test the reliability of the GIMP-DEM derived surface depression data set, it was compared against two independent DEMs (see supporting information) [Hawley et al., 2009;Christie et al., 2016]. Depressions were also grouped into the eight main catchments of the GrIS as delineated by the Goddard Ice Altimetry Group [Zwally et al., 2012].
2.2. Comparison of Observed SGLs and Surface Depressions
To test the reliability of our surface depression inventory as an SGL proxy, it was compared with contempor-ary ice sheet wide SGL surveys derived from satellite imagery. These were provided bySelmes et al. [2011] and
Leeson et al. [2013] for the period of 2003–2009. The spatial coincidence between depressions and SGLs was assessed and expressed as recall (percentage of SGLs with matching depressions) and precision (percentage of depressions hosting SGLs) values [Livingstone et al., 2013] for each catchment above and below the current ELA. Most depressions are notfilled to the lip with water [e.g.,McMillan et al., 2007;Leeson et al., 2012] due to surface meltwater processes. To account for this, we compared the volume of depressions with the volume of coinciding observed SGLs. A radiative transfer model (equation (1)) [Sneed and Hamilton, 2007] was used to calculate water depths for the pixels of Moderate Resolution Imaging Spectroradiometer (MODIS) band 1 (620–670 nm) images from 2003, 2005, 2006, and 2007 in northern, northeastern, and southwestern Greenland using a similar method to that employed byLangley et al. [2016]. MODIS Level-1B Calibrated Radiances (MOD02) data were processed using the technique ofGumley et al. [2007].
z¼lnðAdR∞Þ lnðRwR∞Þ
g (1)
In the radiative transfer model (equation (1))zis the water depth,Rwis the reflectance of the pixel of interest,
andR∞is the reflectance of optically deep water, estimated from the open sea visible on each image. The quantitygis best estimated as 2Kd[Maritorena et al., 1994], whereKdis the diffuse attenuation coefficient for downwelling light and found to be 0.30945 and 0.43045 for the wavelengths of 620 and 670 nm, respec-tively [Smith and Baker, 1981].Adis the lake substrate albedo estimated for each image based on the pixels
season, the maximal volume of each SGL in each melt season was recorded. The mean value of the 4 years was calculated for each SGL and compared with the volume of the coinciding depression.
2.3. Surface Mass Balance and SGL Projections
The majority of SGLs form below the ELA, and their inland expansion correlates well with the rising ELA [Howat et al., 2013]. Thus, in order to obtain robust estimations for the maximal total volume of SGLs on the GrIS, only surface depressions located below the ELA were assumed to host SGLs when projecting into the future or reconstructing the past. Past and future ELAs were obtained from modeled SMB, from 1980 to 2099. SMB was modeled at 25 km by the Modèle Atmosphérique Régional (MAR), which was forced by European Centre for Medium Range Weather Forecast Reanalysis (ERA-Interim) outputs, from 1980 to 2009 to produce a reference for current climate [Fettweis et al., 2013]. MAR was also forced, from 1980 to 2099, by the outputs of three general circulation models (GCMs): Canadian Earth System Model (CanESM2), Norwegian Climate Center's Earth System Model (NorESM1), and Model for Interdisciplinary Research on Climate (MIROC5). Mid- and high-range future greenhouse gas scenarios (representative concentration path-way (RCP) 4.5 and 8.5 respectively) were used to force the three GCMs from 2006 to 2099 [Fettweis et al., 2013]. Mean SMB data sets, per 5 year for the historical period of 1980–2009 and 10 year for the projected period of 2010–2099, were calculated from the model outputs. The average ELA of 2000–2009 was consid-ered as the current ELA in order to best match with the date of SGL observations and DEM surveys. To avoid using average ELAs for large areas, SMB was investigated at each depression and observed SGL to determine whether it fell above or below the ELA.
3. Results and Discussion
3.1. Comparison of Surface Depressions and Contemporary SGLs
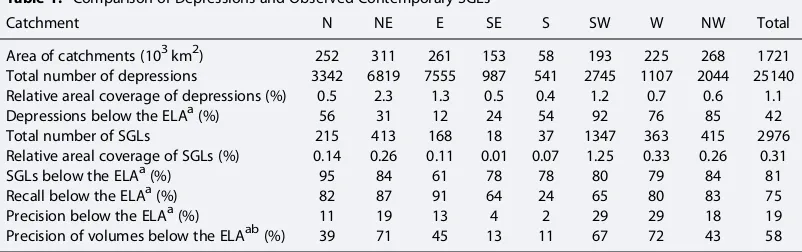
The majority (81%) of observed SGLs are located below the current ELA which agrees well with previous observations [e.g.,Echelmeyer et al., 1991;Howat et al., 2013]. A recall (percentage of SGLs which fall within a depression) of 75% indicates that surface depressions can be used to predict the sites of contemporary SGLs below the ELA accurately (Table 1). The performance of the GIMP-DEM was similar to the two indepen-dent DEMs (Text S1 in the supporting information). Catchment-specific values demonstrate that although the accuracy of our data set is not homogenous, it performs well in all catchments of the GrIS (Table 1). Combining the ratio of observed SGLs below the current ELA (81%) and the recall below the current ELA (75%), the potential underestimation rate of our SGL projection technique is estimated to be less than 40%.
[image:3.612.174.575.99.225.2]A precision (percentage of depressions hosting SGLs) of 19% indicates that even below the ELA a lot of depressions currently do not host SGLs (Table 1). Independent DEMs performed similarly in this case too (Text S1). Low precision is expected because a range of factors could hinder the formation of SGLs in depres-sions, e.g., the presence of crevasses, moulins, narrow surface channels draining the lakes, and/or inadequate meltwater supply. Surveys using satellite imagery could have also missed SGLs due to limited availability of imagery and the short lifetime of some SGLs [e.g.,Selmes et al., 2011; Leeson et al., 2013]. However,
Table 1. Comparison of Depressions and Observed Contemporary SGLs
Catchment N NE E SE S SW W NW Total
Area of catchments (103km2) 252 311 261 153 58 193 225 268 1721 Total number of depressions 3342 6819 7555 987 541 2745 1107 2044 25140 Relative areal coverage of depressions (%) 0.5 2.3 1.3 0.5 0.4 1.2 0.7 0.6 1.1
Depressions below the ELAa(%) 56 31 12 24 54 92 76 85 42
Total number of SGLs 215 413 168 18 37 1347 363 415 2976
Relative areal coverage of SGLs (%) 0.14 0.26 0.11 0.01 0.07 1.25 0.33 0.26 0.31
SGLs below the ELAa(%) 95 84 61 78 78 80 79 84 81
Recall below the ELAa(%) 82 87 91 64 24 65 80 83 75
Precision below the ELAa(%) 11 19 13 4 2 29 29 18 19
Precision of volumes below the ELAab(%) 39 71 45 13 11 67 72 43 58
aOnly GIMP-DEM-derived depressions and observed SGLs below the current ELA, derived from ERA-Interim forced
MAR over 2000–2009, were considered.
bThe percentage of the volume of GIMP-DEM-derived depressions hosting SGLs from the total depression volume of
depressions below the ELA where SGLs were not detected were significantly smaller than depressions where SGLs were present, the latter accounts for only 19% of the total number but 58% of the total volume of the depressions below the ELA (Table 1). Thus, the potential overestimation rate of our SGL projections due to the presence of depressions without SGLs is expected to be less than 40%.
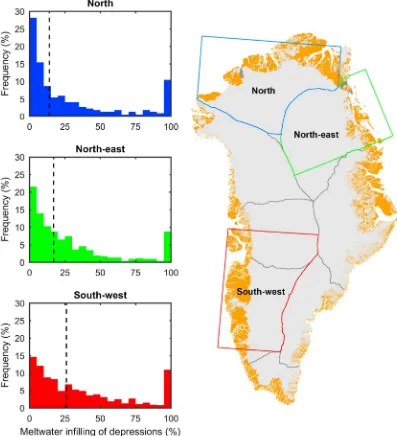
[image:4.612.175.572.92.528.2]median of 26% (Figure 1). The difference is likely to be caused by the longer melt season and higher amount of available meltwater in the south [Sundal et al., 2009;Fettweis et al., 2013]. The maximal volume of melt-water that could be contained in depressions assumed to host SGLs was calculated by considering a 20% meltwater infill proportion (the mean of the three medians) of each depression. Along with the conservative estimate of overall uncertainty, which is 40%, this provides a robust constraint on our estimations.
3.2. Distribution of Surface Depressions on the Greenland Ice Sheet
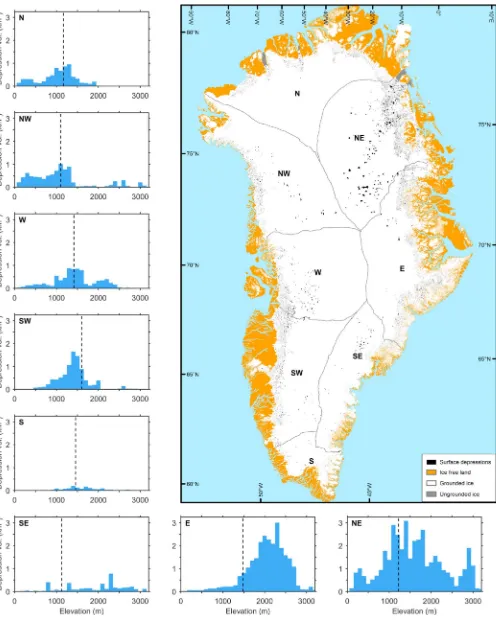
We have identified 25,140 closed surface depressions on the GrIS using the GIMP-DEM (Figure 2). The distri-bution of depressions is similar using independent DEMs (Text S1 and Figure S1). Most depressions occur close to the ice sheet margin: 73% are within 25 km and 90% are within 50 km, where thinner ice and rela-tively large basal slip ratios could enable the transfer of short wavelength bedrock undulations to the surface [Gudmundsson, 2003;Lampkin and Vanderberg, 2011;Sergienko, 2013]. The relatively steep ice surface, the presence of crevasses, shallower snowpack, andfirn, and higher effective resolution of the DEM [Howat et al., 2014] could also contribute to this. At high elevations, shallow surface depressions may have been missed due to infilling by snow and/or refrozen meltwater [Koenig et al., 2015]. However, there are certain regions where surface depressions clearly occur in the far interior of the ice sheet. The most striking example is on the Northeast Greenland Ice Stream (Figure 2), where the presence of thick ice and a high basal slip ratio caused by anomalously high geothermal heat flux [Fahnestock et al., 2001; Joughin et al., 2000, 2001;
Rogozhina et al., 2016;MacGregor et al., 2016] could facilitate the transfer of longer basal wavelengths to the surface, whilefiltering shorter wavelengths [Gudmundsson, 2003], causing a high concentration of large depressions. However, further investigations are needed on the spectral composition of basal undulations under the GrIS in order to confirm our assumptions.
The main catchments of the GrIS can be classified into three groups based on the distribution and spatial density of depressions. In the southern and southeastern catchments, there are very few closed depressions and their relative areal coverage is also low, 0.4% and 0.5%, respectively (Figure 2 and Table 1). This is in agreement with previous studies which reported very few SGLs in these regions due to the high surface slopes and the large mass balance gradient [Selmes et al., 2011;Howat et al., 2013]. In the northern, northeast-ern, and eastern catchments, there are significantly more depressions, the majority of them (44%, 69%, and 88% respectively) are above the current ELA (Figure 2 and Table 1). In the northwestern, western, and south-western catchments there are fewer depressions above the current ELA, 15%, 24%, and 8% respectively. This implies that the current SGL distribution is close to the topographical limit of depressions in this region. Thus, assuming that the relative change in ice thickness over most of the ice sheet will remain moderate during the next century, the future advance of SGLs could be limited in west Greenland. This is important because currently 71% of the observed SGLs in Greenland can be found in this region (Table 1).
3.3. SGL Projections
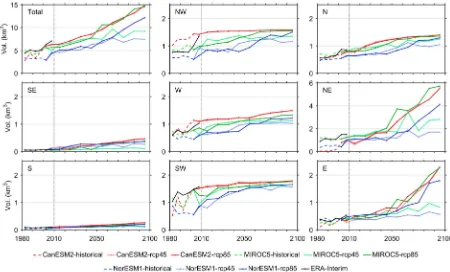
Total ice sheet, and catchment-specific, SGL volume reconstructions, and projections were obtained by sum-ming the volume of every GIMP-DEM-derived depression below the relevant ELA and assusum-ming that each depression becomes 20% full of meltwater (Figure 3). Our reconstructions, from 1980 to 2009, are in good agreement with earlier observations byHowat et al. [2013], who showed a strong increase in SGL coverage after 2000, especially in the southwestern, western, and northwestern catchments. This agreement gives us confidence in the ability of our method to capture ice sheet wide trends in future SGL coverage. The major-ity of the projections show an increase in SGL volume with time which is consistent with a warming climate (Figure 3). Taking the mean of the projection outputs the maximum volume of meltwater that could be con-tained in SGLs by the end of the 21st century (2070–2099) is estimated to be 9.8 ± 3.9 km3and 12.6 ± 5 km3 under moderate (RCP 4.5) and high (RCP 8.5) climate change scenarios, respectively. This is a 113% (RCP 4.5) and 174% (RCP 8.5) increase relative to 1980–2009 (4.6 ± 1.8 km3).
close to the upper limit of available depressions and therefore possible SGL formation. Thus, the relative increase in SGL volume will be modest during the 21st century, 55% (RCP 4.5) and 68% (RCP 8.5). However, the projected total volume of SGLs in this region, 4.2 ± 1.7 km3(RCP 4.5) and 4.5 ± 1.8 km3(RCP 8.5), will remain significant. In the northern, northeastern, and eastern catchments, both the rate of increase, 191% (RCP 4.5) and 320% (RCP 8.5), and the projected total volume of SGLs, 5.2 ± 2.1 km3 (RCP 4.5) and 7.5 ± 3 km3(RCP 8.5), are expected to be high (Figure 3). Thus, according to our analysis, the relative distribu-tion of SGLs on the GrIS will shift dramatically during the 21st century, with the northeastern sector of the ice sheet becoming increasingly important in terms of SGL formation and drainage. This could be further enhanced by large-scale climatic effects, such as the recent poleward shift of low albedo and high runoff on the GrIS [Tedesco et al., 2016].
[image:7.612.80.530.89.361.2]catchment [Chandler et al., 2013;Tedstone et al., 2015]. At high elevations in northeastern Greenland, where the greatest increase in SGL volume is predicted, faster subglacial channel closure may outweigh the evolution of efficient subglacial drainage [Doyle et al., 2014;Tedstone et al., 2015]. However, an increase in subglacial channel melting provided by more frequent rapid drainage of SGLs to the ice bed, due to the predicted expansion of SGLs and the presence of crevasses far inland [Fahnestock et al., 1993;Poinar et al., 2015;Stevens et al., 2015], could counteract faster creep closure.
4. Conclusions
Our results confirm thefindings ofLeeson et al. [2015] that SGLs will become more prevalent across the GrIS during the 21st century. However, by considering regional variations in ice surface topography and ELA, we predict significant changes in the large-scale spatial distribution of SGLs. Our results indicate that currently about 18% of the total SGL volume lies in the northeast and 23% in the southwest catchment. However, according to our results, this could change to 30–35% and 14–17%, respectively, by the end of the century. This highlights the heterogeneous nature of SGL evolution and cautions against extrapolating from studies based on the southwestern region of the ice sheet alone. In particular, we suggest that further work is needed to (1) fully understand the controls governing the spatial distribution of surface depressions and (2) establish whether future changes to SGL formation and growth in the northeast are likely to affect iceflow.
References
Banwell, F. A., M. Caballero, S. N. Arnold, F. N. Glasser, M. L. Cathles, and R. D. MacAyeal (2014), Supraglacial lakes on the Larsen B ice shelf, Antarctica, and at Paakitsoq, West Greenland: A comparative study,Ann. Glaciol.,55(66), 1–8.
Bartholomew, I., P. Nienow, D. Mair, A. Hubbard, M. King, and A. Sole (2010), Seasonal evolution of subglacial drainage and acceleration in a Greenland outlet glacier,Nat. Geosci.,3, 408–411.
Box, J. E., and K. Ski (2007), Remote sounding of Greenland supraglacial melt lakes: Implications for subglacial hydraulics,J. Glaciol.,53(181), 257–265.
Chandler, M. D., et al. (2013), Evolution of the subglacial drainage system beneath the Greenland Ice Sheet revealed by tracers,Nat. Geosci.,6, 195–198.
Christie, W. D. F., G. R. Bingham, N. Gourmelen, B. F. S. Tett, and A. Muto (2016), Four-decade record of pervasive grounding line retreat along the Bellingshausen margin of West Antarctica,Geophys. Res. Lett.,43, 5741–5749, doi:10.1002/2016GL068972.
Colgan, W., K. Steffen, S. W. McLamb, W. Abdalati, H. Rajaram, R. Motyka, T. Phillips, and R. Anderson (2011), An increase in crevasse extent, West Greenland: Hydrologic implications,Geophys. Res. Lett.,38, L18502, doi:10.1029/2011GL048491.
Das, S. B., I. Joughin, M. D. Benn, I. M. Howat, M. A. King, D. Lizarralde, and M. P. Bhatia (2008), Fracture propagation to the base of the Greenland Ice Sheet during supraglacial lake drainage,Science,320(5877), 963–964.
Doyle, S. H., A. Hubbard, A. A. W. Fitzpatrick, D. van As, A. B. Mikkelsen, R. Pettersson, and B. Hubbard (2014), Persistentflow acceleration within the interior of the Greenland Ice Sheet,Geophys. Res. Lett.,41, 899–905, doi:10.1002/2013GL058933.
Echelmeyer, K., T. S. Clarke, and W. D. Harrison (1991), Surficial glaciology of JakobshavnIsbrae, West Greenland: Part I. Surface-morphology,
J. Glaciol.,37(127), 368–382.
Fahnestock, M., R. Bindschadler, R. Kwok, and K. Jezek (1993), Greenland Ice Sheet surface properties and ice dynamics from ERS-1 SAR imagery,Science,262, 1530–1534.
Fahnestock, M., W. Abdalati, I. Joughin, J. Brozena, and P. Gogineni (2001), High geothermal heatflow, basal melt, and the origin of rapid ice
flow in central Greenland,Science,294, 2338–2342.
Fettweis, X., B. Franco, M. Tedesco, H. J. van Angelen, M. T. J. Lenaerts, R. M. van den Broeke, and H. Gellée (2013), Estimating the Greenland ice sheet surface mass balance contribution to future sea level rise using the regional atmospheric climate model MAR,Cryosphere,7, 469–489.
Fitzpatrick, A. A. W., A. L. Hubbard, J. E. Box, D. J. Quincey, D. Van As, A. P. B. Mikkelsen, S. H. Doyle, C. F. Dow, B. Hasholt, and G. A. Jones (2014), A decade (2002–2012) of supraglacial lake volume estimates across Russell Glacier, West Greenland,Cryosphere,8(1), 107–121. Greuell, W., C. H. Reijmer, and J. Oerlemans (2002), Narrowband-to-broadband albedo conversion for glacier ice and snow based on aircraft
and near-surface measurements,Remote Sens. Environ.,82, 48–63.
Gudmundsson, G. H. (2003), Transmission of basal variability to a glacier surface,J. Geophys. Res.,108(B5), 2253, doi:10.1029/2002JB002107. Gumley, L., J. Descloitres, and J. Schmaltz (2007), Creating reprojected MODIS True Color images: A Tutorial, 19 pp. [Available at ftp://ftp.ssec.
wisc.edu/pub/IMAPP/MODIS/TrueColor.]
Hawkings, R. J., et al. (2015), The effect of warming climate on nutrient and solute export from the Greenland Ice Sheet,Geochem. Perspect. Lett.,1, 94–104.
Hawley, R. L., A. Shepherd, R. Cullen, V. Helm, and D. J. Wingham (2009), Ice-sheet elevations from across-track processing of airborne interferometric radar altimetry,Geophys. Res. Lett., 36, L22501, doi:10.1029/2009GL040416.
Howat, I. M., S. de la Pena, J. H. van Angelen, J. T. M. Lenaerts, and M. R. Van der Broeke (2013), Brief communication“Expansion of meltwater lakes on the Greenland Ice Sheet”,Cryosphere,7(1), 201–204.
Howat, M. I., A. Negrete, and E. B. Smith (2014), The Greenland Ice Mapping Project (GIMP) land classification and surface elevation data sets,
Cryosphere,8, 1509–1518.
Irvine-Fynn, T. D. L., A. J. Hodson, B. J. Moorman, G. Vatne, and A. L. Hubbard (2011), Polythermal glacier hydrology: A review,Rev. Geophys.,
49, RG4002, doi:10.1029/2010RG000350.
Johansson, A. M., P. Jansson, and I. A. Brown (2013), Spatial and temporal variations in lakes on the Greenland Ice Sheet,J. Hydrol.,476, 314–320.
Joughin, I., M. Fahnestock, and J. Bamber (2000), Iceflow in the northeast Greenland ice stream,Ann. Glaciol.,31, 141–146.
Acknowledgments
Joughin, I., M. Fahnestock, D. MacAyeal, L. J. Bamber, and P. Gogineni (2001), Observation and analysis of iceflow in the largest Greenland ice stream,J. Geophys. Res.,106(24), 34,021–34,034, doi:10.1029/2001JD900087.
Joughin, I., E. B. Smith, E. D. Shean, and D. Floricioiu (2013), Brief communication: Further summer speedup of Jakobshavn Isbræ,Cryosphere,
8, 209–214.
Koenig, S. L., et al. (2015), Wintertime storage of water in buried supraglacial lakes across the Greenland Ice Sheet,Cryosphere,9, 1333–1342. Krawczynski, M. J., M. D. Behn, S. B. Das, and I. Joughin (2009), Constrains on the lake volume required for hydrofracture through ice sheets,
Geophys. Res. Lett.,36, L10501, doi:10.1029/2008GL036765.
Lampkin, J. D. (2011), Supraglacial lake spatial structure in western Greenland during the 2007 ablation season,J. Geophys. Res.,116, F04001, doi:10.1029/2010JF001725.
Lampkin, J. D., and J. Vanderberg (2011), A preliminary investigation of the influence of basal and surface topography on supraglacial lake distribution near JakobshavnIsbrae, western Greenland,Hydrol. Processes,25(21), 3347–3355.
Langley, S. E., A. A. Leeson, R. C. Stokes, and R. S. S. Jamieson (2016), Seasonal evolution of supraglacial lakes on an east Antarctic outlet glacier,Geophys. Res. Lett.,43, doi:10.1002/2016GL069511.
Leeson, A. A., A. Shepherd, S. Palmer, A. Sundal, and X. Fettweis (2012), Simulating the growth of supraglacial lakes at the western margin of the Greenland Ice Sheet,Cryosphere,6(5), 1077–1086.
Leeson, A. A., A. Shepherd, A. V. Sundal, A. M. Johansson, N. Selmes, K. Briggs, A. E. Hogg, and X. Fettweis (2013), A comparison of supraglacial lake observations derived from MODIS imagery at the western margin of the Greenland Ice Sheet,J. Glaciol.,59(218), 1179–1188. Leeson, A. A., A. Shepherd, K. Briggs, I. Howat, X. Fettweis, M. Morlighem, and E. Rignot (2015), Supraglacial lakes on the Greenland Ice Sheet
advance inland under warming climate,Nat. Clim. Change,5, 51–55.
Liang, Y.-L., W. Colgan, Q. Lv, K. Steffen, W. Abdalati, J. Stroeve, D. Gallaher, and N. Bayou (2012), A decadal investigation of supraglacial lakes in west Greenland using a fully automatic detection and tracking algorithm,Remote Sens. Environ.,123, 127–138.
Livingstone, J. S., D. C. Clark, J. Woodward, and J. Kingslake (2013), Potential subglacial drainage pathways beneath the Antarctic and Greenland Ice Sheets,Cryosphere,7, 1721–1740.
Lüthje, M., L. T. Pedersen, N. Reeh, and W. Greuell (2006), Modelling the evolution of supraglacial lakes on the west Greenland Ice Sheet margin,J. Glaciol.,52(179), 608–618.
MacGregor, A. J., et al. (2016), A synthesis of the basal thermal state of the Greenland Ice Sheet,J. Geophys. Res. Earth Surf.,121, 1328–1350, doi:10.1002/2015JF003803.
Maritorena, S. A., A. Morel, and B. Gentili (1994), Diffuse reflectance of oceanic shallow waters: Influence of water depth and bottom albedo,
Limnol. Oceanogr.,39(7), 1689–1703.
McMillan, M., P. Nienow, A. Shepherd, T. Benham, and A. Sole (2007), Seasonal evolution of supra-glacial lakes on the Greenland Ice Sheet,
Earth Planet. Sci. Lett.,262(3–4), 484–492.
Morlighem, M., E. Rignot, J. Mouginot, H. Seroussi, and E. Larour (2014), Deeply incised submarine glacial valleys beneath the Greenland Ice Sheet,Nat. Geosci.,7, 418–422.
Morriss, B. F., R. L. Hawley, J. W. Chipman, L. C. Andrews, G. A. Catania, M. J. Hoffman, M. P. Lüthi, and T. A. Neumann (2013), A ten-year record of supraglacial lake evolution and rapid drainage in west Greenland using an automated processing algorithm for multispectral imagery,
Cryosphere,7(6), 1869–1877.
Phillips, T., H. Rajaram, and K. Steffen (2010), Cryo-hydrologic warming: A potential mechanism for rapid thermal response of ice sheet,
Geophys. Res. Lett.,37, L20503, doi:10.1029/2010GL044397.
Poinar, K., I. Joughin, B. S. Das, D. M. Behn, M. T. J. Lenaerts, and R. M. van den Broeke (2015), Limits to future expansion of surface-melt-enhanced iceflow into the interior of western Greenland,Geophys. Res. Lett.,42, 1800–1807, doi:10.1002/2015GL063192.
Rogozhina, I., G. A. Petrunin, P. M. A. Vaughan, B. Steinberger, V. J. Johnson, K. M. Kaban, R. Calov, F. Rickers, M. Thomas, and I. Koulakov (2016), Melting at the base of the Greenland ice sheet explained by Iceland hotspot history,Nat. Geosci.,9, 366–369.
Schoof, C. (2010), Ice-sheet acceleration driven by melt supply variability,Nature,468, 803–806.
Selmes, N., T. Murray, and T. D. James (2011), Fast-draining lakes on the Greenland Ice Sheet,Geophys. Res. Lett.,38, L15501, doi:10.1029/ 2011GL047872.
Selmes, N., T. Murray, and T. D. James (2013), Characterizing supraglacial lake drainage and freezing on the Greenland Ice Sheet,Cryosphere Discuss.,7(1), 475–505.
Sergienko, O. V. (2013), Glaciological twins: Basally controlled subglacial and supraglacial lakes,J. Glaciol.,59(213), 3–8.
Shepherd, A., A. Hubbard, P. Nienow, M. King, M. McMillan, and I. Joughin (2009), Greenland Ice Sheet motion coupled with daily melting in late summer,Geophys. Res. Lett.,36, L01501, doi:10.1029/2008GL035758.
Smith, C. L., et al. (2015), Efficient meltwater drainage through supraglacial stream and rivers on the southwest Greenland ice sheet,
Proc. Natl. Acad. Sci. U.S.A.,112(4), 1001–1006.
Smith, C. R., and S. K. Baker (1981), Optical properties of the clearest natural waters (200–800 nm),Appl. Opt.,20(2), 177–184.
Sneed, A. W., and S. G. Hamilton (2007), Evolution of melt pond volume on the surface of the Greenland Ice Sheet,Geophys. Res. Lett.,34, L03501, doi:10.1029/2006GL028697.
Sole, A., P. Nienow, I. Bartholomew, D. Mair, T. Cowton, A. Tedstone, and A. M. King (2013), Winter motion mediates dynamic response of the Greenland Ice Sheet to warmer summers,Geophys. Res. Lett.,40, 3940–3944, doi:10.1002/grl.50764.
Sole, J. A., F. W. D. Mair, W. P. Nienow, D. I. Bartholomew, A. M. King, J. M. Burke, and I. Joughin (2011), Seasonal speedup of a Greenland marine terminating outlet glacier forced by surface melt-induced changes in subglacial hydrology,J. Geophys. Res.,116, F03014, doi:10.1029/2010JF001948.
Stevens, A. L., D. M. Behn, J. J. McGuire, B. S. Das, I. Joughin, T. Herring, E. D. Shean, and A. M. King (2015), Greenland supraglacial lake drainages triggered by hydrologically induced basal slip,Nature,522, 73–76.
Sundal, A. V., A. Shepherd, P. Nienow, E. Hanna, S. Palmer, and P. Huybrechts (2009), Evolution of supra-glacial lakes across the Greenland Ice Sheet,Remote Sens. Environ.,113(10), 2164–2171.
Tedesco, M., M. Lüthje, K. Steffen, N. Steiner, X. Fettweis, I. Willis, N. Bayou, and A. Banwell (2012), Measurement and modelling of ablation of the bottom of supraglacial lakes in western Greenland,Geophys. Res. Lett.,39, L02502, doi:10.1029/2011GL049882.
Tedesco, M., T. Mote, X. Fettweis, E. Hanna, J. Jeyaratnam, F. J. Booth, R. Datta, and K. Briggs (2016), Arctic cut-off high drives the poleward shift of new Greenland melting record,Nat. Commun.,7, 11723, doi:10.1038/ncomms11723.
Tedstone, J. A., W. P. Nienow, N. Gourmelen, A. Dehecq, D. Goldberg, and E. Hanna (2015), Decadal slowdown of a land-terminating sector of the Greenland Ice Sheet despite warming,Nature,526, 692–695.
van der Veen, C. J. (2007), Fracture propagation as means of rapidly transferring surface melt-water to the base of glaciers,Geophys. Res. Lett.,
Whillans, M. I., and J. S. Johnsen (1983), Longitudinal variations in glacialflow: Theory and test using data from the Byrd Station strain network, Antarctica,J. Glaciol.,29(101), 78–97.
Willis, J. M., G. B. Herried, G. M. Bevis, and E. R. Bell (2015), Recharge of a subglacial lake by surface meltwater in northeast Greenland,Nature,
518, 223–227.
Yang, K., C. L. Smith, W. V. Chu, J. C. Gleason, and M. Li (2015), A caution on the use of surface digital elevation models to simulate supraglacial hydrology of the Greenland Ice Sheet,IEEE J. Sel. Top. Appl. Earth Obs. Remote Sens.,8(11), 5212–5224.
Zwally, H. J., W. Abdalati, T. Herring, K. Larson, J. Saba, and K. Steffen (2002), Surface melt-induced acceleration of Greenland Ice-Sheetflow,
Science,297, 218–222.