Search for pair production of Higgs bosons in the
b
bb
¯
b
¯
final state using
proton-proton collisions at
p
ffiffi
s
= 13
TeV
with the ATLAS detector
M. Aaboudet al.* (ATLAS Collaboration)
(Received 16 June 2016; published 2 September 2016)
A search for Higgs-boson pair production in thebbb¯ b¯final state is carried out with3.2fb−1of proton-proton collision data collected atpffiffiffis¼13TeV with the ATLAS detector. The data are consistent with the estimated background and are used to set upper limits on the production cross section of Higgs-boson pairs times branching ratio to bbb¯ b¯ for both nonresonant and resonant production. In the case of resonant production of Kaluza-Klein gravitons within the Randall-Sundrum model, upper limits in the 24 to 91 fb range are obtained for masses between 600 and 3000 GeV, at the 95% confidence level. The production cross section times branching ratio for nonresonant Higgs-boson pairs is also constrained to be less than 1.22 pb, at the 95% confidence level.
DOI:10.1103/PhysRevD.94.052002
I. INTRODUCTION
The discovery of a Higgs boson (h) [1,2] at the Large Hadron Collider (LHC) provides an opportunity to search for physics beyond the Standard Model (SM) in channels involving couplings with the Higgs boson. In particular, the production cross section for Higgs-boson pairs in the SM is significantly smaller than predicted by a host of models, making this channel promising for a search for new phenomena. Examples of such models are the bulk Randall-Sundrum (RS) model [3,4] with a warped extra dimension and the two-Higgs-doublet model (2HDM)[5]. In the RS model, spin-2 Kaluza-Klein (KK) excitations of the graviton GKK are produced via gluon fusion with subsequent decay to thehh final state. Similarly, a heavy spin-0 scalar,H, in the 2HDM also gives rise to a resonant hh signature. Enhanced nonresonant hh production is expected in models with light colored scalars[6]or direct t¯thh vertices[7,8].
Previous searches for hh production have been per-formed by the ATLAS and CMS collaborations with pp collisions at pffiffiffis¼8TeV. The final states include bbb¯ b¯
[9,10],bb¯τþτ−[11,12],bb¯γγ [13,14], andγγWW[11]. A combination of these different channels has been performed by ATLAS [11], which shows that for resonance masses above 500 GeV the sensitivity is highest in the bbb¯ b¯ channel.
The dominant h→bb¯ decay mode is exploited in this paper to search for both resonant and nonresonant
production of Higgs-boson pairs inffiffiffi pp collisions at s
p
¼13TeV. Two analyses are presented. The“resolved” analysis is optimized forhhsystems that have sufficiently low mass to be resolved into four distinctb-jet signatures in the ATLAS detector. The “boosted” analysis focuses on higher-masshh systems that are characterized by higher-momentum Higgs bosons for which the twob-jets cannot be resolved due to the high boost. In this situation, large-radius jets are utilized to capture the by-products of each Higgs-boson decay and small-radius track jets are used to identify the presence of b-hadrons. The final results are obtained using the resolved analysis up to resonance masses of 1100 GeV, where its expected sensitivity is higher than that of the boosted analysis, whereas the boosted analysis is used for masses above 1100 GeV.
The two analyses generally follow the same approach as that adopted for the 8 TeV data (see Ref.[9]). The analysis of the 13 TeV data reported in this paper benefits from an enhanced sensitivity to high-mass resonances due to the significant increase in the production cross section in that kinematic region. Furthermore, the boosted analysis includes a channel with only threeb-tagged track jets, in addition to the channel with fourb-tagged track jets already included in the previous analysis. This new channel improves sensitivity for resonances with mass above 2000 GeV because the b-jet identification efficiency decreases sharply at high transverse momenta. The boosted analysis also operates with smaller track-jet radii to account for the larger boost at 13 TeV.
II. THE ATLAS DETECTOR
The ATLAS experiment[15]at the LHC is a multipur-pose particle detector with a forward-backward symmetric cylindrical geometry and a near 4π coverage in solid *Full author list given at the end of the article.
angle.1It consists of an inner tracking detector surrounded by a thin superconducting solenoid providing a 2 T axial magnetic field, electromagnetic and hadronic calorimeters, and a muon spectrometer. The inner tracking detector (ID) covers the pseudorapidity range jηj<2.5. It consists of silicon pixel, silicon microstrip, and transition radiation tracking (TRT) detectors. A new innermost pixel layer[16]
inserted at a mean radius of 3.3 cm is used for the first time in the 2015 data taking. Lead/liquid-argon (LAr) sampling calorimeters provide electromagnetic (EM) energy mea-surements. A steel/scintillator-tile hadronic calorimeter covers the central pseudorapidity range (jηj<1.7). The endcap and forward regions are instrumented with LAr calorimeters for both the EM and hadronic energy mea-surements up to jηj ¼4.9. The muon spectrometer (MS) surrounds the calorimeters and includes three large super-conducting air-core toroids. The field integral of the toroids ranges between 2.0 and 6.0 T m for most of the detector. The MS includes a system of fast detectors for triggering and precision tracking chambers. A dedicated trigger system is used to select events. The first-level trigger is implemented in hardware and uses the calorimeter and muon detectors to reduce the accepted rate to 100 kHz. This is followed by a software-based high-level trigger (HLT) that reduces the accepted event rate to 1 kHz on average.
III. DATA AND SIMULATION SAMPLES
The data sample used in this analysis was collected
during the 2015 LHC run withffiffiffi pp collisions at
s p
¼13TeV. After requiring that the data be collected during stable beam conditions and that relevant detector systems be functional, the total integrated luminosity is estimated to be3.2fb−1with an uncertainty of 5.0% derived following the methodology detailed in Ref. [17]. In the resolved analysis, events are selected by a combination of three triggers requiring either one or two jets selected by a dedicated HLT b-tagging algorithm [18]. These triggers require either one b-tagged jet with transverse momentum pT>225GeV, twob-tagged jets withpT>55GeV and
an additional jet with pT>100GeV, or four jets with
pT>35GeV, two of which are b-tagged. A trigger
requiring a single jet of radius 1.0 and pT>360 GeV is used to select events in the boosted analysis. The pT thresholds for these single- or multiple-jet triggers are lower at the first level of the trigger system. The combination of all
the above triggers has an efficiency rising from 95% to 99% for selectingbbb¯ b¯ signal events passing the full analysis selection as the resonance mass increases.
Simulated Monte Carlo (MC) event samples are used to model signal production and the background from t¯tand Zþjets events. A method based on data is used to model the dominant multijet backgound. Signal GKK events are generated at leading order (LO) with MG5_AMC@NLO
v2.2.2 [19] using the NNPDF2.3 LO parton distribution function (PDF) set[20], and PYTHIA8.186 [21]to model
the parton shower and hadronization process using the A14 set of tuned underlying-event parameters[22]. The Higgs-boson mass is set to 125.0 GeV. Values of the signal cross section times branching ratio forGKK→hh→bbb¯ b¯ with the coupling constantk=M¯Pl ¼1are 11.2 fb and 0.185 fb forGKKmasses of 1000 GeV and 2000 GeV, respectively. The parameterkcorresponds to the curvature of the warped extra dimension and the effective four-dimensional Planck scale M¯Pl¼2.4×10¹⁸ GeV. Signal samples are also generated with k=M¯Pl¼2 to study broader resonances.
Both the cross section and natural width depend on ðk=M¯PlÞ2. Generation of the heavyHscalar in a simplified
model with a fixed narrow widthΓH ¼1GeV is performed with MG5_AMC@NLO and the CT10 PDF set[23]. With thisΓHchoice, the width of the reconstructedhhresonance is dominated by the experimental resolution. For this model, parton showering and hadronization are handled by HERWIG++[24] with the CTEQ6L1 PDF set[25]and
the UEEE5 underlying-event tune [26]. The scalar inter-pretation for this search only makes use of the acceptance times efficiency from this model and no interpretation in terms of 2HDM parameters is presented. Nonresonant SM pp→hh→bbb¯ b¯ events are generated via the gluon-fusion process with MG5_AMC@NLO using form factors
for the top-quark loop from HPAIR [27,28]. The cross section times branching ratio to the bbb¯ b¯ final state, evaluated at next-to-next-to-leading order with the summa-tion of logarithms at next-to-next-leading-logarithm accu-racy, is 11.3þ−1.00.9fb [29]. The uncertainty includes the effects due to renormalization and factorization scales, PDF set, αS, effects of finite top-quark mass in loops, and theh→bb¯ branching ratio.
Generation oft¯tevents is performed with POWHEG-BOX
v1 using the CT10 PDF set. The parton shower, hadroni-zation, and the underlying event are simulated using PYTHIA 6.428 [30] with the CTEQ6L1 PDF set and the
corresponding Perugia 2012 tune[31]. The top-quark mass is set to 172.5 GeV. Higher-order corrections to t¯t cross sections are computed with Top++ 2.0[32]. These incor-porate NNLO corrections in QCD, including resummation of next-to-next-to-leading logarithmic soft gluon terms. The overall t¯t normalization is extracted from the data while the shape of kinematic distributions is taken from
1
ATLAS uses a right-handed coordinate system with its origin at the nominal interaction point (IP) in the center of the detector and the z axis along the beam pipe. The x axis points from the IP to the center of the LHC ring, and the y axis points upwards. Cylindrical coordinatesðr;ϕÞare used in the transverse plane, ϕ being the azimuthal angle around the z axis. The pseudorapidity is defined in terms of the polar angle θ as η¼−ln tanðθ=2Þ. Angular distance is measured in units of
MC simulation. The Zþjets sample is generated using PYTHIA8.186 with the NNPDF2.3 LO PDF set.
For all MC samples, charm-hadron and bottom-hadron decays are handled by EVTGEN1.2.0[33]. To simulate the
impact of multiple pp interactions that occur within the same or nearby bunch crossings (pileup), minimum-bias events generated with PYTHIA8 are overlaid on top of the hard scatter event. The detector response is simulated with GEANT 4 [34,35] and the events are processed with the
same reconstruction software as that used for the data.
IV. EVENT RECONSTRUCTION
The resolved and boosted analyses rely on the reconstruction of jets with the anti-kt clustering algorithm
[36] but with different values of the radius parameter R. Calorimeter jets withR¼0.4(1.0) are used to determine the kinematic properties of Higgs-boson candidates in the resolved (boosted) analysis. Those jets are reconstructed from topological clusters of energy deposits in calorimeter cells. TheR¼0.4jet energies are determined from recon-structed cluster energies at the electromagnetic scale with correction factors derived from simulation to account for the response of the calorimeter to hadrons[37]. Jets from pileup are suppressed with the use of tracking information as detailed in Ref.[38]. TheR¼1.0jets are built from locally calibrated clusters[37]and are trimmed[39]to minimize the impact of pileup. This trimming proceeds by reclustering the jet with thektalgorithm[40]into smallerR¼0.2subjets and removing those subjets withpsubjetT =pjetT <0.05, wherepsubjetT is the transverse momentum of the subjet andpjetT that of the original jet. In addition to the above large-Rtrimmed jets, the boosted analysis uses track jets with R¼0.2 to identify b-hadrons from Higgs-boson decays [41]. Such jets are reconstructed from charged-particle tracks with pT>
0.4GeV and jηj<2.5that satisfy a set of hit and impact parameter criteria to make sure that the tracks originate from the primary vertex, thereby minimizing the impact of pileup. Track jets are associated to large-Rjets using ghost associ-ation[42]. In this method, the large-Rjet algorithm is rerun with both the four-momenta of track jets modified to have infinitesimally small momentum (the “ghosts”) and all topological energy clusters in the event as potential con-stituents of jets. As a result, the presence of track jets does not alter the large-Rjets already found and their association to specific large-R jets is determined by the jet algorithm. Collision vertices are reconstructed requiring a minimum of two tracks withpT>0.4GeV in each vertex. The primary
vertex is chosen to be the vertex with the largestPp2T, where the sum extends over all tracks associated with the vertex.
The identification of jets containingb-hadrons is based on the R¼0.4 calorimeter (R¼0.2 track) jets in the resolved (boosted) analysis and a multivariate tagging algorithm[43]. This algorithm is applied to a set of tracks with loose impact parameter constraints in a region of
interest around each jet axis to enable the reconstruction of the b-hadron decay vertex. The b-tagging requirements result in an efficiency of 70% (77%) for jets containing b-hadrons in the resolved (boosted) analysis, as determined in a sample of simulated t¯t events. The corresponding efficiencies forc-hadron jets and light-quark or gluon jets are 12% (29%) and 0.2% (1.4%), respectively. Different b-tagging operating points are chosen in the two analyses to maximize their respective sensitivities.
Muons are reconstructed by combining tracks in the ID and MS, and are required to satisfy tight muon identification criteria [44]. The four-momentum of muons with pT> 4GeV andjηj<2.5, that are withinΔRof 0.4 (0.2) of jets used for b-tagging in the resolved (boosted) analysis, is added to the calorimeter jet four-momentum to partially account for the energy lost in semileptonicb-hadron decays.
V. EVENT SELECTION
The event selection for the resolved and boosted analyses is described below. These analyses are optimized
inde-pendently for the reconstruction and selection of
hh→bbb¯ b¯ final states, with the resolved analysis aiming at event topologies containing four distinctb-jets, whereas the boosted analysis focuses on topologies with higher-momentum Higgs bosons resulting in merged jets.
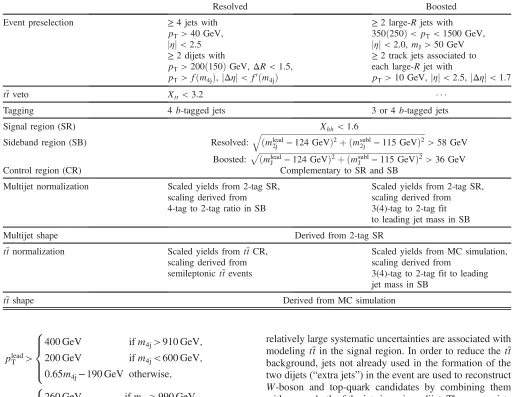
Different selection and background estimation strategies are adopted for the two analyses. To facilitate the com-parison between these different choices, Table I summa-rizes each of the requirements and approaches described in this section.
A. Resolved analysis
1. Selection
Events selected for the resolved analysis must contain at least fourb-tagged jets withjηj<2.5andpT>40GeV.
The four highest-pTb-tagged jets are used to form two dijet
systems, requiring an angular distanceΔRbetween the jets within the dijet system smaller than 1.5. The transverse momentum of the leading (subleading) dijet system is required to be greater than 200 (150) GeV. These require-ments are made to ensure a high trigger efficiency and to avoid ambiguities in forming dijets. In the rare case that a jet is assigned to more than one dijet system, only the combination containing the jets with the highest probability of being b-jets according to the multivariate b-tagging algorithm is considered.
The resolved analysis considers resonance masses in the range 400–1500 GeV. Event selection that varies as a function of the reconstructed resonance mass (m4j) is used to increase the analysis sensitivity across the mass range searched. Mass-dependent selection requirements are made on the leading dijet pT, the subleading dijet pT and the
plead T >
8 > > < > > :
400GeV ifm4j>910GeV;
200GeV ifm4j<600GeV;
0.65m4j−190GeV otherwise;
psubl T >
8 > > < > > :
260GeV ifm4j>990GeV;
150GeV ifm4j<520GeV;
0.23m4jþ30GeV otherwise;
jΔηdijetsj<
1.0 ifm
4j<820GeV;
1.6×10⁻³m4j−0.28 otherwise:
These selection requirements were optimized simulta-neously by performing a three-dimensional scan of thresh-old values, using the expected exclusion limit on theGKK resonance with k=M¯Pl ¼1as a metric.
After selecting two dijets that satisfy the mass-dependent criteria, 15% of the total background consists oft¯tevents. This t¯t background mainly comprises events where both top quarks decay hadronically. These hadronic decays often lead to three jets for each top quark—one b-jet directly from the top-quark decay and two from the decay of theW boson. Reduction of the t¯t background is important as
relatively large systematic uncertainties are associated with modelingt¯tin the signal region. In order to reduce the t¯t background, jets not already used in the formation of the two dijets (“extra jets”) in the event are used to reconstruct W-boson and top-quark candidates by combining them with one or both of the jets in a given dijet. These extra jets are required to havepT>30GeV, jηj<2.5, and ΔR <
1.5 relative to the dijet. TheW-boson candidate is recon-structed by adding the four-momentum of the extra jet to the four-momentum of the jet in the dijet system with the lowest probability of being a b-jet according to the multivariateb-tagging algorithm. The top-quark candidate is reconstructed by summing the dijet and the extra jet. The compatibility with the top-quark decay hypothesis is then determined using the variable
Xtt¼
ffiffiffiffiffiffiffiffiffiffiffiffiffiffiffiffiffiffiffiffiffiffiffiffiffiffiffiffiffiffiffiffiffiffiffiffiffiffiffiffiffiffiffiffiffiffiffiffiffiffiffiffiffiffiffiffiffiffiffiffiffiffiffiffiffiffiffiffiffiffiffiffiffiffiffiffiffiffiffiffiffiffiffi
mW−80.4GeV
0.1mW
2
þ
mt−172.5GeV
0.1mt
2 s
; ð1Þ
[image:4.612.49.563.102.499.2]wheremW andmtare the invariant masses of theW-boson and top-quark candidates. The values in the denominator approximate the dijet and three-jet system mass resolutions. If either dijet in an event has Xtt<3.2 for any possible TABLE I. Event selection requirements and definition of the different regions used in the resolved and boosted analyses. The methodologies used to estimate the background normalization and shape are also outlined. The variables are defined in the text. Dijet and large-Rjet minimumpTvalues are indicated for leading (subleading) such objects. The functionsfðm4jÞandf0ðm4jÞrepresent the mass dependence of the minimumpT and maximumjΔηjrequirements placed on the dijet candidates in the resolved analysis.
Resolved Boosted
Event preselection ≥4 jets with ≥2 large-Rjets with
pT>40GeV, 350ð250Þ< pT<1500GeV,
jηj<2.5 jηj<2.0,mJ>50GeV
≥2 dijets with ≥2 track jets associated to
pT>200ð150ÞGeV,ΔR <1.5, each large-R jet with
pT> fðm4jÞ,jΔηj< f0ðm4jÞ pT>10GeV,jηj<2.5,jΔηj<1.7
t¯tveto Xtt<3.2
Tagging 4b-tagged jets 3 or 4b-tagged jets
Signal region (SR) Xhh<1.6
Sideband region (SB) Resolved: ffiffiffiffiffiffiffiffiffiffiffiffiffiffiffiffiffiffiffiffiffiffiffiffiffiffiffiffiffiffiffiffiffiffiffiffiffiffiffiffiffiffiffiffiffiffiffiffiffiffiffiffiffiffiffiffiffiffiffiffiffiffiffiffiffiffiffiffiffiffiffiffiffiffiffiffiffiffiffiffiffiffiffiðmlead 2j −124GeVÞ2þ ðmsubl2j −115GeVÞ2 q
>58GeV Boosted: ffiffiffiffiffiffiffiffiffiffiffiffiffiffiffiffiffiffiffiffiffiffiffiffiffiffiffiffiffiffiffiffiffiffiffiffiffiffiffiffiffiffiffiffiffiffiffiffiffiffiffiffiffiffiffiffiffiffiffiffiffiffiffiffiffiffiffiffiffiffiffiffiffiffiffiffiffiffiffiffiffiffiffiðmlead
J −124GeVÞ2þ ðmsublJ −115 GeVÞ2
p
>36GeV
Control region (CR) Complementary to SR and SB
Multijet normalization Scaled yields from 2-tag SR, Scaled yields from 2-tag SR,
scaling derived from scaling derived from
4-tag to 2-tag ratio in SB 3(4)-tag to 2-tag fit to leading jet mass in SB
Multijet shape Derived from 2-tag SR
t¯tnormalization Scaled yields fromt¯tCR, Scaled yields from MC simulation,
scaling derived from scaling derived from
semileptonict¯tevents 3(4)-tag to 2-tag fit to leading jet mass in SB
combination with an extra jet, the event is rejected. This requirement, referred to as the “t¯t veto,” reduces the t¯t background by ∼60%, while retaining ∼90% of signal events. The event selection criteria described above are collectively referred to as the “4-tag” selection requirements.
Following the 4-tag selection, a requirement on the combination of the leading and subleading dijet masses (mlead
2j andmsubl2j , respectively) is used to define the signal
region. The signal region is defined using the variable
Xhh¼
ffiffiffiffiffiffiffiffiffiffiffiffiffiffiffiffiffiffiffiffiffiffiffiffiffiffiffiffiffiffiffiffiffiffiffiffiffiffiffiffiffiffiffiffiffiffiffiffiffiffiffiffiffiffiffiffiffiffiffiffiffiffiffiffiffiffiffiffiffiffiffiffiffiffiffiffiffiffiffiffiffiffiffiffiffiffiffiffiffi mlead
2j −124GeV
0.1mlead
2j
2
þ
msubl
2j −115GeV
0.1msubl
2j
2 s
;
ð2Þ
where the0.1m2jterms approximate the widths of the mass distributions. The center of the signal region was optimized using GKK samples with k=M¯Pl¼1. On average, the
subleading Higgs-boson candidate is reconstructed at lower masses as a result of energy lost from semileptonic b-hadron decays and final-state radiation. The signal region is defined asXhh<1.6. This corresponds to the kinematic requirements illustrated by the inner region in Fig.1. The data shown in this figure are derived from a sample of events that satisfy all selection criteria except for having only two jets that pass theb-tagging requirements, referred to as the “2-tag” sample.
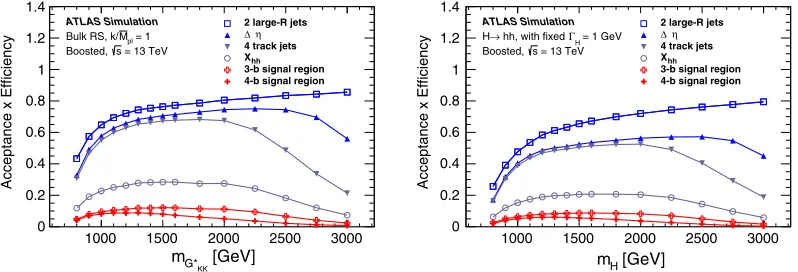
The acceptance times efficiency for each stage of the resolved-analysis event selection is shown in Fig. 2 for
spin-2 and spin-0 resonances. The acceptance times efficiency, A×ε, of the full selection for the GKK with k=M¯Pl ¼1ranges from 0.1% for aGKKof mass 400 GeV
to 5.3% for aGKKwith a mass of 1000 GeV. The spin of the resonance affects the angular distribution of the decay products, resulting in a lower acceptance in the case of a spin-0H boson than for the spin-2 GKK. As a result, the spin-0 resonance search is performed starting at a mass of 500 GeV. Nonresonant di-Higgs production occurs pri-marily at the low end of the m4j spectrum, leading to A×ε¼0.64%for the full selection.
The final step in the resonant analysis is to search for an excess in them4jdistribution for events in the signal region. The sensitivity of the search is increased by improving the m4jresolution in this region. This is achieved by scaling the
four-momentum of each of the Higgs-boson candidates such that their mass is equal to the Higgs-boson mass. This leads to an improvement of ∼30% in the signal m4j resolution with little impact on the background.
2. Background estimation
After the 4-tag selection described above,∼90%of the remaining background in the signal region originates from multijet events, which are modeled using data. The remain-ing ∼10% of the background is expected from t¯t events. Thet¯tyield is determined from data, while them4jshape is taken from MC simulation. TheZþjets contribution is less than 1% of the total background and is estimated from MC simulation. The background from all other sources— including processes featuring Higgs bosons—is negligible.
Multijet background .—The multijet background is mod-eled using an independent data sample selected using the same trigger and selection requirements as described above, except for theb-tagging requirement: only one of the two selected dijets is formed fromb-tagged jets, while the other dijet is formed from jets that both fail the b-tagging requirements. This “2-tag” selection yields a data sample that consists of 98% multijet events and 2%t¯tevents. The predicted signal contamination is negligible.
The 2-tag sample is normalized to the 4-tag sample and its kinematics corrected for differences introduced by the additional b-tagging requirement on the 4-tag sample. These kinematic differences arise because the b-tagging efficiency varies as a function of jetpTandη, the various
multijet processes contribute in different fractions, and the fraction of events passed by each trigger path changes. The normalization and kinematic corrections are determined using a signal-free sideband region of the mlead
2j −msubl2j
plane. The resulting background model is verified and the associated uncertainties are estimated using a
control region. The sideband and control regions
are shown in Fig.ffiffiffiffiffiffiffiffiffiffiffiffiffiffiffiffiffiffiffiffiffiffiffiffiffiffiffiffiffiffiffiffiffiffiffiffiffiffiffiffiffiffiffiffiffiffiffiffiffiffiffiffiffiffiffiffiffiffiffiffiffiffiffiffiffiffiffiffiffiffiffiffiffiffiffiffiffiffiffiffiffiffiffiffi1. The sideband region is defined as ðmlead
2j −124 GeVÞ2þ ðmsubl2j −115 GeVÞ2 q
>58GeV,
2
Events / 9 GeV
0 50 100 150 200 250 300
[GeV]
lead 2j
m
0 50 100 150 200 250 300
[GeV]
subl 2j
m
0 50 100 150 200 250 300
ATLAS -1
[image:5.612.62.289.433.626.2]= 13 TeV, 3.2 fb s
FIG. 1. Themsubl
2j vsmlead2j distribution for the 2-tag data sample used to model the multijet background in the resolved analysis. The signal region is the area surrounded by the inner black contour line, centered on mlead
while the control region is defined as the region in the mlead
2j −msubl2j plane between the signal and sideband
regions. These definitions are chosen to be orthogonal to the signal region and to give approximately equal event yields in both the sideband and control regions.
The normalization of the multijet background prediction is set by scaling the number of events in each region of the 2-tag sample by the following factorμMultijet calculated in
the sideband region:
μMultijet¼
N4-tagMultijet
N2-tagMultijet
¼N
4-tag data −N
4-tag
t¯t −N4-tagZþjets
N2-tagdata −N 2-tag
t¯t −N2-tagZþjets
; ð3Þ
where N2-=4-tagdata is the number of events observed in the sideband region in the 2- or 4-tag data sample, respectively. The yieldsN2-=4-tagt¯t are the estimated number oft¯tevents in the 2-/4-tag selected sideband region estimated from MC simulation. To predict the distributions of the multijet background in each region, the predicted t¯t 2-tag distri-butions are first subtracted from the 2-tag data sample before the distribution is scaled byμMultijet.
The correction for the kinematic differences between 2-tag and 4-tag samples is performed by reweighting events in the 2-tag sample. The weights are derived in the sideband
region, from linear fits to the ratio of the total background model to data for three kinematic distributions that are found to have the largest disagreement between 2-tag and 4-tag: the leading dijetpT, the angular separation between the jets in the subleading dijet, and the angular separation between the two dijets. The reweighting is performed using one-dimensional distributions but is iterated so that corre-lations between the three variables are taken into account. After the correction process, there is agreement between the background model and sideband region data.
The multijet background model is validated in the control region. TableIIcompares the observed data yield in the control region with the corresponding background estimate. The modeling of them4jdistribution in the control region is shown in Fig.3. The 4-tag events in the control
[GeV]
KK G*
m
400 600 800 1000 1200 1400 1600
Acceptance x Efficiency
0 0.02 0.04 0.06 0.08 0.1 0.12 0.14 0.16
0.18 4 b-tagged jets
2 dijets Mass-dependent cuts veto t t Signal region ATLAS Simulation
= 13 TeV s Resolved,
= 1 pl M Bulk RS, k/
[GeV]
H
m
400 600 800 1000 1200 1400 1600
Acceptance x Efficiency
0 0.02 0.04 0.06 0.08 0.1 0.12 0.14 0.16
0.18 4 b-tagged jets
2 dijets Mass-dependent cuts veto t t Signal region ATLAS Simulation
= 1 GeV H
Γ
hh, with fixed
→
H
[image:6.612.82.528.46.193.2]= 13 TeV s Resolved,
[image:6.612.316.558.446.619.2]FIG. 2. The selection efficiency as a function of resonance mass at each stage of the event selection for (left)GKK→hh→bbb¯ b¯and (right)H→hh→bbb¯ b¯ decays in the resolved analysis.
TABLE II. The number of events in data and predicted back-ground events after applying the t¯t veto in the sideband and control regions for the resolved analysis. The uncertainties are purely statistical. Thet¯tyield in this table, in contrast to the final result, is estimated using MC simulation.
Sample Sideband region Control region
Multijet 485.12.1 401.52.0
t¯t 9.60.9 14.01.2
Zþjets 3.10.7 4.91.0
Total 497.82.4 420.32.5
Data 496 396
Events / 50 GeV
20 40 60 80 100 [GeV] 4j m
400 600 800 1000 1200 1400 1600 1800 2000
Data / Bkgd
0.5 1 1.5 2 ATLAS -1
=13 TeV, 3.2 fb s
Control Region, Resolved Data Multijet
t t
Stat Uncertainty Fit to Ratio
Uncertainty σ
1 ±
[image:6.612.52.297.628.717.2]region are well described by the background model in both normalization and m4j shape.
t¯tbackground.—The normalization of thet¯tbackground is derived from data in at¯tcontrol region. Due to the limited yield in this control region, the shape of thet¯tbackground is taken from MC simulation. To further decrease statistical uncertainties, thet¯tshape is derived from MC simulation using the“2-tag” selection, with a systematic uncertainty assigned to cover the differences between the 2-tag and 4-tagm4j distributions.
Thet¯tcontrol region is formed from events which pass the 4-tag selection, except for thet¯tveto, which is reversed: if either of the dijets fails the Xtt requirement, the event enters thet¯tcontrol region. This selection leads to a sample of 21 events, of which 13.3 are estimated to be multijet events using the 2-tag sample described previously. After subtracting the multijet background, the t¯t control region yield is extrapolated to predict the t¯t yield in the signal region,Nt¯t, using the following equation:
Nt¯t¼ ϵ 2 t
1−ϵ2
t
×NCR
t¯t ; ð4Þ
whereNCRt¯t is the number of events in thet¯tcontrol region, after subtraction of multijet background, and ϵt is the efficiency for a selected dijet in at¯tevent to pass thet¯tveto. This equation relies on the assumption that the ϵt of each dijet in the event is uncorrelated, an assumption validated in t¯tMC simulation. Theϵtis measured using an independent, high-purity “semileptonic t¯t ”data sample. Events in this sample are selected by requiring one dijet candidate passing the nominal selection with pT>150GeV and one
“leptonic top-quark” candidate. The leptonic top-quark candidate is defined using a reconstructed muon and one b-tagged jet. This b-tagged jet is required to be distinct from jets in the dijet candidate, and the muon is required to havepT>25GeV, be isolated, and fall a distanceΔR <
1.5of theb-tagged jet. The leptonic top-quark candidate is required to havepT>150GeV, where the leptonic top~pT
is defined as the vector sum of theb-jet ~pTand the muon
~pT. Thet¯tveto efficiency is then measured as the fraction
of the reconstructed dijet candidates which passed the t¯t veto, yielding ϵt¯t¼0.600.04ðstatÞ 0.06ðsystÞ. A
10% systematic uncertainty is assigned to cover potential differences betweenϵt as measured in the semileptonict¯t sample andϵtin the full 4-tag selection, where the method is applied int¯tMC simulation to evaluate such differences. The measured ϵt agrees well with the corresponding semileptonic t¯t MC prediction of 0.58.
Equation (4) gives a data-drivent¯t background predic-tion of4.23.8 events. The uncertainty is dominated by the statistical uncertainty in the yield in the t¯t control region, with a smaller contribution from the uncertainty in the measured t¯tveto efficiency.
3. Systematic uncertainties
Two classes of systematic uncertainties are evaluated: those affecting the modeling of the signal and those affecting the background prediction.
The signal modeling uncertainties comprise: theoretical uncertainties in the acceptance, uncertainties in the jet energy scale (JES) and resolution (JER), and uncertainties in theb-tagging efficiency.
The following sources of theoretical uncertainty in the acceptance are evaluated: missing higher-order terms in the matrix elements and PDF set, as well as modeling of the underlying event, hadronic showers, initial- and final-state radiation. The total theoretical uncertainty is dominated by the uncertainties associated with the modeling of the initial-and final-state radiation.
The jet energy uncertainties are derived based onin situ measurements performed during Run 1 and from MC simulation extrapolations from Run-1 to Run-2 conditions
[45]. The JES systematic uncertainty is evaluated using three separate and orthogonal uncertainty components[46]. The JER uncertainty is evaluated by smearing jet energies according to the systematic uncertainties of the resolution measurement [46]. The uncertainty in the b-tagging effi-ciency is evaluated by propagating the systematic uncer-tainty in the measured tagging efficiency for b-jets [47]. The efficiencies are measured as a function ofb-jetpTand η. Forb-jets withpT>300GeV, systematic uncertainties in the tagging efficiencies are extrapolated with MC simulation and are consequently larger[18].
Systematic uncertainties in the normalization and shape of the multijet background model are assessed in the control region. The background prediction in the control region agrees with the observed data to within5%, which is taken as the uncertainty in the predicted multijet yield. To further test the robustness of the background estimation, the background model is re-evaluated using different sideband and control region definitions and different b-tagging requirements on the“2-tag” sample. These changes affect the kinematic and flavor compositions of the various regions used in the background prediction. The control region agreement and signal region predictions of all variations considered are all consistent to within the assigned 5% uncertainty in the multijet background prediction.
The uncertainty in the description of the multijet m4j distribution is determined by comparing the background prediction to the data in the control region as shown in Fig.3. To evaluate the level of agreement, a linear fit is performed on the ratio of the distributions. This fit, along with its uncertainties, shown in the bottom panel of Fig.3, gives a slope consistent with zero. The uncertainty in the multijet background shape is defined using the uncertainty in the fitted slope.
distribution is dominated by the uncertainty associated with using the 2-tag selection to model the 4-tag selection. This uncertainty is assessed by comparing the 2-tag and 4-tagt¯t MC predictions in the signal region.
Table III summarizes the relative impact of the uncer-tainties in the event yields.
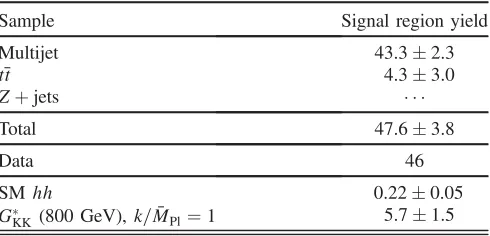
4. Event yields
The predicted number of background events in the signal region, the number of events observed in the data, and the predicted yield for two potential signals are presented in TableIV. The numbers of predicted background events and observed events are in agreement.
Figure 4 shows a comparison of the predicted m4j background distribution to that observed in the data. The predicted background and observed distributions are in agreement, with no significant local excesses.
B. Boosted analysis
1. Selection
The boosted analysis selects events with at least two large-R jets with 250< pT<1500 GeV, jηj<2.0, and mass
mJ>50GeV. The upper bound on the transverse
momen-tum and the mass requirement correspond to the kinematic region where jet calibration uncertainties are available from Refs.[41]and[48]. Only the two large-Rjets with highestpT
are retained for further selection. In order to reduce the contamination fromt¯tevents, the leading jet is additionally required to havepT>350 GeV, thus ensuring that all
[image:8.612.88.523.110.250.2]top-quark decay products are contained in a single large-R jet with mass close to that of the top quark.
TABLE III. Summary of systematic uncertainties (expressed in percentage yield) in the total background and signal event yields in the signal region of the resolved analysis. Uncertainties are provided for nonresonant SM Higgs pair production, for a GKK resonance withk=M¯Pl¼1 andm¼500GeV, and for three resonances with m¼800GeV: aGKKresonance withk=M¯Pl¼1, aGKKresonance withk=M¯Pl¼2, and a spin-0 narrow-widthH boson.
G
KK (500 GeV) GKK (800 GeV)
Source Background SMhh MkPl¼1
k MPl¼1
k
MPl¼2 H
(800 GeV)
Luminosity 5 5 5 5 5
JER 2 3 3 3 4
JES 12 14 5 4 6
b-tagging 18 15 26 27 26
Theoretical 9 2 3 3 3
Multijet 5
t¯t 6
[image:8.612.316.560.463.638.2]Total 8 24 21 28 28 28
TABLE IV. The number of predicted background events in the hhsignal region for the resolved analysis, compared to the data. The yield for two potential signals, SM nonresonant Higgs pair production and an 800 GeVGKKresonance withk=M¯Pl¼1are shown. The quoted errors include both the statistical and systematic uncertainties.
Sample Signal region yield
Multijet 43.32.3
t¯t 4.33.0
Zþjets
Total 47.63.8
Data 46
SM hh 0.220.05
G
KK (800 GeV),k=M¯Pl¼1 5.71.5
Events / 50 GeV
2 4 6 8 10 12 14 16
[GeV]
4j
m
400 600 800 1000 1200 1400
Data / Bkgd
1 2 3
ATLAS -1
=13 TeV, 3.2 fb s
Signal Region, Resolved
Data Multijet
t t
Syst+Stat Uncertainty = 1.0
Pl
M G*(800) k/
[image:8.612.53.298.597.715.2]At least two track jets must be found by the ghost method
[42] to be associated with each large-R jet. They are required to be consistent with the primary vertex of the event as well as to satisfypT>10GeV andjηj<2.5.
Since high-mass resonances tend to produce jets that are more central than multijet background processes, the two large-R jets are required to have a separationjΔηj<1.7. Signal event candidates are selected if each of the large-R jets has a mass consistent with that of the Higgs boson. This is defined as for the resolved analysis in Eq.(2), where the small-R dijet mass is replaced by the large-R jet mass, requiring Xhh<1.6. This requirement defines the signal region in the leading-subleading large-R jet mass plane.
Two samples of events are selected based on the number of b-tagged leading and subleading track jets associated with each large-R jet. They are referred to as the“3-tag” and the“4-tag”samples, and require exactly three or at least four track jets passing theb-tagging selection, respectively. In the 3-tag sample, the fourth jet is explicitly required to fail the b-tagging requirements to define orthogonal samples.
The signal region corresponds to the kinematic require-ments illustrated by the inner region in Fig.5. The data shown in this figure are derived from a sample of events that satisfy all selection criteria except for having only two track jets that pass theb-tagging requirements, referred to as the“2-tag”sample. This sample is used to estimate the background contribution as described below.
The acceptance times efficiency for each stage of the boosted-analysis event selection is shown in Fig.6for the
G
KKand heavy scalar models. The requirement that at least
two individual track jets be associated to the large-R jets becomes less efficient at high mass due to merging. The full selection for aGKK resonance with a mass of 1000 GeV (2000 GeV) and k=M¯Pl¼1 has an acceptance times
efficiency of 9% (11%) in the 3-tag sample and 8% (5%) in the 4-tag sample.
2. Background estimation
As in the resolved analysis, the dominant source of background stems from multijet (80%–90%) events and the rest is primarily due to t¯t production. The background estimation method generally follows the same approach as that described in Sec. VA 2. Differences are high-lighted below.
The shape of the multijet background in both the 3-tag and 4-tag samples is derived from the 2-tag sample. Due to the large statistical uncertainty in the background predic-tion for dijet masses (m2J) above 1500 GeV, an exponential fit to the data in the range between 900 and 2000 GeV is used to model the high-mass tail of the dijet distribution in
2
Events / 25 GeV
0 20 40 60 80 100 [GeV] lead J m
0 50 100 150 200 250 300
[GeV] subl J m 0 50 100 150 200 250 300 ATLAS -1
= 13 TeV, 3.2 fb s
[image:9.612.63.287.48.240.2]enriched t t
FIG. 5. Themsubl
J vsmleadJ distribution for the 2-tag data sample used to model the multijet background in the boosted analysis. The signal region is the area surrounded by the inner black contour line, centered on mlead
J ¼124GeV, msublJ ¼115GeV.
The control region is the area inside the outer black contour line, excluding the signal region. The sideband region is the area outside the outer contour line. The kinematic region enriched int¯t events is indicated by the dashed white contour line.
[GeV]
KK G*
m
1000 1500 2000 2500 3000
Acceptance x Efficiency
0 0.2 0.4 0.6 0.8 1 1.2 1.4
2 large-R jets
η Δ
4 track jets
hh
X
3-b signal region 4-b signal region
ATLAS Simulation
= 1 pl M Bulk RS, k/
= 13 TeV s Boosted,
[GeV]
H
m
1000 1500 2000 2500 3000
Acceptance x Efficiency
0 0.2 0.4 0.6 0.8 1 1.2 1.4
2 large-R jets
η Δ
4 track jets
hh
X
3-b signal region 4-b signal region
ATLAS Simulation
= 1 GeV H
Γ
hh, with fixed
→
H
= 13 TeV s Boosted,
[image:9.612.108.507.538.674.2]the signal region. The estimated background yield in each signal region, N3bkgð4Þ-tag, is computed according to
N3ð4Þ-tag bkg ¼μ
3ð4Þ-tag MultijetN
2-tag Multijetþα
3ð4Þ-tag t¯t N3t¯tð4Þ-tag
þN3ð4Þ-tag
Zþjets ; ð5Þ
whereN2-tagMultijetis the number of multijet events in the 2-tag
sample, N3t¯tð4Þ-tag and N3Zð4Þ-tag are the numbers of events predicted by the 3(4)-tagt¯tandZþjets MC samples. The parameterμ3Multijetð4Þ-tagcorresponds to the ratio of multijet event yields in the 3(4)-tag and 2-tag samples, as defined in Eq. (3), except for considering 3- or 4-tag events in the numerator. Finally, the parameterα3t¯tð4Þ-tag is a scale factor designed to correct the t¯t event yield estimated from the MC simulation.
A sideband region defined by
ffiffiffiffiffiffiffiffiffiffiffiffiffiffiffiffiffiffiffiffiffiffiffiffiffiffiffiffiffiffiffiffiffiffiffiffiffiffiffiffiffiffiffiffiffiffiffiffiffiffiffiffiffiffiffiffiffiffiffiffiffiffiffiffiffiffiffiffiffiffiffiffiffiffiffiffiffiffiffiffiffi
ðmlead
J −124GeVÞ2þ ðmsublJ −115GeVÞ2 p
>36GeV is used to measure μ3Multijetð4Þ-tag and α3t¯tð4Þ-tag from the data. The background estimate is validated in a control region defined to be complementary to the sideband and signal regions.
Both μ3Multijetð4Þ-tag and α3t¯tð4Þ-tag are extracted from a binned likelihood fit to the leading large-R jet mass distribution obtained in the sideband region of the 3(4)-tag sample, as shown in Fig. 7. In this fit, the multijet distribution is extracted from the 2-tag sample, after subtraction of thet¯t andZþjets contributions predicted by the MC simulation. Thet¯tandZþjets distributions in the sideband region of the 3(4)-tag sample are taken from the MC simulation. The resulting fit values and their statistical uncertainties for the 3-tag sample are μ3-tagMultijet¼0.1600.003 and α3−tag
t¯t ¼1.020.09, with a correlation coefficient of
−0.60between these two parameters. The corresponding values measured in the 4-tag sample are μ4-tagMultijet¼
0.00910.0007 and αt¯4t−tag¼0.820.39, with a
correlation coefficient of −0.58. A large anticorrelation is observed since the multijet andt¯tbackground contribu-tions are constrained to add up to the total number of events in the sideband region of the 3-tag and 4-tag data samples.
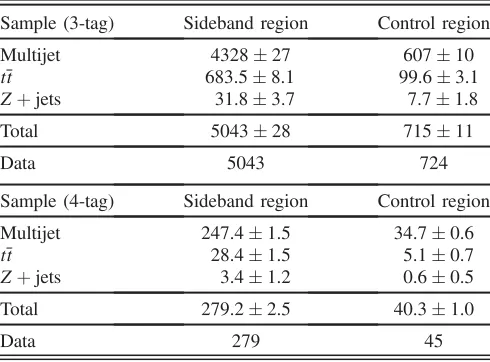
The modeling of the background yield and kinematics is validated in the control region of the 3-tag and 4-tag samples. Good agreement is observed between the data and the predicted background in both the sideband and control regions of the 3-tag and 4-tag samples as shown in Table V. The shapes of the t¯t kinematic distributions in the 4-tag signal region are extracted from the MC simulation in the 3-tag signal region due to the limited size of the 4-tag MC sample. 100 200 300 400 500 600
Data / Bkgd
0.51 1.5
ATLAS -1 =13 TeV, 3.2 fb s
Sideband Region, Boosted 3-tag
Data Multijet t t Stat Uncertainty 5 10 15 20 25 30 35 40 45
Data / Bkgd
0.51 1.5
ATLAS -1 =13 TeV, 3.2 fb s
Sideband Region, Boosted 4-tag
Data Multijet
t t
Stat Uncertainty
50 100 150 200 250 300 350 400 50 100 150 200 250 300 350 400
Leading large-R jet mass [GeV] Leading large-R jet mass [GeV]
Events / 10 GeV Events / 10 GeV
2 2 100 200 300 400 500 600
Data / Bkgd
0.51 1.5
ATLAS -1 =13 TeV, 3.2 fb s
Sideband Region, Boosted 3-tag
Data Multijet t t Stat Uncertainty 5 10 15 20 25 30 35 40 45
Data / Bkgd
0.51 1.5
ATLAS -1 =13 TeV, 3.2 fb s
Sideband Region, Boosted 4-tag
Data Multijet
t t
Stat Uncertainty
50 100 150 200 250 300 350 400 50 100 150 200 250 300 350 400
Leading large-R jet mass [GeV] Leading large-R jet mass [GeV]
Events / 10 GeV Events / 10 GeV
[image:10.612.82.527.47.203.2]2 2
[image:10.612.315.560.537.718.2]FIG. 7. The leading large-Rjet mass distribution in thehhsideband region for data (points) and background estimate (histograms) in the boosted analysis for events in the (left) 3-tag and (right) 4-tag categories. The shape of the multijet distributions is taken from the 2-tag region and is fitted to the data. The hatched bands represent the statistical uncertainty in the total background estimate.
TABLE V. The number of events in data and predicted back-ground events in thehhsideband and control regions of the 3-tag and 4-tag samples for the boosted analysis. The number of multijet and t¯t background events in the sideband regions are constrained by the number of observed events, as explained in the text. The uncertainties are purely statistical.
Sample (3-tag) Sideband region Control region
Multijet 432827 60710
t¯t 683.58.1 99.63.1
Zþjets 31.83.7 7.71.8
Total 504328 71511
Data 5043 724
Sample (4-tag) Sideband region Control region
Multijet 247.41.5 34.70.6
t¯t 28.41.5 5.10.7
Zþjets 3.41.2 0.60.5
Total 279.22.5 40.31.0
3. Systematic uncertainties
Evaluation of systematic uncertainties in the boosted analysis generally follows the same approach as that described in Sec.VA 3. Differences are highlighted here.
The large-Rjet energy resolution and scale uncertainties as well as the jet mass resolution (JMR) and scale (JMS) uncertainties are derivedin situfrom 8 TeVppcollisions, taking into account MC simulation extrapolations for the different detector and beam conditions present in 8 and 13 TeV data-taking periods [49]. The uncertainty in theb-tagging efficiency for track jets is evaluated with the same method used for R¼0.4 calorimeter jets.
Systematic uncertainties in the normalization and shape of the background model are assessed in the control region. The background predictions in both the 3-tag and 4-tag control regions agree with the observed data to within statistical uncertainties. The statistical uncertainties in the control region yields are assigned as systematic uncertain-ties in the multijet background normalization. The uncer-tainty in the shape of the multijet background is assessed in the control region via a linear fit to the ratio of the distributions shown in Fig.8.
An additional uncertainty in the shape of the tail of the background prediction is assigned by fitting the 2-tag dijet mass distribution with a variety of empirical functions designed to model power-law behavior, as described in Ref. [50]. The largest difference between the exponential function predictions and those from alternative fit functions, considering the variation of the fitted parameters within their statistical uncertainties, is taken as a systematic uncertainty. Relative systematic uncertainties in both the background and signal event yields are summarized in TableVIfor the 3-tag and 4-tag selections. For the background, the entry labeled “Statistical” corresponds to the statistical uncer-tainty from the fit to the leading large-R jet mass (see Sec.V B 2) used to extract the multijet andt¯tbackground yields, taking the correlation between these yields into account. It also includes thet¯tmodeling uncertainties and
the statistical uncertainty associated with the data yield in the 2-tag sample. Uncertainties in the m2J shape of the multijet andt¯t backgrounds are not listed in TableVI, as they do not affect the event yields, but are accounted for in the statistical analysis.
Events / 50 GeV
20 40 60 80 100 120
[GeV] 2J m
600 800 1000 1200 1400 1600 1800 2000
Data / Bkgd
1 2 3
ATLAS -1 =13 TeV, 3.2 fb s
Control Region, Boosted 3-tag
Data Multijet
t t
Stat Uncertainty Fit to Ratio
Uncertainty
σ
1
± Events / 50 GeV 2 4 6 8 10 12 14
[GeV] 2J m
600 800 1000 1200 1400 1600 1800 2000
Data / Bkgd
1 2 3
ATLAS -1 =13 TeV, 3.2 fb s
Control Region, Boosted 4-tag
Data Multijet
t t
Stat Uncertainty Fit to Ratio
Uncertainty
σ
1
[image:11.612.80.529.45.204.2]±
FIG. 8. Dijet mass distribution in the control region for data (points) and background estimate (histograms) in the boosted analysis for events in the (left) 3-tag and (right) 4-tag categories. The hatched bands represent the statistical uncertainty in the total background estimate.
TABLE VI. Summary of systematic uncertainties (expressed in percentage yield) in the total background and signal event yields in the 3-tag and 4-tag signal regions in the boosted analysis. Uncertainties are provided for a GKK resonance mass of 1500 GeV with k=M¯Pl¼1 or 2, as well as for a spin-0 narrow-widthH boson.
Source Background GKK (1500 GeV) H (1500 GeV) k=M¯Pl¼1k=M¯Pl¼2
Luminosity 5.0 5.0 5.0
3-tag
JER <1 <1 <1 <1
JES 2 <1 <1 <1
JMR 1 12 12 11
JMS 5 14 13 17
b-tagging 1 23 22 23
Theoretical 3 3 3
Multijet 3
Statistical 2 1 1 1
Total 7 31 30 33
4-tag
JER <1 <1 <1 <1
JES <1 <1 <1 <1
JMR 4 12 13 13
JMS 5 13 13 14
b-tagging 2 36 36 36
Theoretical 3 3 3
Multijet 14
Statistical 3 1 1 1
[image:11.612.315.561.421.717.2]4. Event yields
The predicted number of background events in the 3-tag and 4-tag signal regions, the number of events observed in the data, and the predicted yield for a potential signal are reported in TableVII. One event in the 4-tag signal region, with a mass of 852 GeV, is in common with the resolved analysis. The dijet mass distribution in the signal region is shown in Fig.9. An excess of data is observed in the 3-tag signal region form2J∼900GeV and in the range between 1600 and 2000 GeV. The significance of these excesses is evaluated below.
VI. RESULTS
The results from the resolved and boosted analyses are interpreted separately using the statistical procedure described in Ref.[1]and references therein. A test statistic based on the profile likelihood ratio [51] is used to test hypothesized values ofμ, the global signal strength factor, separately for each model tested. The statistical analysis described below is performed using the data observed in the signal regions. The systematic uncertainties are treated as
independent within each signal region using Gaussian or log-normal constraint terms in the definition of the like-lihood function. In the boosted analysis, the data from the 3-tag and 4-tag signal regions are fitted simultaneously treating data-derived systematic uncertainties related to the multijet background estimate as uncorrelated and all other systematic uncertainties as fully correlated. In the case of the search for nonresonanthh production, only the number of events passing the final selection is used whereas them4jor m2J distributions are used in the case of the search forhh
resonances.
A. Background-only hypothesis tests
In order to determine if there are any statistically significant local excesses in the data, a test of the back-ground-only hypothesis (μ¼0) is performed. The signifi-cance of an excess is quantified using the local p0, the probability that the background could produce a fluctuation greater than or equal to the excess observed in data. A global p0 is also calculated for the most significant discrepancy, using background-only pseudoexperiments to derive a correction for the look-elsewhere effect across the mass range tested[52].
In the case of the resolved analysis, the largest deviation from the background-only hypothesis occurs around 900 GeV and is found to have a local significance less than2σ.
In the case of the boosted analysis, the largest local deviation corresponds to a broad data excess in the 3-tag signal region starting at m2J∼1700GeV. The local sig-nificance of this excess is2.0σassuming aGKKresonance withk=M¯Pl ¼1.
B. Exclusion limits
The data are used to set upper limits on the cross sections for the different benchmark signal processes. Exclusion limits are based on the value of the statisticCLs[53], with a
Events / 50 GeV
10 20 30 40 50 60
Data / Bkgd
2 4 6
ATLAS -1 =13 TeV, 3.2 fb s
Signal Region, Boosted 3-tag
Data Multijet
t t
Syst+Stat Uncertainty = 1.0, x 50 Pl M G*(1800) k/
Events / 50 GeV
1 2 3 4 5 6 7 8 9 10
Data / Bkgd
1 2 3
ATLAS -1 =13 TeV, 3.2 fb s
Signal Region, Boosted 4-tag
Data Multijet
t t
Syst+Stat Uncertainty = 1.0, x 2 Pl M G*(1000) k/
= 1.0, x 5 Pl M G*(1500) k/
600 800 1000 1200 1400 1600 1800 2000 2200 2400 2600 600 800 1000 1200 1400 1600 1800 2000 [GeV]
2J
[image:12.612.52.298.110.227.2]m m2J [GeV]
[image:12.612.81.532.518.677.2]FIG. 9. Dijet mass distribution in thehhsignal region for data (points) and background estimate (histograms) in the boosted analysis for events in the (left) 3-tag and (right) 4-tag categories. The expected signal distributions forGKKmasses of 1000, 1500 and 1800 GeV are also shown. The uncertainty band includes both the statistical and systematic uncertainties in the background estimate. TABLE VII. The number of predicted background events in the
hh3-tag and 4-tag signal regions, compared to the data for the boosted analysis. Errors correspond to the total uncertainties in the predicted event yields. The yields for a 1000 GeVGKKin the bulk RS model withk=M¯Pl¼1is also given.
Sample
Signal region (3-tag)
Signal region (4-tag)
Multijet 23514 13.52.4
t¯t 4822 1.21.0
Zþjets 2.02.2
Total 28519 14.62.4
Data 316 20
G
value ofμregarded as excluded at the 95% confidence level (C.L.) when CLs is less than 5%.
The nonresonant search is performed using the resolved analysis, since it has better sensitivity than the boosted
analysis. Using the SMhh nonresonant production as the signal model, the observed 95% C.L. upper limit is σðpp→hh→bbb¯ b¯Þ<1.22pb, a value to be compared with the inclusive SM prediction (as defined in Sec. III) ofσðpp→hh→bbb¯ b¯Þ ¼11.3þ−1.00.9fb.
For the resonant Higgs-boson pair production search, the resolved and boosted analyses offer their best sensitivity in complementary resonance mass regions. The resolved analysis gives a more stringent expected exclusion limit for resonance masses up to (and including) 1100 GeV, while the boosted analysis offers better sensitivity beyond that mass. A simple combination of the separate exclusion limits from the resolved and boosted analyses is used. This is achieved by taking the limit from the analysis with the more stringent expected exclusion at each mass point for each of the signal models.
Figure10shows the combined 95% C.L. upper limits for three different resonances: a spin-2 GKK in the bulk RS model withk=M¯Pl¼1and 2, and a spin-0 narrow-widthH
boson. For the spin-2 GKK with k=M¯Pl¼1, limits on
σðpp→G
KK→hh→bbb¯ b¯Þare set in the range between
21 and 73 fb for masses between 600 and 3000 GeV. The corresponding range of limits for theGKKresonance with k=M¯Pl ¼2is 34 to 86 fb. Although no events are observed
at masses near 3000 GeV, the observed limit remains about 1σweaker than the expected limit due to a substantial low-mass tail in the shape of high-low-mass resonance signals and the slight data excess observed at high mass. The cross-section limits for resonance masses below 600 GeV weaken substantially due to the lower acceptance times efficiency (see Fig.2) and the increased level of background. These cross-section upper limits translate into observed (expected) excluded mass ranges of 480–770 (470– 735) GeV for k=M¯Pl¼1 and <965ð<995ÞGeV for k=M¯Pl ¼2. The cross-section upper limits for the spin-0
narrow-width H boson are similar, with 95% C.L. exclu-sion limits ranging from 30 to 300 fb in the mass range between 500 and 3000 GeV.
The search sensitivity of this analysis is similar to that achieved at pffiffiffis¼8TeV with 19.5fb−1 for resonance masses below 1350 GeV but exceeds it above that mass by factors of 1.4 at 1500 GeV and 12 at 2000 GeV. The search has also been extended to resonance masses beyond 2000 GeV, up to 3000 GeV.
VII. CONCLUSIONS
A search for both resonant and nonresonant production of pairs of Standard Model Higgs bosons has been carried out in the dominant bbb¯ b¯ channel with 3.2fb−1 of pp collision data collected by ATLAS during the 2015 run of the LHC at pffiffiffis¼13TeV. Results are reported for the resolved analysis with eachh→bb¯decay reconstructed as two separateb-tagged jets and for the boosted analysis with eachh→bb¯ decay reconstructed as a single large-radius jet associated with two small-radius track jets and a
[GeV]
KK G*
m
500 1000 1500 2000 2500 3000
) [fb] b b b b → hh → KK G* → (pp σ 1 10 2 10 3 10 4 10 = 1.0 Pl M Bulk RS, k/
Observed Limit (95% CL) Expected Limit (95% CL)
σ 1 ± Expected σ 2 ± Expected ATLAS -1
=13 TeV, 3.2 fb s Resolved Boosted (a) [GeV] KK G* m
500 1000 1500 2000 2500 3000
) [fb] b b b b → hh → KK G* → (pp σ 1 10 2 10 3 10 4 10 = 2.0 Pl M Bulk RS, k/
Observed Limit (95% CL) Expected Limit (95% CL)
σ 1 ± Expected σ 2 ± Expected ATLAS -1
=13 TeV, 3.2 fb s Resolved Boosted (b) [GeV] H m
500 1000 1500 2000 2500 3000
) [fb] b b b b → hh → H → (pp σ 1 10 2 10 3 10 4 10
Observed Limit (95% CL) Expected Limit (95% CL)
σ 1 ± Expected σ 2 ± Expected ATLAS -1
=13 TeV, 3.2 fb s
Resolved Boosted
[image:13.612.55.298.47.545.2](c)
FIG. 10. The expected and observed upper limit for pp→ G
KK→hh→bbb¯ b¯in the bulk RS model with (a)k=M¯Pl¼1and (b)k=M¯Pl¼2, as well as (c)pp→H→hh→bbb¯ b¯ with fixed
ΓH¼1GeV, at the 95% confidence level. The results of the
minimum of threeb-tags for thehhsystem. No significant data excess is observed above the estimated background consisting mainly of multijet andt¯tevents. Upper limits on the production cross section times branching ratio to the bbb¯ b¯ final state are set for spin-0 and spin-2 resonances with values ranging between 24 and 113 fb (at 95% C.L.) for resonance masses in the range between 600 and 3000 GeV. For nonresonant production, the upper limit is 1.22 pb (at 95% C.L.). The search sensitivity of this analysis exceeds that achieved at pffiffiffis¼8 TeV with 19.5fb−1 for resonance masses above 1350 GeV. Furthermore, the search has been extended to cover the mass range between 2000 and 3000 GeV.
ACKNOWLEDGMENTS
We thank CERN for the very successful operation of the LHC, as well as the support staff from our institutions without whom ATLAS could not be operated efficiently. We acknowledge the support of ANPCyT, Argentina; YerPhI, Armenia; ARC, Australia; BMWFW and FWF, Austria; ANAS, Azerbaijan; SSTC, Belarus; CNPq and FAPESP, Brazil; NSERC, NRC and CFI, Canada; CERN; CONICYT, Chile; CAS, MOST and NSFC, China; COLCIENCIAS, Colombia; MSMT CR, MPO CR and VSC CR, Czech Republic; DNRF and DNSRC, Denmark; IN2P3-CNRS, CEA-DSM/IRFU, France; GNSF, Georgia; BMBF, HGF, and MPG, Germany; GSRT, Greece; RGC, Hong Kong SAR, China; ISF, I-CORE and Benoziyo Center, Israel; INFN, Italy; MEXT and JSPS, Japan; CNRST, Morocco; FOM and NWO, Netherlands; RCN,
Norway; MNiSW and NCN, Poland; FCT, Portugal; MNE/ IFA, Romania; MES of Russia and NRC KI, Russian Federation; JINR; MESTD, Serbia; MSSR, Slovakia;
ARRS and MIZŠ, Slovenia; DST/NRF, South Africa;
MINECO, Spain; SRC and Wallenberg Foundation, Sweden; SERI, SNSF and Cantons of Bern and Geneva, Switzerland; MOST, Taiwan; TAEK, Turkey; STFC, United Kingdom; DOE and NSF, United States of America. In addition, individual groups and members have received support from BCKDF, the Canada Council, CANARIE, CRC, Compute Canada, FQRNT, and the Ontario Innovation Trust, Canada; EPLANET, ERC,
FP7, Horizon 2020 and Marie Skłodowska-Curie
Actions, European Union; Investissements d’Avenir Labex and Idex, ANR, Région Auvergne and Fondation Partager le Savoir, France; DFG and AvH Foundation, Germany; Herakleitos, Thales and Aristeia programmes co-financed by EU-ESF and the Greek NSRF; BSF, GIF and Minerva, Israel; BRF, Norway; Generalitat de Catalunya, Generalitat Valenciana, Spain; the Royal Society and Leverhulme Trust, United Kingdom. The crucial comput-ing support from all WLCG partners is acknowledged gratefully, in particular from CERN, the ATLAS Tier-1 facilities at TRIUMF (Canada), NDGF (Denmark, Norway, Sweden), CC-IN2P3 (France), KIT/GridKA (Germany), INFN-CNAF (Italy), NL-T1 (Netherlands), PIC (Spain), ASGC (Taiwan), RAL (UK) and BNL (USA), the Tier-2 facilities worldwide and large non-WLCG resource pro-viders. Major contributors of computing resources are listed in Ref.[54].
[1] ATLAS Collaboration, Observation of a new particle in the search for the Standard Model Higgs boson with the ATLAS detector at the LHC,Phys. Lett. B716, 1 (2012). [2] CMS Collaboration, Observation of a new boson at a mass
of 125 GeV with the CMS experiment at the LHC,Phys. Lett. B716, 30 (2012).
[3] K. Agashe, H. Davoudiasl, G. Perez, and A. Soni, Warped gravitons at the LHC and beyond,Phys. Rev. D76, 036006 (2007).
[4] L. Fitzpatrick, J. Kaplan, L. Randall, and L.-T. Wang, Searching for the Kaluza-Klein graviton in bulk RS models,
J. High Energy Phys. 09 (2007) 013.
[5] G. C. Branco, P. M. Ferreira, L. Lavoura, M. N. Rebelo, M. Sher, and J. P. Silva, Theory and phenomenology of two-Higgs-doublet models,Phys. Rep.516, 1 (2012).
[6] G. D. Kribs and A. Martin, Enhanced di-Higgs production through light colored scalars, Phys. Rev. D 86, 095023 (2012).
[7] R. Gröber and M. Mühlleitner, Composite Higgs boson pair production at the LHC,J. High Energy Phys. 06 (2011) 020.
[8] R. Contino, M. Ghezzi, M. Moretti, G. Panico, F. Piccinini, and A. Wulzer, Anomalous couplings in double Higgs production,J. High Energy Phys. 08 (2012) 154.
[9] ATLAS Collaboration, Search for Higgs boson pair pro-duction in thebbb¯ b¯ final state from pp collisions atpffiffiffis¼
8TeV with the ATLAS detector,Eur. Phys. J. C75, 412 (2015).
[10] CMS Collaboration, Search for resonant pair production of Higgs bosons decaying to two bottom quark-antiquark pairs in proton-proton collisions at 8 TeV,Phys. Lett. B749, 560 (2015).
[11] ATLAS Collaboration, Searches for Higgs boson pair production in thehh→bbττ,γγWW,γγbb,bbb¯ b¯channels with the ATLAS detector,Phys. Rev. D92, 092004 (2015). [12] CMS Collaboration, Searches for a heavy scalar boson H decaying to a pair of 125 GeV Higgs bosons hh or for a heavy pseudoscalar boson A decaying to Zh, in the final states with h to tautau,Phys. Lett. B755, 217 (2016). [13] ATLAS Collaboration, Search for Higgs Boson Pair
ffiffiffi
s p ¼8
TeV from the ATLAS Detector, Phys. Rev. Lett.
114, 081802 (2015).
[14] CMS Collaboration, Search for two Higgs bosons in final states containing two photons and two bottom quarks,
arXiv:1603.06896 [Phys. Rev. D (to be published)].
[15] ATLAS Collaboration, The ATLAS Experiment at the CERN Large Hadron Collider,J. Instrum.3, S08003 (2008). [16] ATLAS Collaboration, Report No. ATLAS-TDR-19, 2010,
http://cds.cern.ch/record/1291633; ATLAS Insertable B-Layer Technical Design Report Addendum, Report No. ATLAS-TDR-19-ADD-1, 2012, http://cds.cern.ch/ record/1451888.
[17] ATLAS Collaboration, Improved luminosity determination in pp collisions atpffiffiffis¼7TeV using the ATLAS detector at the LHC,Eur. Phys. J. C73, 2518 (2013).
[18] ATLAS Collaboration, Performance of b-jet identification in the ATLAS experiment,J. Instrum.11, P04008 (2016). [19] J. Alwall, R. Frederix, S. Frixione, V. Hirschi, F. Maltoni, O.
Mattelaer, H.-S. Shao, T. Stelzer, P. Torrielli, and M. Zaro, The automated computation of tree-level and next-to-leading order differential cross sections, and their matching to parton shower simulations,J. High Energy Phys. 07 (2014) 079.
[20] R. D. Ballet al., Parton distributions with LHC data,Nucl. Phys.B867, 244 (2013).
[21] T. Sjöstrand, S. Mrenna, and P. Z. Skands, A brief intro-duction to PYTHIA 8.1,Comput. Phys. Commun.178, 852 (2008).
[22] ATLAS Collaboration, Report No. ATL-PHYS-PUB-2014-021, 2014,http://cds.cern.ch/record/1966419.
[23] H.-L. Lai, M. Guzzi, J. Huston, Z. Li, P. M. Nadolsky, J. Pumplin, and C.-P. Yuan, New parton distributions for collider physics,Phys. Rev. D82, 074024 (2010). [24] M. Bahret al., Herwig++ Physics and Manual,Eur. Phys. J.
C58, 639 (2008).
[25] P. M. Nadolsky, H.-L. Lai, Q.-H. Cao, J. Huston, J. Pumplin, D. Stump, W.-K. Tung, and C.-P. Yuan, Implications of CTEQ global analysis for collider observables,Phys. Rev. D
78, 013004 (2008).
[26] S. Gieseke, C. Rohr, and A. Siodmok, Colour reconnections in Herwig++,Eur. Phys. J. C72, 2225 (2012).
[27] S. Dawson, S. Dittmaier, and M. Spira, Neutral Higgs boson pair production at hadron colliders: QCD corrections,Phys. Rev. D58, 115012 (1998).
[28] T. Plehn, M. Spira, and P. Zerwas, Pair production of neutral Higgs particles in gluon-gluon collisions,Nucl. Phys.B479, 46 (1996);B531, 655(E) (1998).
[29] LHC Higgs Cross Section Working Group, Current recom-mendations for di-Higgs cross-sections,http://twiki.cern.ch/ twiki/bin/view/LHCPhysics/LHCHXSWG.
[30] T. Sjöstrand, S. Mrenna, and P. Z. Skands, PYTHIA 6.4 Physics and Manual,J. High Energy Phys. 05 (2006) 026.
[31] P. Z. Skands, Tuning Monte Carlo generators: The Perugia tunes,Phys. Rev. D82, 074018 (2010).
[32] M. Czakon and A. Mitov, Top++: A Program for the Calculation of the Top-Pair Cross-Section at Hadron Colliders,Comput. Phys. Commun.185, 2930 (2014).
[33] D. J. Lange, The EvtGen particle decay simulation package,
Nucl. Instrum. Methods Phys. Res., Sect. A 462, 152 (2001).
[34] S. Agostinelliet al., GEANT4: A simulation toolkit,Nucl. Instrum. Methods Phys. Res., Sect. A506, 250 (2003). [35] ATLAS Collaboration, The ATLAS Simulation
Infrastruc-ture,Eur. Phys. J. C70, 823 (2010).
[36] M. Cacciari, G. P. Salam, and G. Soyez, The anti-kt jet clustering algorithm,J. High Energy Phys. 04 (2008) 063.
[37] ATLAS Collaboration, Jet energy measurement with the ATLAS detector in proton-proton collisions atpffiffiffis¼7TeV,
Eur. Phys. J. C73, 2304 (2013).
[38] ATLAS Collaboration, Report No. ATLASCONF-2014-018, 2014,http://cds.cern.ch/record/1700870.
[39] D. Krohn, J. Thaler, and L.-T. Wang, Jet Trimming,J. High Energy Phys. 02 (2010) 084.
[40] S. D. Ellis and D. E. Soper, Successive combination jet algorithm for hadron collisions, Phys. Rev. D 48, 3160 (1993).
[41] ATLAS Collaboration, Report No. ATL-PHYS-PUB-2015-035, 2015,http://cds.cern.ch/record/2042155.
[42] M. Cacciari and G. P. Salam, Pileup subtraction using jet areas,Phys. Lett. B659, 119 (2008).
[43] ATLAS Collaboration, Report No. ATLPHYS-PUB-2015-022, 2015,http://cds.cern.ch/record/2037697.
[44] ATLAS Collaboration, Muon reconstruction performance of the ATLAS detector in proton-proton collision data atffiffiffi
s p ¼13
TeV,Eur. Phys. J. C76, 292 (2016).
[45] ATLAS Collaboration, Report No. ATL-PHYS-PUB-2015-015, 2ATL-PHYS-PUB-2015-015,http://cds.cern.ch/record/2037613.
[46] ATLAS Collaboration, Jet energy measurement and its systematic uncertainty in proton-proton collisions atpffiffiffis¼
7TeV with the ATLAS detector,Eur. Phys. J. C 75, 17 (2015).
[47] ATLAS Collaboration, Report No. ATLAS-CONF-2014-004, 2014,http://cdsweb.cern.ch/record/1664335.
[48] ATLAS Collaboration, Identification of boosted, hadronically decaying W bosons and comparisons with ATLAS data taken atpffiffiffis¼8TeV,Eur. Phys. J. C76, 154 (2016).
[49] ATLAS Collaboration, Report No. ATL-PHYS-PUB-2015-033, 2015,http://cds.cern.ch/record/2041461.
[50] ATLAS Collaboration, Search for strong gravity in multijet final states produced in pp collisions atpffiffiffis¼13TeV using the ATLAS detector at the LHC,J. High Energy Phys. 03 (2016) 026.
[51] G. Cowan, K. Cranmer, E. Gross, and O. Vitells, Asymp-totic formulae for likelihood-based tests of new physics,
Eur. Phys. J. C71, 1554 (2011);73, 2501(E) (2013). [52] E. Gross and O. Vitells, Trial factors or the look elsewhere
effect in high energy physics, Eur. Phys. J. C 70, 525 (2010).
[53] A. L. Read, Presentation of search results: The CL(s) technique, J. Phys. G28, 2693 (2002).