Multiple myeloma: routes to diagnosis, clinical characteristics
and survival
–
findings from a UK population-based study
Debra Howell,1Alexandra Smith,1 Simon Appleton,1Timothy Bagguley,1 Una Macleod,2Gordon Cook,3 Russell Patmore4and Eve Roman1 1Epidemiology & Cancer Statistics Group,
Department of Health Sciences, University of York, York,2Centre for Health and Population Sciences, University of Hull, Hull,3Department of Haematology, St James’s University Hospital, Leeds, and4Queen’s Centre for Oncology and Haematology, Castle Hill Hospital, Cottingham, UK
Received 18 July 2016; revised 11 October 2016; accepted for publication 3 November 2016
Correspondence: Dr D Howell, ECSG, Health Sciences, Seebohm Rowntree Building, University of York, YORK, YO10 5DD, UK. E-mail: debra.howell@york.ac.uk
Summary
Prompt cancer diagnosis may align UK survival with European averages. We exam-ined the impact of route to diagnosis on survival for multiple myeloma patients diagnosed 2012–2013 using data from our population-based patient cohort that links to national death notifications and collects details on treatment and response (n=441). Emergency presentation was associated with advanced disease and poorer outcomes, and was the commonest route to diagnosis (281%) followed by General Practitioner urgent (190%) and two-week wait (172%) referrals. CRAB (elevated Calcium, Renal failure, Anaemia, Bone lesions) distribution varied by route (P <0001), with patients with emergency presentations most likely to have≥2 fea-tures and significantly worse survival (log-rank testv2=138,P=00002).
Keywords: multiple myeloma, route to diagnosis, clinical characteristics, survival, emergency presentation.
Estimates suggest that each year in Britain, 6600–7500 pre-mature cancer deaths could be prevented if survival matched European averages (Abdel-Rahman et al, 2009). Around a quarter of these “avoidable” deaths are attributable to haematological malignancies, with multiple myeloma (MM) accounting for almost half. Earlier diagnosis has been identi-fied as one factor likely to improve cancer outcomes (Thom-son & Forman, 2009), and a series of interventions have been introduced into UK practice to promote this, including referral guidance to facilitate identification of cancer symp-toms in primary care and a suspected cancer referral pathway (“two-week wait”) (Department of Health, 2000; NICE, 2005). Whilst the former has expedited diagnosis of many cancers, average times for MM have increased (Neal et al, 2014).
An estimated 4,300 people are diagnosed with MM annu-ally in the UK www.hmrn.org/statistics/incidence. Presenting symptoms are often vague and include musculoskeletal pain and tiredness; and patients are more likely than those with other cancers to have three or more General Practitioner (GP) visits before a secondary care referral is initiated (Lyrat-zopoulos et al, 2012; Howell et al, 2013). Delayed diagnosis of MM is associated with increased risk of complications
(bone disease, anaemia and renal failure) and poorer survival (Kariyawasan et al, 2007; Friese et al, 2009). MM is also more likely than other cancers to be diagnosed after emer-gency presentation, a route considered a crude indicator of delay and associated with poorer outcomes (Elliss-Brookes et al, 2012). This paper examines the impact of route to diagnosis on MM survival and clinical complications.
Patients and methods
The study is set within the Haematological Malignancy Research Network (HMRN: www.hmrn.org), a UK popula-tion-based cohort instigated in 2004 to generate ‘real world’ data for research and clinical purposes (www.hmrn.org/publi cations/papers). HMRN covers a population of around four million, with clinical care in the area adhering to national guidance (Smithet al, 2011). All diagnoses of haematological malignancy (>2200 annually) are made and coded using the latest World Health Organization (WHO) oncology classification (Swerdlow et al, 2016) by a single integrated haematopathology laboratory (the Haematological Malignancy Diagnostic Service: www.hmds.info). Following diagnosis, a core dataset is routinely abstracted from patients’ medical
ª2017 The Authors.British Journal of Haematologypublished by John Wiley & Sons Ltd.
British Journal of Haematology, 2017,177,67–71
This is an open access article under the terms of the Creative Commons Attribution License, which permits use, distribution and reproduction in any First published online 1 February 2017
records. For MM this includes diagnostic imaging and blood tests, with complications and prognostic risk being assessed using components of the CRAB (elevated Calcium, Renal fail-ure, Anaemia, Bone lesions) criteria (Rajkumar et al, 2014) and the International Staging System (ISS) (Greipp et al, 2005). With Section 251 support, all HMRN patients are tracked through clinical systems and linked to nationwide information on deaths.
For the present study, core data on myeloma patients diagnosed 1 July 2012 to 31 December 2013 were supple-mented with information on routes to diagnosis. This included documentation of all referrals from the time the patient first presented to hospital with potential MM symp-toms to diagnosis, defined as the date HMDS received the diagnostic sample. Data abstracted for each referral were: date/type of referral, clinical speciality referred from/to, and date of first appointment. Referral categories were based on the UK’s National Cancer Intelligence Network (NCIN) study (Table SI).
Survival (from date of diagnosis) was calculated with stan-dard time-to-event analyses, and the program strel (v1.2.7; http://www.lshtm.ac.uk/ncde/cancersurvival/tools.htm) was used to estimate relative survival. Age and sex-specific background mortality rates were obtained from national life tables (Alle-maniet al, 2015), and all analyses were undertaken in Stata 14 (www.stata.com).
Results
With a median diagnostic age of 742 years, 441 patients were diagnosed with MM during the study period. Overall, emergency presentation was the commonest route to diagno-sis (281%, n=124). Around two-thirds of patients using the emergency route (n=79) had been referred to hospital by a GP, either via Accident and Emergency (A&E) or a direct ward-admission. Of the 45 without prior GP contact, 34 self-referred to A&E or arrived via the actions of family members, nursing home staff, emergency services or the gen-eral public; and the remainder were referred from other hos-pital specialities (e.g. imaging, physiotherapy). After emergency, the next most frequent routes were GP urgent (n=84, 190%), GP two-week wait (n=76, 172%), GP routine (n=56, 127%) and hospital consultant-to-consul-tant (n=41, 93%).
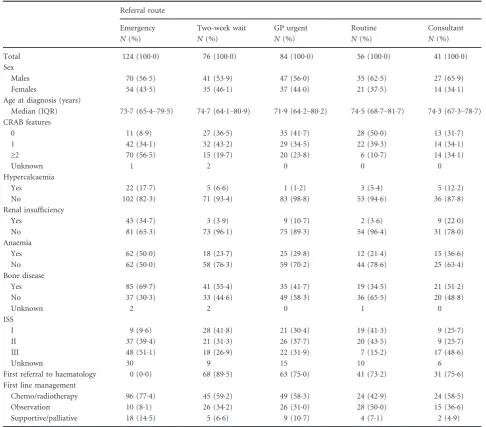
Overall, 60 patients (136%) had no referral route recorded, either because they were already being monitored by haematology (commonly for monoclonal gammopathy of undetermined significance, MGUS) (n=39, 88%) or because no details were documented in their hospital records (n=21, 48%). Demographic and clinical charac-teristics of the remaining 381 (864%) patients with a referral route are presented in Table I. According to CRAB criteria, 114 (299%) of these patients were asymptomatic at diagnosis (score: zero), 139 (365%) had one CRAB fea-ture and 125 (328%) had two or more. CRAB could not
be calculated for 3 patients: one (aged >80 years) died from other causes, one (aged >80 years) opted for no tests/treatment and died at home, and another (aged >90 years) died from kidney disease. CRAB distributions varied markedly with referral route (P<0001), with patients presenting as an emergency being the most likely to have a CRAB score ≥2 (n=70, 565%) and the least likely to have a score of zero (n=11, 89%). Conversely, patients with routine referrals were least likely to have a CRAB ≥2 (n=6, 107%) and most likely to be asymp-tomatic (n=28, 500%). Findings for ISS showed similar variations, with ISS III (the most clinically advanced dis-ease) being most commonly seen among emergency pre-sentations (n=48, 511%). ISS could not be calculated for 70 (18.4%) patients, largely because beta2 microglobulin (b2M) was not measured.
Information on haematology referrals and first-line man-agement is also presented in Table I. Of two-week wait refer-rals (to any clinical speciality), around 9 out of every 10 (68/ 76) were sent directly to haematology, as were around three-quarters of those entering secondary care by all other routes except emergency. Patients with routine referrals tended to have fewer risk factors at presentation and around half were initially managed by observation. In contrast, 774% of emer-gency presentations received first-line chemotherapy/radio-therapy and 145% were managed with supportive/palliative intent –both proportions being higher than any other diag-nostic route.
Importantly, these differences translate into marked varia-tions in outcome, with the overall and relative survival of patients with an emergency route being significantly worse than those presenting via other routes (Fig 1). As might be expected, the impact on survival is immediate; the overall survival (OS) and relative survival (RS) estimates of patients presenting as an emergency diverging markedly from that of other patients within 3 months of diagnosis: the 1 year RS estimates being 726% (95% Confidence Interval (CI) 629–
802%) and 886% (95% CI 837–921%) for emergency and non-emergency presentation respectively (log-rank test
v2=138,P=00002).
Discussion
significantly greater need for chemotherapy/radiotherapy as first-line treatment. A small proportion of emergency pre-sentations were, however solely observed, and while this may appear counterintuitive, these patients were mostly diagnosed incidentally during investigations for other seri-ous co-morbidities.
Determining when to monitor, actively investigate, or refer patients to hospital can prove challenging in primary care, particularly for cancers like MM that can present with vague symptoms and insidious onset. Nonetheless, GPs played a significant role in referrals, initiating almost two-thirds of emergency presentations and a large proportion of non-emergency referrals to haematology, suggesting prior identifi-cation of blood-related abnormalities. Similarly, 90% of all
GP two-week wait referrals were direct to haematology, implying suspicion of haematological malignancy.
This is the first study to use secondary care data alongside demographic and clinical details to examine routes to diag-nosis of MM. Major strengths include a large well-defined population-based catchment area, completeness of case ascer-tainment, detailed follow-up and world-class diagnostics. CRAB scores were largely complete, although ISS was missing for a fifth of patients becauseb2M was not always measured, particularly in older patients and those with a prior diagnosis of MGUS.
[image:3.595.45.532.91.518.2]Detailed data of the type presented here are not available elsewhere for direct comparison. The UK NCIN study (Elliss-Brookes et al, 2012), based on Hospital Episode Table I. Referral route by demographic and clinical characteristics: HMRN myeloma diagnoses July 2012 to December 2013.
Referral route
Emergency Two-week wait GP urgent Routine Consultant
N(%) N(%) N(%) N(%) N(%)
Total 124 (1000) 76 (1000) 84 (1000) 56 (1000) 41 (1000)
Sex
Males 70 (565) 41 (539) 47 (560) 35 (625) 27 (659)
Females 54 (435) 35 (461) 37 (440) 21 (375) 14 (341)
Age at diagnosis (years)
Median (IQR) 737 (654–795) 747 (641–809) 719 (642–802) 745 (687–817) 743 (673–787) CRAB features
0 11 (89) 27 (365) 35 (417) 28 (500) 13 (317)
1 42 (341) 32 (432) 29 (345) 22 (393) 14 (341)
≥2 70 (565) 15 (197) 20 (238) 6 (107) 14 (341)
Unknown 1 2 0 0 0
Hypercalcaemia
Yes 22 (177) 5 (66) 1 (12) 3 (54) 5 (122)
No 102 (823) 71 (934) 83 (988) 53 (946) 36 (878)
Renal insufficiency
Yes 43 (347) 3 (39) 9 (107) 2 (36) 9 (220)
No 81 (653) 73 (961) 75 (893) 54 (964) 31 (780)
Anaemia
Yes 62 (500) 18 (237) 25 (298) 12 (214) 15 (366)
No 62 (500) 58 (763) 59 (702) 44 (786) 25 (634)
Bone disease
Yes 85 (697) 41 (554) 35 (417) 19 (345) 21 (512)
No 37 (303) 33 (446) 49 (583) 36 (655) 20 (488)
Unknown 2 2 0 1 0
ISS
I 9 (96) 28 (418) 21 (304) 19 (413) 9 (257)
II 37 (394) 21 (313) 26 (377) 20 (435) 9 (257)
III 48 (511) 18 (269) 22 (319) 7 (152) 17 (486)
Unknown 30 9 15 10 6
First referral to haematology 0 (00) 68 (895) 63 (750) 41 (732) 31 (756)
First line management
Chemo/radiotherapy 96 (774) 45 (592) 49 (583) 24 (429) 24 (585)
Observation 10 (81) 26 (342) 26 (310) 28 (500) 15 (366)
Supportive/palliative 18 (145) 5 (66) 9 (107) 4 (71) 2 (49)
Statistics, reported a higher proportion of emergency presen-tations and fewer two-week waits; similar proportions of routine/urgent GP referrals combined; and poorer 1 year RS (51%, 95% CI 490–530). These differences may reflect the survival advantages of new treatments, or the way the date of diagnosis (e.g. report date) was assigned in our cohort com-pared to later dates often used in national data (e.g. first treatment date).
Our findings highlight the potential benefits of expedit-ing MM diagnosis and minimisexpedit-ing emergency presenta-tions. This may be achieved through raising awareness about MM, both in health settings and among the general public. Furthermore, a better understanding of events in primary care would facilitate the development and test-ing of evidence-based interventions to prevent emergency presentation.
Acknowledgements
HMRN is funded by Bloodwise and receives support from NHS clinical and administrative staff across the study area. This study was funded by Cancer Research UK as part of the National Awareness and Early Diagnosis Initiative.
Ethics statement
HMRN has ethical approval (REC 04/01205/69) from Leeds West Research Ethics Committee, R&D approval from each Trust, and exemption from Section 251 (formally Section 60) of the Health & Social Care Act (2001) (PIAG 1-05(h)/2007).
Authors’ contributions
DH, ER and AS planned and implemented the study. ER and AS directed the analysis. SA and TB analysed the data. GC, UM and RP commented on clinical aspects. DH and ER drafted the manuscript, which was approved by all authors.
Competing interests
GC is in receipt of honoraria and research funding from Janssen, Celgene, Takeda, Sanofi, Bristol Myers Squibb, and is a member of the Speakers Bureau; all remaining authors declare that they have no competing interests.
Supporting Information
Additional Supporting Information may be found in the online version of this article:
Table SI.Referral types, GP involvement and definitions.
References
Abdel-Rahman, M., Stockton, D., Rachet, B., Hakulinen, T. & Coleman, M.P. (2009) What if cancer survival in Britain were the same as in Europe: how many deaths are avoidable?British Journal of Cancer,101, S115–S124.
Allemani, C., Weir, H.K., Carreira, H., Harewood, R., Spika, D., Wang, X.-S., Bannon, F., Ahn, J.V., Johnson, C.J., Bonaventure, A., Marcos-Gragera, R., Stiller, C., Azevedo e Silva, G., Chen, W.-Q., Ogunbiyi, O.J., Rachet, B., Soeberg, M.J., You, H., Matsuda, T., Bielska-Lasota, M., Storm, H., Tucker, T.C. & Coleman, M.P.; CONCORD Working Group. (2015) Global surveillance of cancer survival 1995–2009: analysis of individual data for 25,676,887 patients from 279 popula-tion-based registries in 67 countries (CON-CORD-2).Lancet,385, 977–1010.
Department of Health. (2000) The NHS Cancer plan: a plan for investment, a plan for reform (London, UK).
Elliss-Brookes, L., McPhail, S., Ives, A., Greenslade, M., Shelton, J., Hiom, S. & Richards, M. (2012) Routes to diagnosis for cancer – determining the patient journey using multiple routine data sets.British Journal of Cancer,107, 1220–1226. Friese, C.R., Abel, G.A., Magazu, L.S., Neville,
B.A., Richardson, L.C. & Earle, C.C. (2009) Diagnostic delay and complications for older adults with multiple myeloma. Leukaemia & Lymphoma,50, 392–400.
Greipp, P.R., Miguel, J.S., Durie, B.G.M., Crowley, J.J., Barlogie, B., Blade, J., Boccadoro, M., Child, J.A., Avet-Loiseau, H., Kyle, R.A., Lahuerta, J.J., Ludwig, H., Morgan, G., Powles, R., Shimizu, K., Shustik, C., Sonneveld, P., Tosi, P., Tures-son, I. & Westin, J. (2005) International staging system for multiple myeloma.Journal of Clinical Oncology,23, 3412–3420.
Howell, D.A., Smith, A.G., Jack, A., Patmore, R., Macleod, U., Mironska, E. & Roman, E. (2013) Time-to-diagnosis and symptoms of myeloma, lymphomas and leukaemias: a report from the
Haematological Malignancy Research Network.
BMC Hematology,13, 9.
Kariyawasan, C.C., Hughes, D.A., Jayatillake, M.M. & Mehta, A.B. (2007) Multiple myeloma: causes and consequences of delay in diagnosis. QJM,
100, 635–640.
Lyratzopoulos, G., Neal, R.D., Barbiere, J.M., Rubin, G.P. & Abel, G.A. (2012) Variation in number of general practitioner consultations before hospital referral for cancer: findings from the 2010 National Cancer Patient Experience Survey in England. The Lancet Oncology, 13, 353–365.
Neal, R.D., Din, N.U., Hamilton, W., Ukoumunne, O.C., Carter, B., Stapley, S. & Rubin, G. (2014) Comparison of cancer diagnostic intervals before and after implementation of NICE guidelines: analysis of data from the UK General Practice Research Database. British Journal of Cancer,
110, 584–592.
NICE. (2005) Referral Guidelines for Suspected Cancer. Department of Health, London.
[image:4.595.68.297.76.221.2]Rajkumar, S.V., Dimopoulos, M.A., Palumbo, A., Blade, J., Merlini, G., Mateos, M.-V., Kumar, S., Hillengass, J., Kastritis, E., Richardson, P., Land-gren, O., Paiva, B., Dispenzieri, A., Weiss, B., LeLeu, X., Zweegman, S., Lonial, S., Rosinol, L., Zamagni, E., Jagannath, S., Sezer, O., Kristins-son, S.Y., Caers, J., Usmani, S.Z., Lahuerta, J.J., Johnsen, H.E., Beksac, M., Cavo, M., Gold-schmidt, H., Terpos, E., Kyle, R.A., Anderson, K.C., Durie, B.G.M. & Miguel, J.F.S. (2014)
International Myeloma Working Group updated criteria for the diagnosis of multiple myeloma.
The Lancet Oncology,15, e538–e548.
Smith, A., Howell, D., Patmore, R., Jack, A. & Roman, E. (2011) Incidence of haematological malignancy by sub-type: a report from the Hae-matological Malignancy Research Network. Bri-tish Journal of Cancer,105, 1684–1692. Swerdlow, S.H., Campo, E., Pileri, S.A., Harris,
N.L., Stein, H., Siebert, R., Advani, R.,
Ghielmini, M., Salles, G.A., Zelenetz, A.D. & Jaffe, E.S. (2016) The 2016 revision of the World Health Organization (WHO) classifica-tion of lymphoid neoplasms.Blood,127, 2375–
2390.
Thomson, C.S. & Forman, D. (2009) Cancer sur-vival in England and the influence of early diag-nosis: what can we learn from recent EUROCARE results? British Journal of Cancer,