This is a repository copy of
Practical guide to sample size calculations: an introduction
.
White Rose Research Online URL for this paper:
http://eprints.whiterose.ac.uk/97115/
Version: Accepted Version
Article:
Flight, L. orcid.org/0000-0002-9569-8290 and Julious, S.A. (2016) Practical guide to
sample size calculations: an introduction. Pharmaceutical Statistics , 15 (1). pp. 68-74.
ISSN 1539-1604
https://doi.org/10.1002/pst.1709
This is the peer reviewed version of the following article: Flight, L., and Julious, S. A.
(2016) Practical guide to sample size calculations: an introduction. Pharmaceut. Statist.,
15: 68–74. doi: 10.1002/pst.1709., which has been published in final form at
http://dx.doi.org/10.1002/pst.1709. This article may be used for non-commercial purposes
in accordance with Wiley Terms and Conditions for Self-Archiving
(http://olabout.wiley.com/WileyCDA/Section/id-820227.html).
eprints@whiterose.ac.uk https://eprints.whiterose.ac.uk/ Reuse
Unless indicated otherwise, fulltext items are protected by copyright with all rights reserved. The copyright exception in section 29 of the Copyright, Designs and Patents Act 1988 allows the making of a single copy solely for the purpose of non-commercial research or private study within the limits of fair dealing. The publisher or other rights-holder may allow further reproduction and re-use of this version - refer to the White Rose Research Online record for this item. Where records identify the publisher as the copyright holder, users can verify any specific terms of use on the publisher’s website.
Takedown
If you consider content in White Rose Research Online to be in breach of UK law, please notify us by
Practical guide to sample size calculations:
an introduction
Laura Flight1
and Steven. A. Julious1
March 24, 2016
Abstract
A sample size justification is a vital step when designing any trial. How-ever, estimating the number of participants required to give a meaningful result is not always straightforward. A number of components are required to facilitate a suitable sample size calculation. In this paper, the general steps are summarised for conducting sample size calculations with practical advice and guidance on how to utilise the app SampSize.
1
Introduction
When planning a study, an essential step is the calculation of the minimum sample size required to meet the study objectives. Estimating the number of participants required to give a meaningful result is not always straightforward. A study with a poorly calculated sample size not only wastes resources but also has ethical implications. Recruiting too many participants runs the risk of more individuals than necessary receiving an inferior treatment. Too few may not give enough evidence to answer the original research question [1]. The motivations for and against a sample size calculation are discussed in Table 1
This paper is the first in a series of three articles. It summarises some important concepts required for sample size estimation. The steps needed to carry out calculations are outlined and demonstrated using the app SampSize. Subsequent papers demonstrate these steps for various trial objectives focussing on trials with a Normal primary endpoint. The series provides a condensed summary of key points and is largely adapted from the work of Julious [2].
2
SampSize
Table 1: The motivations for carrying out sample size calculations.
A sample size justification is a requirement for any clinical investigation. Many journals in their guidelines for authors ask for a sample size justification. For example, the BMJ ask for [7]
‘The sample size calculation (drawing on previous literature) with an estimate of how many participants will be needed for the primary outcome to be statistically, clinically and/or politically significant.’
A sample size justification is required for an ethics submis-sion [8] and by CONSORT [9] and is recommended as an assessment of quality in the reporting of trials [8]-[10].
Why not do a sample size calculation?
There is rarely enough information for precise calculations. When designing a study, a statistician will ask for any previ-ous, similar studies to obtain information for a sample size calculation. The information available, however, is often either sparse or suboptimal. This is not surprising. The ra-tionale for the trial being planned is usually to obtain good quality information on an intervention to change prescrib-ing or policy. If there was already good quality information, there would be no need to conduct a trial. Thus, an in-vestigator plans a trial to obtain good quality information but then has poor quality information to plan the trial. Hav-ing pilot information can assist greatly therefore in plannHav-ing [11],[12].
Even when information is available to assist with sample size estimation, often the main constraints are availability of patients, finance, resources and time. Even given these final points, there should still be a sample size justification in the protocol with a statement that the sample size is based on feasibility disclosed.
of a sample size calculation. Details on how to obtain the app are provided in Table 2.
3
Determining the Trial Objective
The first step in a sample size calculation is to establish the trial objective. This motivates the type of trial to be conducted. In terms of hypothesis testing, there are four main types of trial:
Table 2: How to obtain the app SampSize
The SampSize app is available on the Apple App Store to download for free and can be used on iPod Touch, iPad and iPhones. The app is also available on the Android Market. It requires Android version 2.3.3 and above.
For the calculations in this paper, an iPad is used.
• Non-inferiority trials,
• Equivalence trials and
• Bioequivalence trials.
We will not go into detail describing the types of trials in this paper we will do this in the subsequent papers [4],[5].
A distinction therefore needs to be drawn to highlight differences in trials designed to demonstrate ‘superiority’ and trials designed to demonstrate ‘equiv-alence’ or ‘non-inferiority’. This is discussed with an emphasis on how differences in the null and alternative hypotheses can impact on calculations.
The types of trial can often be confusing especially when formally writing down the trial in terms of the null and alternative hypotheses. Clinical trials are often named after their alternative hypothesis. For example, in a superior-ity trial, the null hypothesis is that there is no difference between treatments, and the alternative hypothesis is that there is a statistically significant differ-ence. Informally, it is useful to consider the null hypothesis as ‘what we are investigating’, while the alternative is ‘what we wish to show’.
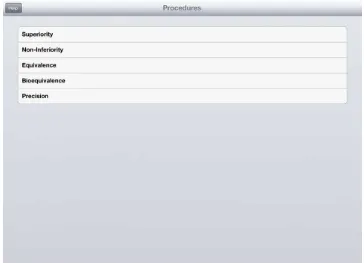
A summary of these trial types and their hypotheses is given in Table 3. In addition to trials designed to investigate an effect or lack of trials can be undertaken to investigate possible effects for future investigation such as in pilot or early phase trials [6]. Such trials could be designed using an estimation approach to give a required precision around the estimates of effect. All these trial types can be handled in SampSize (Figure 1). This series will concentrate on superiority, non-inferiority and equivalence trials [4],[5].
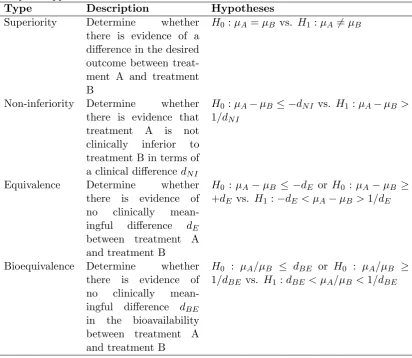
Table 3: Summary of hypotheses for different trial objectives available in the SampSize app.
Type Description Hypotheses
Superiority Determine whether there is evidence of a difference in the desired outcome between treat-ment A and treattreat-ment B
H0 :µA=µB vs. H1:µA6=µB
Non-inferiority Determine whether there is evidence that treatment A is not clinically inferior to treatment B in terms of a clinical differencedN I
H0 :µA−µB ≤ −dN I vs. H1 :µA−µB > 1/dN I
Equivalence Determine whether there is evidence of no clinically mean-ingful difference dE
between treatment A and treatment B
H0 :µA−µB ≤ −dE or H0 :µA−µB ≥ +dE vs. H1:−dE < µA−µB>1/dE
Bioequivalence Determine whether there is evidence of no clinically mean-ingful difference dBE
in the bioavailability between treatment A and treatment B
Figure 1: Options available on SampSize for different trial objectives.
3.1 The Type of Trial
This series focusses on parallel group designs. In a crossover trial, each patient receives all treatments. Usually, the order in which the participant receives the treatment is randomised. For example, one participant may receive the active treatment for 2 months followed by the placebo treatment for 2 months, while another participant may receive the placebo treatment for 2 months followed by the active treatment for 2 months.
In a parallel group trial, participants are usually randomised to one of the treatment arms for the duration of the study. Therefore, all participants receive one of the treatments. In a superiority trial, one group might receive an active treatment while another group receive the placebo at the same time [14]. For equivalence and non-inferiority trials, the alternative treatment could be the current standard of care or an alternative active treatment.
4
Deciding on the Endpoint
The choice of endpoint is important in the sample size calculation. The sample size should be calculated on the primary endpoint used to assess the primary outcome. The endpoint can take a number of forms including the following:
• Normal,
• Binary,
• Ordinal and
• Time to event (survival).
The choice of endpoint depends on a number of factors such as the objective of the trial. As an example, if reduction in pain is the primary objective, pain measured on a visual analogue scale may be anticipated to take a Normal form. A binary endpoint might be the presence or absence of pain.
The papers in this series will focus on parallel group trials where the endpoint is anticipated to take a Normal form. However, the principles discussed can be generalised to other data forms [2]. The app SampSize can calculate sample sizes for both binary and Normal endpoints.
5
Error
Every trial is vulnerable to error. When estimating a sample size it is possible to reduce the chance of making an error to a level that is deemed acceptable. For all trial types, when testing a null hypothesis, there are two types of error that can be made:
1. RejectingH0 when it is actually true: type I error (α).
2. Failing to reject H0 when it is actually false: type II error (β).
The aim of the sample size calculation is to find the minimum sample size for a fixed probability of type I error and fixed probability of a type II error.
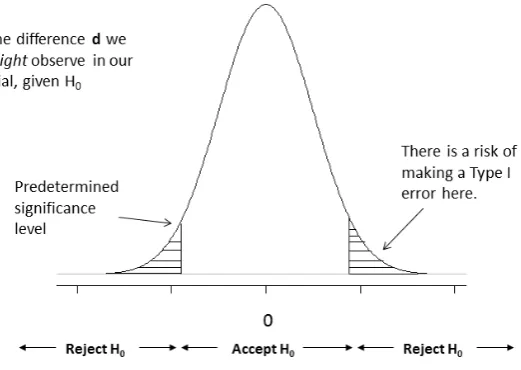
5.1 Type I Error
A type I error (α) is the probability of rejecting the null hypothesis when it is true. In a superiority trial, this would result in rejecting the null of no difference between the two treatments when in fact there is one. This error is sometimes referred to as society’s risk [6] as making this kind of mistake could result in a treatment being made available to patients that in truth does not work or is not efficacious.
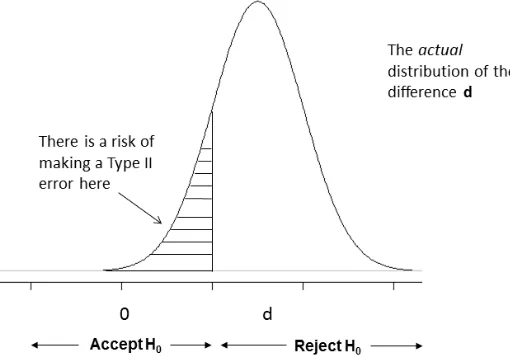
Figure 3: Density plot under the alternative hypothesis.
It is possible to reduce the chances of a type I error by reducing the level of ‘statistical significance’ required. This results in moving the tails further away from zero before a difference is accepted as being statistically significant. The convention for a superiority trial is to set the significance level at a two-sided level of 5% [15]. As will be highlighted in subsequent papers in the series, this convention changes depending on the objective of the trial: such as for equivalence and non-inferiority.
5.2 Type II Error and Power
A type II error (β) is the probability of failing to reject the null hypothesis when it is false. This is often known as the investigator’s risk as if the investigator fails to detect a treatment that works, then they will miss an opportunity to market and benefit financially. It is desirable to make this error as small as possible. Conventionally, this value is between 10% and 20% [14],[17].
Figure 3 illustrates when a type II error might be made. Under the alternative hypothesis H1, there is a distribution of responses if the alternative is true, centred on a difference d. There is still a chance a difference will be observed that will provide insufficient evidence to reject the null hypothesis.
a null of no difference between a treatment and placebo, then the treatment will not get used even though it is superior. If the trial was a placebo-controlled trial and there are already many other treatments in the same class for the condition on the market, the cost to society may not be great.
As a counter to this, if we reject the null hypothesis when it is true (type I error), it is possible a treatment will become available to patients that is no better than placebo. In health services research where the two treatments could be two care pathways, then a new care pathway may be needlessly introduced. In both these instances, introducing the new treatment will be to the detriment of society.
In sample size calculations, it is more common to work in terms of the power of a clinical trial. Power is one minus the probability of a type II error, thus giving the probability of correctly rejecting the null hypothesis. Therefore, power is usually set to be between 80% and 90%. The minimum power should be 80%. Because of the practical nature of conducting a clinical trial, it is recom-mended to set the power as high as possible, preferably at least 90%. When designing a trial, it is necessary to estimate the population standard deviation and study completion rates. These are just estimates however, and once the trial has started, you may find them to be awry. If the standard deviation is higher and the completion rate lower than anticipated, the sample size might need to be increased to maintain the desired power. However, this can have logistical impacts on the conduct of the trial: increased budgets, timeline extensions and protocol amendments. If the study was designed with 90% power, then a deci-sion could be made to forego a little power to maintain the same budget and timelines. If this study was designed with 80% power, there may not be this option as the study is already at its minimum power. A 90% powered study is less sensitive to the assumptions in the sample size calculation than a 80% powered study.
It is worth noting that for publicly funded trials, trials designed with 80% power are over twice as likely not to recruit at least 80% of their target sample size compared with those designed with 90% power; indeed, planning a trial with 80% power could be seen as a marker for a study that may fail to recruit [16]. A study may be planned with 80% power as a priori, there is an anticipation that the trial would struggle to recruit.
6
Effect Size (or Margin)
The effect size is probably the main factor in estimating sample size [2]. In a superiority trial, it may be desirable to test the null hypothesis of no difference between, say, treatment A and treatment B against an alternative hypothesis that the two treatments differ by an amountd. This amountdis the effect size. This is also known as a clinically important difference or the minimum value worth detecting [17].
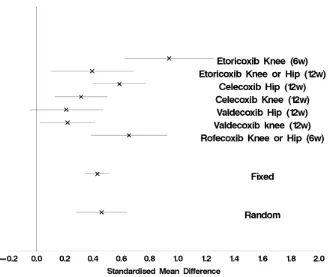
Figure 4: Meta-analysis for a visual analogue scale across seven studies.
the estimation of treatment effects is to use a meta-analysis of previous results using methods such as those proposed by Whitehead and Whitehead [18].
We will talk in greater detail on non-inferiority and equivalence margins in the sample size papers for these calculations [5].
6.1 Worked Example
Suppose we are planning a study in an osteoarthritis population. Information from seven trials is available, which could help design our trial. The endpoint to be used in the planned trial is physical function measured on a visual analogue scale (VAS).
As the different studies used different VAS measures, rather than the mean difference (¯xA−x¯B), a scale independent standardised estimate of effect (¯xA−
¯
xB)/sshould be used, where s is the standard deviation. A meta-analysis can be
conducted with these standardised differences [18]. This can assist in deriving the clinically important difference to use in the design of the proposed trial.
7
Population Variance
Another component of a sample size calculation is an estimate of the population variability. This is often estimated based on retrospective data from a collec-tion of studies. To adjudicate on the relative quality of the variance, Julious recommends examining the following [14]:
1. Design Is the study design ostensibly similar to the one you are designing? Data from observational studies rather than randomised controlled trials might have greater variability [2]. If undertaking a multi-centre trial, has the variance been estimated from a similarly designed trial? Is the time between treatment and the outcome of interest similar to your own study?
2. Population Consideration of the demographics of the study population is crucial. Is the study population similar? If the trial conducted was multi-centre, was it conducted in similar countries? Different countries may have different types of care (e.g. different concomitant medication) and so may have different trial populations. Was the same type of patient enrolled (the same mix of mild, moderate and severe)? Was it conducted covering the same seasons (relevant for conditions such as asthma)?
3. Analysis It is important to establish whether the same analysis was con-ducted and same summary statistics used. We are often faced with little information to inform the design of a new clinical trial; however, if we had the information needed say from a large clinical trial we may not need to carry out the current trial at all as we would already have the answers we need. If there is little to no information about the variance upon which to calculate a sample size, it might be advisable to consider an adaptive approach and re-estimating the sample size during the trial [2].
8
Other Design Considerations
When estimating a sample size, some other factors need to be accounted for. It may be desirable to account for potential dropouts in a study. An estimate of this rate might be obtainable from previous research and experience
In the CACTUS pilot study [19], participants suffering from long-standing aphasia post stroke were randomised to either a computer-based treatment or usual care. The observed dropout rate was 5 out of 33 (15%, 95% CI: 5-32%), translating into a completion rate of 28/33 (85%, 95% CI: 68-95%). This in-formation was then used to inform the sample size calculation of the definitive study by first calculating the required sample size using all of the steps discussed here and then dividing this value by the completion rate.
Also, it is necessary to establish the number of available participants that meet the inclusion criteria. It is not useful to calculate a sample size of 500 patients only to then find that the patient population is actually just 250 at the centres where you are recruiting. A consideration when recruiting for a trial is whether the trial is recruiting from a prevalent population or a presenting population.
In the cluster randomised controlled trial PLEASANT, a postal intervention is sent to parents or carers of school children with asthma during the summer holidays. This aims to reduce the number of unscheduled medical contacts in September [20]. Although GP practices had to be recruited into the trial, in terms of the patient population, the study had a prevalent population. It was estimated, with reasonable precision, the number of children with asthma for a given GP practice size.
A presenting population was used in the RATPAC clinical trial [21] where the effectiveness of point of care marker panels was assessed in patients with sus-pected but not proven acute myocardial infarction. In this study, the population was patients attending the emergency department with suspected acute myocar-dial infarction. It was important to estimate the number of people who were likely to have this event and meet the inclusion criteria at the centres involved in the study to establish a realistic sample size for the trial.
Many trials recruit from a combination of both presenting and prevalent patients. For example, for trials such the CACTUS trial, the initial bolus of recruitment was prevalent patients who meet the entry criteria followed by a wait as new patients then presented.
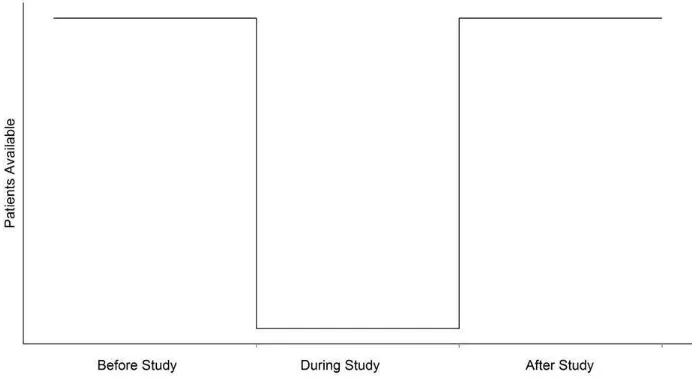
Even once the number of available patients has been estimated, it is often the case that the actual recruitment seen once the trial has begun is considerably less than expected. Lasagna’s Law [22], Figure 5, illustrates how many clini-cal trialists feel eligible trial patients present themselves to recruiting centres. Lasagna states that the number of available patients drops dramatically once the study begins and returns to the usual numbers as soon as the trial ends.
Even with good planning, recruitment can behave unexpectedly, and it is valuable to anticipate carefully potential recruitment rates. It was discussed earlier how studies should be planned with 90% power due to the sensitivity of the study to study design assumptions. Recruitment rates are one major assumption that might influence the decision to drop power if they are not as great as expected.
A further consideration when designing a clinical trial is consideration of the intent to treat (ITT) or per protocol (PP) data sets.
The ITT population is the patient population evaluated based on the treat-ment regimen patients were planned to receive when they were first randomised as opposed to the actual treatment given. As a consequence, ‘subjects allocated to a treatment group’ are ‘followed up, assessed and analysed as members of that group irrespective of their compliance to the planned course of treatment’ [15].
Figure 5: Illustration of Lasagna’s law.
For a superiority trial, the primary data set would be that based on ITT data set; for a non-inferiority and equivalence trial, the primary data set would be both the PP and the ITT data sets [23].
9
Sensitivity
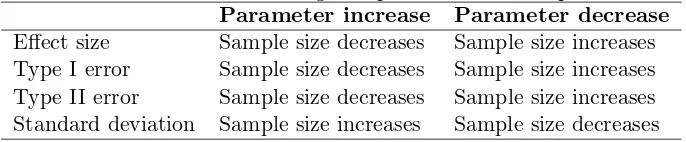
In the steps highlighted, a number of key components to a sample size calculation are discussed. It is useful, however, to establish how sensitive the calculation is to changes in each of these parameters in Table IV. Choosing 80% power rather than 90% results in a 25% saving in the sample size; however, this is at the expense of doubling the type II error. This also reduces flexibility once the trial has begun, for example, if recruitment is slower than expected. Reducing the effect size by half will also quadruple the required sample size [14]. In a non-inferiority or equivalence trial, it will be changes in the limits chosen that affect the sample size.
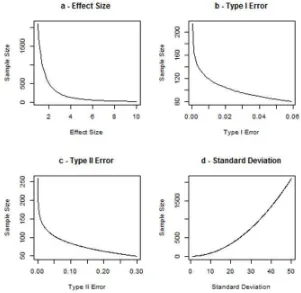
To illustrate how changing each of these parameters can affect sample size, the formula for a superiority parallel group trial is used
nA=
(r+ 1)(Z1−β+Z1−α/2) 2
(σ2 )
rd2 (1)
α = 0.05, β = 0.1,d= 5 and σ = 10. In turn, each of the parameters is varied over a range of values while holding the other parameters at the values given in the preceding text. These plots are given in Figure 6.
In plots a, b and c, we can see that when the effect size, the type I error (α) and the type II error (β) respectively are increased the sample size decreases. However, in plot d, as the standard deviation increases, our uncertainty increases, and thus, the sample size increases.
Table 4: Influence of changes in parameters on sample size.
Parameter increase Parameter decrease
Effect size Sample size decreases Sample size increases Type I error Sample size decreases Sample size increases Type II error Sample size decreases Sample size increases Standard deviation Sample size increases Sample size decreases
10
Summary
Sample size justifications are a vital part of any clinical investigation. A number of components are required to ‘cook up’ a suitable sample size calculation. In this paper, the general steps are summarised for conducting sample size calculations once all of the components are estimated.
11
Acknowledgements
We would like to thank two anonymous reviewers whose considered comments greatly improved the paper. This report is independent research arising from a Research Methods Fellowship (RMFI-2013-04-011 Goodacre) supported by the National Institute for Health Research. The views expressed in this publication are those of the authors and not necessarily those of the NHS, the National Institute for Health Research, the Department of Health or the University of Sheffield.
References
[1] Altman DG, Moher D, Schultz KF. Peer review of statistics in medical research. Reporting power calculations is important.BMJ 2002; 325:491.
[2] Julious S. Sample sizes for clinical trials. Chapman and Hall: Boca Raton, Florida, 2009.
[image:15.595.125.468.234.305.2][4] Flight L, Julious SA. Practical guide to sample size calculations: superiority trials.Pharmaceutical Statistics.
[5] Flight L, Julious SA. Practical guide to sample size calculations: non-inferiority and equivalence trials.Pharmaceutical Statistics.
[6] Lee EC, Whitehead AL, Jacques RM, Julious SA. The statistical interpre-tation of pilot trials: should significance thresholds be reconsidered? BMC Medical Research Methodology 2014; 14: 4148.
[7] BMJ. Instructions for authors. Available at:http://bmjopen.bmj.com/ site/about/guidelines.xhtml(accessed 07.07.2015).
[8] IRAS. Integrated research application system. Available at: https://www. myresearchproject.org.uk/(accessed 07.07.2015).
[9] Moher D, Schulz KF, Altman DG. The CONSORT statement: revised rec-ommendations for improving the quality of reports of parallel-group ran-domised trials.The Lancet 2001; 357:11914.
[10] Charles P, Giraudeau B, Dechartres A, Baron G, Ravaud P. Report-ing of sample size calculation in randomised trials: review. BMJ 2009; 338(1732):338357. DOI: 10.1136/bmj.b1732.
[11] Billingham SAM, Whitehead AL, Julious SA. An audit of sample size for pilot and feasibility trials being undertaken in United Kingdom registered in the United Kingdom Clinical Research Network Database.BMC Medical Research Methodology 2013; 13:104110. DOI: 10.1186/1471-2288-13-104
[12] Julious SA. Sample size of 12 per group rule of thumb for a pilot study. Pharmaceutical Statistics 2005; 4(4):28791.
[13] CPMP. Points to consider of multiplicity issues in clinical trials. (CPMP/EWP/908/99) 19 September 2002.
[14] Julious SA. Tutorial in biostatistics: sample sizes for clinical trialswith nor-mal data.Statistics in Medicine; 23:19211986.
[15] International Conference on Harmonisation of Technical Requirements for Registration of Pharmaceuticals for Human Use ICH harmonised tripartite guideline statistical principles for clinical trials e9 1998. Available at: http://www.ich.org/fileadmin/Public_Web_Site/ICH_ Products/Guidelines/Efficacy/E9/Step4/E9_Guideline.pdf(accessed 07.07.2015).
[16] Sully BGO, Julious SA, Nicholl J. A reinvestigation of recruitment to ran-domised, controlled, multicenter trials: a review of trials funded by two UK funding agencies.Trials 2013; 14:166175.
[18] Whitehead A, Whitehead J. A general parametric approach to the meta-analysis of randomised trials.Statistics in Medicine; 10:16651677.
[19] Palmer R, Enderby P, Cooper C, Latimer N, Julious S, Paterson G, Dimairo M, Dixon S, Mortley J, Hilton R, Delaney A, Hughes H. Computer therapy compared with usual care for people with long-standing aphasia poststroke: a pilot randomized controlled trial.Stoke 2012; 43:19041911.
[20] Horspool M, Julious SA, Boote J, Bradburn MJ, Cooper CL, Davis S, El-phick H, Norman P, Smithson WH, van Staa T. Preventing and lessening exacerbations of asthma in school-age children associated with a new term (PLEASANT): study protocol for a cluster randomised control trial.Trials 2013; 14:297.
[21] Goodacre S, BradburnM, Cross E, Collinson P, Gray A, Gray A. Hall AS on behalf of the RATPAC Research Team. The Randomised Assessment of Treatment using Panel Assay of Cardiac Markers (RATPAC) trial: a ran-domised controlled trial of point-of-care cardiac markers in the emergency department.Heart 2011; 97(3):190-6. DOI: 10.1136/hrt.2010.203166.
[22] van der Wouden JC, Blankenstein AH, Huibers MJH, van der Windt DAWM, Stalman WAB, Verhagen AP. Survey among 78 studies showed that Lasagnas law holds in Dutch primary care research. Journal of Clini-cal Epidemiology 2007; 60(8):819824.