Disease Progression
Frederik Graw,a,bRoland R. Regoesb
Center for Modeling and Simulation in the Biosciences, Heidelberg University, Heidelberg, Germanya; Institute of Integrative Biology, ETH Zurich, Zurich, Switzerlandb
ABSTRACT
During the chronic phase of HIV-1 infection, polyfunctional CD8ⴙT cell responses, which are characterized by a high frequency of cells able to secrete multiple cytokines simultaneously, are associated with lower virus loads and slower disease progression. This relationship may arise for different reasons. Polyfunctional responses may simply be stronger. Alternatively, it could be that the increased functional diversity in polyfunctional responses leads to lower virus loads and slower disease progression. Lastly, polyfunctional responses could contain more CD8ⴙT cells that mediate a specific key function that is primarily responsi-ble for viral control. Disentangling the influences of overall strength, functional diversity, and specific function on viral control and disease progression is very relevant for the rational design of vaccines and immunotherapy using cellular immune re-sponses. We developed a mathematical model to study how polyfunctional CD8ⴙT cell responses mediating lytic and nonlytic effector functions affect the CD4ⴙT cell count and plasma viral load. We based our model onin vitrodata on the efficacy of gamma interferon (IFN-␥) and macrophage inflammatory protein 1(MIP-1)/RANTES against HIV. We find that the strength of the response is a good predictor of disease progression, while functional diversity has only a minor influence. In addition, our model predicts for realistic levels of cytotoxicity that immune responses dominated by nonlytic effector functions most posi-tively influence disease outcome.
IMPORTANCE
It is an open question in HIV research why polyfunctional CD8ⴙT cell responses are associated with better viral control, while individual functional correlates of protection have not been identified so far. Identifying the role of CD8ⴙT cells in HIV-1 infec-tion has important implicainfec-tions for the potential development of effective T cell-based vaccines. Our analysis provides new ways to think about a causative role of CD8ⴙT cells by studying different hypotheses regarding why polyfunctional CD8ⴙT cells might be more advantageous. We identify measurements that have to be obtained in order to evaluate the role of CD8ⴙT cells in HIV-1 infection. In addition, our method shows how individual cell functionality data can be used in population-based virus dynamics models.
C
D8⫹T lymphocytes are immune cells essential for the control or even eradication of viral infections (1,2). After being acti-vated, CD8⫹T cells are able to recognize and kill infected cells. Besides their cytotoxicity, activated CD8⫹T cells release a large number of cytokines, which either affect the dynamics of the im-mune response (e.g., interleukin-2 [IL-2] and tumor necrosis fac-tor alpha [TNF-␣]) or interfere with the viral pathogen itself (e.g., gamma interferon [IFN-␥] and macrophage inflammatory pro-tein 1[MIP-1]/RANTES) (3,4). The absence of CD8⫹T cells may lead to the inability of the organism to control infection, as has been observed for lymphocytic choriomeningitis virus (LCMV) in mice and simian immunodeficiency virus (SIV) in monkeys (5,6).The role of CD8⫹T cells in infection by human immunodefi-ciency virus type 1 (HIV-1) has not been determined so far (7). Although infected individuals are observed to exhibit high levels of HIV-specific CD8⫹T cells (8–10), this response is not able to eradicate the virus. After a period of acute infection (⬃3 to 4 months after infection), high plasma viral loads (pVL) can persist for several years even in the presence of high levels of HIV-1-specific CD8⫹T cells. In addition, the failure of HIV-1 vaccine trials based on the elicitation of strong cellular immune responses (11) questioned the importance of CD8⫹T cells in HIV-1 infec-tion despite previous observainfec-tions of their influence on viral con-trol in HIV-1 (1,2) and SIV (5,6).
The lack of a definitive mechanism by which CD8⫹T cells might control HIV-1 infection hinders the evaluation of the role of this cell type. A correlate of protection by CD8⫹T cells against HIV-1 has not been determined so far: no single frequency of HIV-specific CD8⫹T cells showing a certain functionality corre-lates with protection or viral control (7). However, it has been observed that the overall quality of HIV-1-specific CD8⫹T cell responses measured by their polyfunctionality, i.e., the frequency of CD8⫹T cells within the epitope-specific response expressing several effector functions simultaneously, correlates with viral control: Betts et al. (12) showed that HIV nonprogressors, who are HIV-infected patients characterized by stable viremia and CD4⫹ T cell counts during the chronic phase of infection, have
signifi-Received7 March 2014Accepted16 June 2014
Published ahead of print25 June 2014
Editor:G. Silvestri
Address correspondence to Frederik Graw, [email protected].
Supplemental material for this article may be found athttp://dx.doi.org/10.1128 /JVI.00647-14.
Copyright © 2014, American Society for Microbiology. All Rights Reserved.
doi:10.1128/JVI.00647-14
on November 7, 2019 by guest
http://jvi.asm.org/
cantly more polyfunctional CD8⫹T cells than do HIV progres-sors, who more rapidly progress to AIDS. The frequency of poly-functional epitope-specific CD8⫹T cells was inversely correlated with the viral load (12). Several other studies addressed the poly-functionality of HIV-specific CD8⫹T cell responses and analyzed their impact on disease progression (for a review, see references13 and14).
Although the current prevailing assumption in the field is the more polyfunctional CD8⫹T cells, the better viral control, it has not yet been determined if the increased frequency of polyfunc-tional CD8⫹T cells is the cause for or the consequence of en-hanced viral control. Better viral control in animal models of chronic infection after restoring dysfunctional CD8⫹T cell re-sponses, as observed for LCMV (15) and SIV (16), argues for a causative role of dysfunctional CD8⫹T cells in disease progres-sion. In contrast, increased frequencies of polyfunctional CD8⫹T cells were observed after antiretroviral treatment (17), while their initial frequency had no impact on the clinical outcome (18). Hence, the role of CD8⫹T cells in HIV-1 infection still remains elusive with the current experimental and clinical knowledge.
Even if we assume that a more polyfunctional CD8⫹T cell response is the cause of better viral control, there are still concep-tual issues to be resolved. We can think of three different reasons why a more polyfunctional response would lead to better viral control than a less polyfunctional one with a comparable response size. (i) A higher frequency of polyfunctional CD8⫹T cells within the HIV-1-specific response indicates a stronger HIV-specific T cell response, as more CD8⫹T cells are capable of performing several functionalities, increasing the total number of functions expressed by the population. Thus, polyfunctionality would sim-ply correlate with strength. (ii) A higher frequency of polyfunc-tional CD8⫹T cells may also indicate a more functionally diverse CD8⫹T cell response, as many different functions are expressed, which could synergize in their inhibitory effect on viral replica-tion. (iii) A higher frequency of polyfunctional CD8⫹T cells also means that there is a higher frequency of CD8⫹T cells mediating a particular function, and this effector function could be essential for controlling viral replication. In short, it is not yet clear if (i) the strength, (ii) the functional diversity, or (iii) a specific function mainly determines disease progression. Separating the effects of each of these three different factors on the CD4⫹T cell count and plasma viral load will help to reveal how HIV infection is con-trolled by the CD8⫹T cell response and how a dysfunctional CD8⫹T cell response should best be modulated to enhance the outcome of infection.
To evaluate the role of polyfunctionality, we extended a viral dynamics model reported previously (19), analyzing the effects of cytolytic and different noncytolytic effector functions of CD8⫹T cells on viral control and immunopathology in HIV-1 infection. In our model, we explicitly consider three different effector func-tions of the CD8⫹T cell response that directly affect the viral pathogen: (i) cytotoxicity as mediated, e.g., by perforin and gran-zyme; (ii) inhibition of viral entry, e.g., mediated by MIP-1/ RANTES, which is observed to compete with HIV-1 for binding sites on the CCR5 chemokine receptor expressed by CD4⫹T cells (20,21); and (iii) inhibition of viral replication in infected cells, as, e.g., has been suggested to be mediated by IFN-␥(22,23) or the CD8⫹T cell anti-HIV factor (CAF) (24–26), which has not yet been identified (27). Based onin vitroexperimental data, we quan-tified the inhibition of HIV-1 infectivity and viral replication by
MIP-1/RANTES (28) and IFN-␥(23), respectively. We use these specific factors as surrogates for molecules mediating such func-tions, as there are uncertainties about their antiviral efficacy (see Discussion).
In our model, disease outcome is related to the level of poly-functionality, as has been observed experimentally (12). By ma-nipulating the strength, polyfunctionality, and individual func-tions separately, we find that the strength of the CD8⫹T cell response measured by the average number of different effector functions per CD8⫹T cell is the best predictor of disease progres-sion. In contrast, the functional diversity of the response has only a minor influence. By investigating the influence of particular ef-fector functions, we found that CD8⫹T cell responses with dom-inant nonlytic effector functions showed a better improvement in CD4⫹T cell counts and plasma viral loads than more lytic re-sponses, assuming reasonable levels of cytotoxicity. Particularly, effector functions inhibiting viral replication are predicted to have the most beneficial impact when trying to improve dysfunctional CD8⫹ T cell responses by immunomodulatory interventions. Thus, individuals with an increased frequency of polyfunctional CD8⫹T cells are most likely to show better viral control because of their stronger immune responses rather than an increased func-tional diversity of the response.
MATERIALS AND METHODS
Mathematical model.We extended a previously reported model for viral dynamics (19,29) incorporating the different functions of the CD8⫹T cell response during chronic HIV-1 infection: the general model assumes that susceptible CD4⫹T cells,T, are constantly produced at a rate,; die with a natural death rate unrelated to the CD8⫹T cell response of␦T; and
become productively infected,I, by an infection rate,, based on the density of free viral particles perl of blood,V. Virions are produced with rateper productively infected cell and have an average lifetime of 1/c. The parameter␦Idenotes the natural death rate of productively infected
cells.
As an extension of the general model, we incorporated the different immune effector functions mediated by the CD8⫹T cell response. As we are modeling viral dynamics during the chronic phase of HIV infection, we assume the number of HIV-1-specific CD8⫹T cells,E, to be constant. The implication of this assumption is discussed in detail below. The frac-tions of the CD8⫹T cell population releasing cytokines that impair viral entry (MIP-1/RANTES) and viral replication (e.g., IFN-␥/CAF) and the fraction that is capable of killing infected cells are denotedfe,fr, andfk,
respectively. With this parameterization, infected cells are killed at the rate
kfkE, wherekdenotes the killing rate (30). Based on a previous study by
Cocchi et al. (28), we assume that the concentration of MIP-1/RANTES reduces the efficacy of the infection rate,, in a dose-dependent manner with an efficacy ofe⫽femE/(femE⫹M1/2). Here, the parameterm de-fines the level of cytokine production per CD8⫹T cell, whileM1/2denotes the concentration of MIP-1/RANTES where the impairment of infectiv-ity is half of the maximum. Analogously, IFN-␥is assumed to impair viral replication (23), i.e., the production rate of viral particles,, by a factor of 1⫺ r, wherer⫽fr␥E/(fr␥E⫹G1/2). The parameter␥defines the level of production of IFN-␥per CD8⫹T cell, whileG1/2denotes the concentra-tion of IFN-␥where the impairment of viral replication is half of the maximum. The full system is then formulated by
dT
dt ⫽ ⫺ ␦TT⫺ 
冉
1⫺ mfeE mfeE⫹M1⁄2冊
VT
dI
dt⫽ 
冉
1⫺ mfeE mfeE⫹M1⁄2冊
VT⫺ ␦II⫺kfkEI (1)
dV dt ⫽
冉
1⫺␥frE
␥frE⫹G1⁄2
冊
I⫺cV
CD8⫹T Cell Quality and HIV
on November 7, 2019 by guest
http://jvi.asm.org/
The total density of CD4⫹T cells per mm3of blood at equilibrium,
Nⴱ⫽Tⴱ⫹Iⴱ, is then defined by
Nⴱ⫽
␦I⫹kfkE⫹
c
共
␦I⫹kfkE⫺ ␦T兲
共
1⫺ r兲
共
1⫺ e兲
(2)
The plasma viral load in virions perl of blood at equilibrium, with one virion representing two HIV-1 RNA copies, is calculated by
Vⴱ⫽
共
1⫺ r兲
c共
␦I⫹kfkE兲
⫺␦T

共
1⫺ e兲
(3)
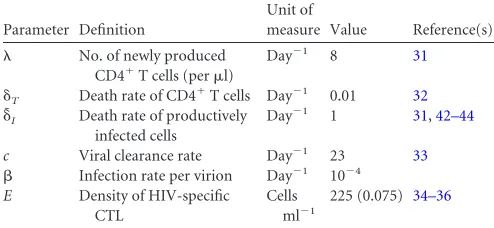
Parameterization.The majority of model parameters in equation 1 is defined by values from the literature (Table 1): we assume that the num-ber of new CD4⫹T cells per mm3introduced into the blood per day,, is 8 day⫺1(31) and that uninfected cells die by a natural death rate,␦
T, of
0.01 day⫺1(32). The average rate of production of virions by infected cells,, is assumed to be 1,000 day⫺1, and virions have an average lifetime, 1/c, of 1/23 days (33). The parameters defining the effector functions of the CD8⫹T cell response are determined as described below.
CD8ⴙT cells (E).The frequency (or density) of HIV-specific CD8⫹T cells,E, is parameterized based on the CD4/CD8 ratio observed in HIV-infected individuals (34–36). The ratio of CD4⫹to CD8⫹T cells before the AIDS phase is of the order of 1.1 to 1.2 (34). Values of⬍1 usually indicate the beginning of the AIDS phase. Around 0.5 to 22% of CD8⫹T cells are HIV specific (35), meaning that the frequency of HIV-specific CD8⫹T cells among all lymphocytes is between 0.17⫻10⫺2and 7.5⫻ 10⫺2, assuming that 40% of all lymphocytes are CD4⫹T cells (36). Taking the maximum frequency of 0.075, the number of HIV-specific CD8⫹T cells per mm3of blood,E, is roughly 225 cells.
For HIV infection, the observed numbers of CD4⫹and CD8⫹T cell populations are based on blood samples, while the actual infection and immune processes preferentially occur in lymphatic organs such as lymph nodes and the spleen. There, cell densities are much higher, allowing for close contacts between cells. In order to account for the difference in cell densities between blood and lymphoid organs, we have to introduce a scaling factor,, that scales the CD8⫹T cell response,E. The parameter is defined as follows. Trepel (37) reported that roughly 2 to 3% of all lymphocytes are in the blood, while the spleen comprises 12 to 20%. Assuming a total blood volume of 5 liters and the average volume of a human spleen to be⬃200 ml (38), the density of lymphocytes in the spleen is 100 to 250 times higher than that in the blood; hence,is⬃100 to 250. However, it is also observed that the CD4/CD8 ratio in lymphatic organs is roughly 2 to 3 times higher than that in the blood (39). Because the frequencies of HIV-specific CD8⫹T cells among lymphocytes are comparable between blood and lymphatic organs (40), we assume that the effective CD8⫹T cell density is given byEwithbetween⬃30 and 125. Below, we use avalue of 75, roughly the middle of the estimated interval for. The sensitivity of the results with regard to the value ofwas analyzed.
HIV-suppressing factors (MIP-1/RANTES).Usingin vitrocultures of HIV-1-infected cells, Cocchi et al. (28) found a dose-dependent inhi-bition of infection by HIV-suppressing factors (HIV-SF) such as MIP-1␣, MIP-1, and RANTES. Mathematically, we can describe this inhibiting effect on viral entry,e, as a function of the concentration of HIV-SF,M,
bye(M)⫽M/(M⫹M1/2), with M1/2denoting the concentration at which the inhibiting effect is half of the maximum. Based on available data,M1/2is determined to be 5 ng/ml. The concentration of HIV-SF given 106activated CD8⫹T cells per ml varies between 6 and 235 ng/ml (see Table 1 in reference28); hence, the concentration per CD8⫹T cell,m, is approximately 6⫻10⫺6to 2.35⫻10⫺4ng.
Effect of IFN-␥on viral production ().Already in 1986, Walker et al. (25) found a dose-response relationship between the number of CD8⫹T cells and the reverse transcriptase (RT) activity in HIV-infected cells that was not attributable to cytotoxic T lymphocyte (CTL)-mediated killing of HIV-infected cells. Studying the effect of IFN-␥on HIV-infected cells, Hammer et al. (23) found that roughly 100 units of IFN-␥(⬃6.25⫻ 103pg) on 2⫻105cells per ml led to a 50% reduction in RT activity. The level of production of IFN-␥per CD8⫹T cell is about 0.5 pg (41). With these values, we parameterized the effect of IFN-␥on the viral production rate,, with aG1/2of 6.25⫻103pg/ml and a␥of 0.5 pg.
Killing rate constant (k).Productively infected cells have an estimated lifespan of about 1 day (31,42–44). This estimate includes the natural death rate of infected cells,␦I, and the loss of infected cells due to CD8⫹T
cell-mediated killing. Therefore, the decay rate of productively infected cells is defined as␦˜I⫽ ␦I⫹kE⫽1 day⫺1. As␦Ialso comprises the natural
death rate of target cells,␦T, we always ensured that␦Iwasⱖ␦T. Asquith et
al. (45) estimated that HIV-specific CTL lysis is responsible for around 10% to 20% of the observed decay in the number of infected cells. Using the upper limit withkE⫽0.2␦˜Iand the density of CD8⫹T cells given by an Evalue of 0.075, we obtain akvalue of 2.7 day⫺1, comparable to previous estimates found for HIV (45) and human T cell lymphotropic virus (HTLV) (46).
Production rate of new virions ().The number of viral particles produced by one infected cell in HIV or SIV infection is still debated. Experimentally obtained estimates vary quite substantially, from 100 (47) to 700 to 1,800 (48) and up to the order of 20,000 to 50,000 virions produced by one infected cell per day (49). Using different values for the viral production rate,, in equations 2 and 3, we found that reasonable CD4⫹T cell counts and plasma viral loads for HIV progressors and non-progressors are obtained when using viral production rates on the order of 1,000 virions per cell per day (see Fig. S1 in the supplemental material). Here, the outcome of the model was compared to the observed CD4⫹T cell count and plasma viral load in patients belonging to specific sub-groups (Table 2) (12). Below, we use a viral production rate () of 1,000 virions per cell per day.
Assessing the correlation of expression of specific functionalities. To examine if effector functions are expressed independently, we analyzed data reported previously by Betts et al. (12), who measured the expres-sions of 5 different functions for each of 5 different HIV epitopes. If two functionalities,aandb, are independent of each other, then the measured frequency of CD8⫹T cells expressing both functions, fab, should be
[image:3.585.39.286.80.194.2]the product of the frequencies of CD8⫹T cells expressing one effector function or the other; hence,fab⫽fa⫻fb. The difference expressed as⌬ ⫽ TABLE 1Parameters used for simulation of the model in equation 1a
Parameter Definition
Unit of
measure Value Reference(s)
No. of newly produced
CD4⫹T cells (perl)
Day⫺1 8 31
␦T Death rate of CD4⫹T cells Day⫺
1 0.01 32
␦ ˜
I Death rate of productively
infected cells
Day⫺1 1 31,42–44
c Viral clearance rate Day⫺1 23 33
 Infection rate per virion Day⫺1 10⫺4 E Density of HIV-specific
CTL
Cells ml⫺1
225 (0.075) 34–36
aThe different parameters for simulation of HIV-1 dynamics during the chronic phase
of infection were obtained from the indicated references. The number in brackets represents the frequency of HIV-specific CTL.
TABLE 2Median CD4⫹T cell counts and plasma viral loads for HIV progressors and nonprogressorsa
Subgroup
No. of individuals
CD4⫹T cell count (cells mm⫺3) (10th, 90th percentiles)
Plasma viral load (RNA copiesl⫺1) (10th, 90th percentiles)
Progressors 79 522.5 (209.7, 863.0) 21.0 (0.34, 132.32) Nonprogressors 9 972.0 (690.2, 1,682.0) 0.03 (0.02, 0.04)
a
Based on data reported in Table 1 in reference12.
on November 7, 2019 by guest
http://jvi.asm.org/
[image:3.585.296.544.88.154.2]fab⫺(fa⫻fb) indicates how far the expected and measured frequencies of
double-positive cells are from each other. Because of the definition offa
andfbwithfabⱕfaandfabⱕfb, for large values offaandfb,fabwould have
fewer possible values than for small values of the two individual frequen-cies. Therefore, we have to scale the difference,⌬, by the possible ranges forfabgivenfaandfbin order to analyze if⌬is significantly different from
0 and, thus, would indicate a correlative expression of both effector func-tions. The maximal observable frequency of double-positive cells, corre-sponding to the maximal overlap of fa and fb, is given by fabmax ⫽
min{fa,fb}. The minimal observable frequency is given by fabmin ⫽
max{0,max{fa,fb}⫺(1⫺min{fa,fb})} (see Fig. S2 in the supplemental
material). With this, we obtain a scaled difference of⌬, named⌬˜ , by
⌬
˜⫽ ⌬
fabmax⫺fabmin⫽
fab⫺
共
fa⫻fb兲
fabmax⫺fabmin(4)
In general, forndifferent effector functions with individual frequen-cies,fi,i⫽1, . . .,n, the possible, observable frequency of polyfunctional T
cells,Pn⫹, is in the range between the minimum of all individual frequen-cies, mini{fi}, and max{0,冱ifi⫺n⫹1}.
RESULTS
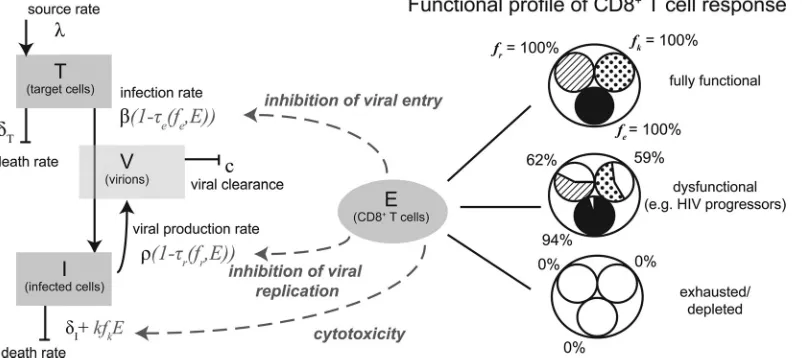
Mathematical model.To study the influence of the functional composition of CD8⫹T cells on HIV-1 disease progression, we extended a mathematical model that was developed to investigate the impact of different levels of CD8⫹T cells on disease progres-sion (19). The model describes the dynamics of uninfected cells, infected cells, and the plasma viral load (pVL) within a host. We specifically account for the effects of three different CD8⫹T cell effector functions: (i) cytotoxicity; (ii) inhibition of infection, i.e., viral entry; and (iii) impairment of viral replication (Fig. 1). For each of the three different effector functions, we parameterized the effect of the chemokine/cytokine per CD8⫹T cell based on previously reported estimates and experimental data for HIV-1in vitroculture systems, using IFN-␥and MIP-1as surrogates for the inhibition of viral replication and viral entry, respectively (23, 28,45) (for a detailed description of the mathematical model and the parameterization, see Materials and Methods). With the pa-rameters used, between 0.4 and 4% of the CD4⫹T cells are
in-fected. These numbers are in agreement with the previously ob-served frequency of infected CD4⫹ T cells in HIV-infected individuals (50).
The functionality of the CD8⫹T cell response is defined by the frequencies of CD8⫹T cells that are able to mediate one of the particular effector functions, withfe,fk, andfrdenoting the
fre-quencies of functional CD8⫹T cells that block viral entry, are cytotoxic, and impair viral replication, respectively. Using a fixed number of CD8⫹T cells, we are able to create different responses with various degrees of polyfunctionality by varying the values of fe,fk, andfr(see below). Examining 79 HIV-1 progressors, Betts et
al. (12) showed that their HIV-specific CD8⫹T cell response is impaired, with only fractions of the total response being capable of mediating a specific effector function (see Fig. 1B in reference12). Based on those observations across different HIV-specific epitopes, we set the average frequencies of the particular function-alities for CD8⫹T cell responses in HIV progressors to anfevalue
of 0.94, anfkvalue of 0.59, and anfrvalue of 0.62 (Table 3).
Influence of strength and functional diversity of the CD8ⴙT cell response on disease outcome.To analyze the effect of the
FIG 1Model of viral and immune dynamics considering target cells (T), infected cells (I), virions (V), and CD8⫹T cells (E). The functional profile of the CD8⫹ T cell response is denoted by the frequencies of CD8⫹T cells capable of (i) inhibiting viral entry (fe), (ii) impairing viral replication (fr), and killing infected cells
(fk). In a fully functional CD8⫹T cell response, all CD8⫹T cells would express all different effector functions considered. With a dysfunctional profile, not all
effector functions are expressed by all CD8⫹T cells. The functional profile of the CD8⫹T cell response influences the infection rate (), the viral production rate (), or the death rate of infected cells by the additional killing termkfkE, respectively, as schematically indicated. A detailed description of the model and the
[image:4.585.97.498.70.249.2]individual parameters is given in Materials and Methods.
TABLE 3Frequencies of HIV-specific CD8⫹T cell responses with particular functionalities among 79 HIV-1 progressors for different HIV epitopesa
Epitope
Median CD107a
fk(%) (25%,
75% quantiles)
Median MIP-1
fe(%) (25%,
75% quantiles)
Median IFN-␥
fr(%) (25%,
75% quantiles)
Gag 71.8 (50.0, 86.5) 94.7 (87.6, 98.3) 67.6 (50.5, 88.9) Pol 62.4 (40.0, 85.3) 95.3 (88.2, 98.9) 69.4 (46.4, 88.3) Env 46.5 (15.2, 84.7) 93.5 (67.0, 99.5) 50.6 (20.0, 92.4) Nef 60.0 (31.7, 83.6) 94.1 (82.3, 99.5) 71.2 (42.9, 92.4) TRVVV 55.9 (20.0, 84.7) 90.0 (76.4, 99.5) 50.6 (28.2, 90.0)
Mean 59 94 62
a
The median values as well as the 25% and 75% quantiles were taken from data in Fig. 1B in reference12.
CD8⫹T Cell Quality and HIV
on November 7, 2019 by guest
http://jvi.asm.org/
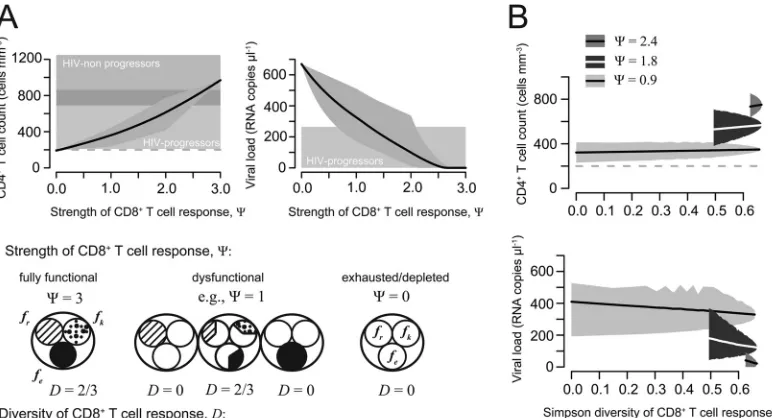
[image:4.585.299.545.601.705.2]strength of the HIV-specific CD8⫹T cell response on disease pro-gression, we defined the parameter⌿as the number of effector functions that a single CD8⫹T cell would have on average by
⌿:⫽ ⌿
共
fe,fk,fr兲
⫽ 兺 i僆兵e,k,r其fi (5)
A CD8⫹T cell response with a⌿value of 3 corresponds to a fully functional immune response; i.e., each CD8⫹T cell is able to mediate each effector function. A completely dysfunctional or depleted CD8⫹ T cell response is characterized by a⌿value of 0 (Fig. 2).
We calculated the CD4⫹T cell count and the pVL at equilib-rium based on equations 2 and 3, using CD8⫹T cell responses varying in their functional compositions.Figure 2A shows the mean, maximal, and minimal values for each of these outcome variables dependent on the strength of the CD8⫹T cell response, ⌿. The mean CD4⫹ T cell count increases with increasing strength, while the plasma viral load decreases. Variation in the mean CD4⫹T cell count over⌿ranges from⬃190 cells mm⫺3at a⌿value of 0 to⬃1,000 cells mm⫺3, while the mean plasma viral load varies between 0 and⬃670 viral RNA copiesl⫺1. For a⌿ value of⬍0.5, the mean CD4⫹T cell count is close to 200 cells mm⫺3, the threshold defining the AIDS phase of infection. A⌿ value of ⬎2, as also observed for HIV progressors (⌿HIV-p ⫽ 2.15), generally leads to CD4⫹T cell counts that are⬎400 cells mm⫺3and plasma viral loads with on average 23 RNA copiesl⫺1 given our parameterization of the model (Fig. 2A).
The parameter⌿is a measure of the strength rather than the functional diversity of the CD8⫹T cell response. A⌿value of 1 could mean (fe,fk,fr)⫽(1, 0, 0) or (fe,fk,fr)⫽(1/3, 1/3, 1/3) (Fig. 2), two CD8⫹T cell responses with probably different effects on the CD4⫹T cell count and plasma viral load. In order to investi-gate the influence of the functional diversity of the CD8⫹T cell response on disease progression, we calculated the Simpson index,
D, as it is defined in ecology to calculate the biodiversity in a certain area (51):
D⫽1⫺ 兺
i僆兵e,r,k其
冉
fi⌺
i僆兵e,r,k其fi
冊
2
(6)
ADvalue of 0 means no diversity, and only one particular function is mediated by the CD8⫹T cell response. In our situa-tion, the diversity can reachDvalues of between 0 and 2/3, with a Dvalue of 2/3 indicating the maximal degree of diversity that is reached if the frequencies of CD8⫹T cells expressing the particu-lar effector functions are the same; i.e.,fe⫽fr⫽fk.Figure 2Bshows
the effect of increasing functional diversity on the CD4⫹T cell count and plasma viral load for three different subsets of CD8⫹T cell responses with a predefined strength,⌿, of 0.9, 1.8, and 2.4, respectively. Stronger CD8⫹T cell responses are also character-ized by a higher level of diversity. However, among all CD8⫹T cell responses with a certain strength,⌿, the influence of increasing diversity on the CD4⫹T cell count and the plasma viral load is only minor. Within these groups, the mean CD4⫹T cell count increases by approximately less than one-third of its starting value (⬃100 cells mm⫺3) with increasing diversity, while the mean plasma viral load decreases to one-third and down to one-half of its starting value (⬃20 to 100 HIV-1 RNA copiesl⫺1). Thus, the strength of the CD8⫹T cell response has a stronger effect than the functional diversity of the response on viral control and disease outcome.
Strength, diversity, and polyfunctionality.In clinical studies, the polyfunctionality of a CD8⫹T cell response is defined as the fraction of pathogen-specific cells that express multiple functional markers simultaneously (7). How is this definition related to the frequenciesfe,fk, andfr, which characterize the functionality of
responses in our virus dynamics model?
FIG 2Strength and diversity of the CD8⫹T cell response. (A) CD4⫹T cell count and plasma viral load dependent on the strength of the CD8⫹T cell response. The gray-shaded areas indicate the minimum and maximum of all calculated values with the corresponding strength (⌿); the solid line denotes the mean. The horizontally shaded areas indicate the CD4⫹T cell count and plasma viral load, as measured for HIV progressors (light gray) and nonprogressors (dark gray) (Table 2). (B) Relationship between the functional diversity of the CD8⫹T cell response measured by the Simpson index (D) for the CD4⫹T cell count and plasma viral load. All possible combinations of three different⌿values, 0.9, 1.8, and 2.4, were analyzed separately. Lines denote the mean CD4⫹T cell count and plasma viral load, while shaded areas indicate the minimum and maximum of all calculated values with the corresponding diversity index,D.
on November 7, 2019 by guest
http://jvi.asm.org/
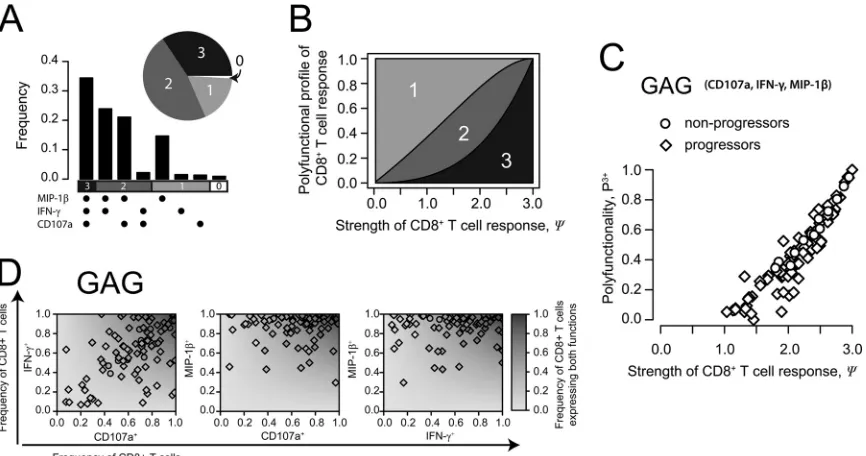
[image:5.585.96.482.66.275.2]Assuming that all three effector functions are expressed inde-pendently, we can calculate the expected frequency of polyfunc-tional CD8⫹T cells,P3⫹, for a particular CD8⫹T cell response based on our population dynamics model byP3⫹⫽f
efkfr.
Simi-larly, the fraction of CD8⫹T cells that can perform two functions is given byP2⫹⫽(1⫺f
e)fkfr⫹fe(1⫺fk)fr⫹fefk(1⫺fr). The
expected functionality profile of the CD8⫹T cell response in HIV progressors based on the average functional frequencies (Table 3) is shown inFig. 3A.
How is the conventional measure of polyfunctionality, i.e., P3⫹, related to our concepts of strength and diversity? For a given strength of response,⌿, the expected frequency of polyfunctional T cells,P3⫹, is highest when all the functional frequencies are equal:fe⫽fk⫽fr. In this situation, the response is also maximally
diverse. In general, the polyfunctionality of a CD8⫹ T cell re-sponse increases with the increasing strength of the rere-sponse, as expected by the definition of strength, i.e., denoting the average number of effector functions per CD8⫹T cell (Fig. 3B). However, there is no linear relationship between these two quantities defined by P3⫹⫽f
efkfrand⌿ ⫽fe⫹fk⫹fr, respectively. By comparing the
performances of the conventional measure of polyfunctionality, the strength, and the diversity in predicting disease progression, we find that the strength of the response is a slightly better predictor of disease progression (for CD4,R2⫽0.9; for pVL,R2⫽ ⫺0.84 [by Pearson correlation]) than the conventional measure of polyfunctionality (for CD4,R2⫽0.83; for pVL,R2⫽ ⫺0.69), while diversity has the least predictive power (for CD4,R2⫽0.52; for pVL,R2⫽ ⫺0.53).
Based on data reported previously by Betts et al. (12) charac-terizing the functional profiles of CD8⫹T cell responses in HIV
progressors and nonprogressors, we examined if the particular effector functions are expressed independently. Betts et al. mea-sured the expressions of 5 different functions, IL-2, TNF-␣, IFN-␥, MIP-1, and the degranulation marker CD107a, for 5 dif-ferent HIV epitopes and epitope combinations:env,pol,gag,nef, andtrvvv(12). If two functionalities,aandb, are independent of each other, then the measured frequency of CD8⫹T cells express-ing both functions,fab, should be the product of the frequencies of
CD8⫹T cells expressing one effector function or the other; hence, fab⫽fa⫻fb.Figure 3Cshows the measured frequencies of CD8⫹
T cells positive for one or two markers for each different combi-nation of CD107a, IFN-␥, and MIP-1exemplarily for thegag epitope for each patient described previously (12). By analyzing⌬ ⫽fab⫺(fa⫻fb) scaled for the range of possible frequencies forfab
(see Materials and Methods), our data indicate that we cannot generally reject the null hypothesis that the different functional-ities are expressed independently (Pvalue of⬎0.05 by Mann-Whitney U test) (see Table S1 and Fig. S2 and S4 in the supplemental material). However, for cells expressing three or more functions si-multaneously, our analysis shows that the individual functions pos-itively affect each other (P⬍0.05) throughout all epitopes. This does not hold for combinations including IL-2. In general, we find that on average, the expression level of triple-functional CD8⫹T cells is higher than expected based on the individual frequencies of CD8⫹T cells specific for one functionality (⌬˜⬎0). This indicates a correlative expression of specific effector functions of CD8⫹T cells, as observed previously (12,52,53).
Influence of particular effector functions on disease out-come.InFig. 2A, we show that the CD4⫹T cell count and plasma
FIG 3Strength and polyfunctionality of the CD8⫹T cell response. (A) Estimated functionality profile of the CD8⫹T cell response for HIV progressors in terms of multifunctionality of single cells based on the measured frequency of individual effector functions, with anfevalue of 0.94, anfkvalue of 0.59, and anfrvalue
of 0.62. (B) Relationship between the strength of the CD8⫹T cell response and the multifunctional profile assuming maximal diversity of the response; i.e.,fe⫽
fk⫽fr. (C) Relationship of the strength and the polyfunctionality of the CD8⫹T cell response for each patient described previously (12) shown exemplarily for
thegagepitope considering three (CD107a, IFN-␥, and MIP-1) of the five measured effector functions. (D) For each patient described previously (12), the frequency of CD8⫹T cells expressing two of the three functions indicated by CD107a, IFN-␥, and MIP-1(fab) is plotted against the total frequencies of CD8⫹
T cells expressing the corresponding specific function, i.e.,faandfb. The gray shaded background indicates the profile of the expected frequency of combined
expression under the assumption that the particular effector functions are expressed independently (E[fab]⫽fa⫻fb). Observations are shown exemplarily for the
gagepitope.
CD8⫹T Cell Quality and HIV
on November 7, 2019 by guest
http://jvi.asm.org/
[image:6.585.77.510.66.294.2]viral load still vary substantially for intermediate strengths of the CD8⫹T cell response. The variation is not explained by various diversities of the responses (Fig. 2B), leading to the question of whether some effector functions might be more effective than others in controlling disease progression.
To disentangle the impact of particular functionalities from the strength and functional diversity of the response, we analyzed all CD8⫹T cell responses with a predefined functional diversity, D, and strength,⌿.
InFig. 4, we show exemplarily for a CD8⫹T cell response with a frequency ratio of 2:1:1 between the three different effector func-tions and changing dominant effector funcfunc-tions how the CD4⫹T cell count and plasma viral load are impacted. CD8⫹T cell re-sponses with a dominant nonlytic response (Fig. 4AandB) show better maintenance of CD4⫹T cell counts and better viral control than responses with dominant cytotoxicity (Fig. 4C), irrespective of the⌿value. Inhibition of viral replication suppresses the viral load more efficiently than inhibition of viral entry. These obser-vations are in agreement with previous findings for HIV and SIV
infection showing that nonlytic effector functions are more im-portant for viral control than lytic responses (45, 54–57). The observed hierarchy in effector functions can also be seen when looking at the impacts of different compositions of a CD8⫹T cell response (with⌿ ⫽1) on the CD4⫹T cell count and plasma viral load (Fig. 4DandE). A response skewed toward nonlytic effector functions, especially where the inhibition of viral replication is the dominant effector function, would maintain a higher CD4⫹T cell count than CD8⫹T cell responses with dominant cytotoxicity. Responses dominated by lytic effector functions are advantageous if⬎80% of the death of infected cells is assumed to be due to cytotoxicity, assuming higher killing rates (k,⬃10.6 day⫺1) than those estimated previously (45).
Optimizing immunomodulatory interventions.Therapeutic approaches involving the restoration of CD8⫹T cell function dur-ing chronic infections are bedur-ing explored (15,16). Drugs that in-crease specific effector functions in chronic HIV infection could be available in the future. This prospect leads to the question of which effector function constitutes the most promising target.
FIG 4Influence of particular effector functions on CD4⫹T cell count and plasma viral load. For the example of a CD8⫹T cell response with a frequency ratio of 2:1:1 between the three different effector functions, and corrected for different strengths of the CD8⫹T cell response, we show the influence of particular effector functions on the CD4⫹T cell count and plasma viral load. (A to C) CD8⫹T cell responses with a dominant nonlytic response (A and B) show better maintenance of CD4⫹T cell count and better viral control than those responses with a dominant cytotoxic response (C) irrespective of the⌿value. Inhibition of viral replication suppresses the viral load more efficiently than inhibition of viral entry. (D and E) This hierarchy of effector functions can also be seen when looking at the simplex plots showing the CD4⫹T cell count (D) and the plasma viral load (E) dependent on the composition of a CD8⫹T cell response with a ⌿value of 1. Lighter colors indicate better disease control. The black dot indicates an immune response where each effector function is equally present; hence,
fe⫽fk⫽fr⫽1/3.
on November 7, 2019 by guest
http://jvi.asm.org/
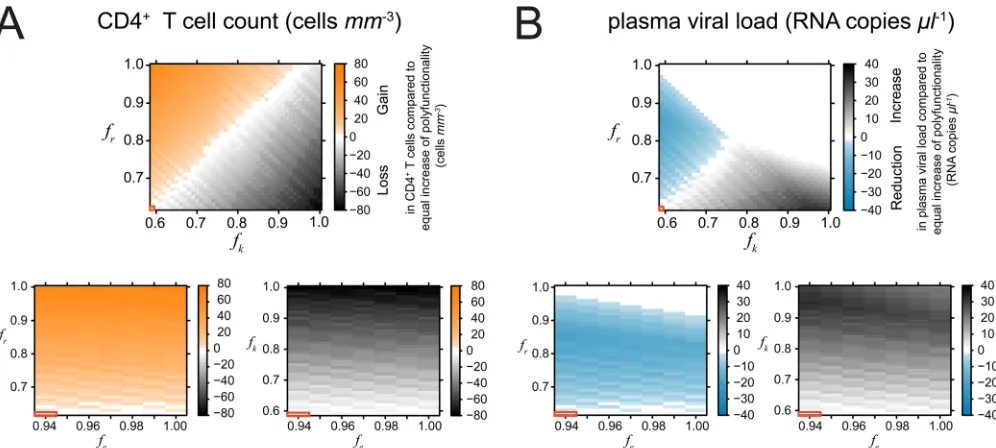
[image:7.585.77.508.65.414.2]To investigate this question, we compared the gain in CD4⫹T cells that our model predicts when we improve one, two, or three effector functions. In all three cases, the improvement was chosen such that the overall strength increased by the same amount. We observed that concentrating on the improvement of nonlytic ef-fector functions for our parameterization would lead to a more substantial improvement in the CD4⫹T cell count and plasma viral load than increasing each effector function equally. Thereby, increasing the inhibition of viral replication leads to a stronger improvement than inhibiting viral entry (Fig. 5). This is also due to the fact that HIV progressors maintain a very high frequency of functional CD8⫹T cells mediating MIP-1/RANTES (Table 3) (12), which can be observed throughout all different HIV epitopes (see Fig. S2 in the supplemental material). Hence, an increase in this specific effector function has only a minor additional effect. Focusing on lytic effector functions would lead to less substantial improvements in CD4⫹T cell counts and plasma viral loads than increasing the strength of the response in general (Fig. 5). How-ever, an increase in the frequency of CD8⫹T cells mediating cy-totoxicity does not increase immunopathology, as indicated by the development of the CD4⫹T cell count (Fig. 4). This finding is in agreement with previous observations made for acute infection (58). In general, each improvement of the functionality of the CD8⫹T cell response improved disease outcome.
DISCUSSION
The more functions CD8⫹T cells can perform in chronically HIV-infected individuals, the lower the virus load and the better the prognosis (7,12). This observed association has led to “the pre-vailing paradigm . . . that the more functions a CD8⫹T-cell per-forms, the more antiviral it must be” (7). Adopting this paradigm, we developed a virus dynamics model describing the relationship
between the polyfunctionality of CD8⫹ T cell responses, virus load, and disease.
Our virus dynamics model allowed us to dissect and quantita-tively investigate the relationship between polyfunctionality and viral control. In particular, we posed the following questions. Is it that in polyfunctional responses, one simply has a higher fraction of functional CD8⫹T cells? Or is it important to mount a func-tionally broad response to optimally control virus replication? Or is there a key function that is more prevalent in more functional responses?
Answering these questions empirically would require a large cohort of HIV-1-infected individuals. For the individuals of such a cohort, one would have to determine the functional composi-tion of the CD8⫹T cell response (corresponding to the frequen-cies in our model) in addition to the virus load and disease pro-gression, as was done for the 88 individuals enrolled in the study by Betts et al. (12). The cohort would have to be large enough such that it contains sizable subgroups of individuals with each func-tion present at different levels. The virus load and disease progres-sion in these subgroups would then have to be correlated with their functional composition.
Because such a large cohort is not yet available, we took a com-putational approach that incorporates empirical information on the effect of CD8⫹T cells on virus replication. To disentangle the effects of the strength and functional diversity of CD8⫹T cells on HIV-1 disease progression, we extended a theoretical model on viral dynamics described previously (19). Our model explicitly considers three specific functionalities of the CD8⫹T cell response that directly interact with the virus and the infected cells and is parameterized according to previously reported estimates (31,33, 42–44) andin vitroexperimental observations (23,28). We as-sume a constant number of CD8⫹T cells, as this allows us to
FIG 5(A) Additional gain (orange) or loss (gray scaling) in the CD4⫹T cell count by increasing the frequencies of particular effector functions compared to a situation where the same increase in the strength of the response is equally distributed among all three different effector functions. Positive values indicate that concentrating on this particular effector function would be more beneficial than increasing the polyfunctionality for each effector function equally. White areas indicate no difference. The red framed box indicates the functionality of the CD8⫹T cell response observed for HIV progressors (Table 3) with anfevalue of 0.94,
anfrvalue of 0.62, and anfkvalue of 0.59. (B) Corresponding plots for the effect on plasma viral load, with blue indicating a more substantial reduction of the viral
load by focusing on the frequency of this particular effector function when increasing the strength of the CD8⫹T cell response.
CD8⫹T Cell Quality and HIV
on November 7, 2019 by guest
http://jvi.asm.org/
[image:8.585.44.542.65.289.2]determine the effects of different levels of polyfunctionality on the CD4⫹T cell count and pVL at steady state. Furthermore, the ac-tual size of the CD8⫹T cell response is not critical for our quali-tative analysis of the importance of strength, functional diversity, and specific functions in disease outcome.
In agreement with the previous study by Betts et al. (12), our virus dynamics model showed that increased polyfunctionality correlates with the CD4⫹T cell count and correlates inversely with the plasma viral load. Hence, we did not find evidence for immu-nopathology caused by the CD8⫹T cell response, as measured by the CD4⫹T cell count. Restoring the functionality of a dysfunc-tional CD8⫹T cell response is predicted to always be beneficial, as observed for acute infections (58).
By changing the functional profile of a CD8⫹T cell response, we found that the strength of the response, i.e., the average num-ber of effector functions that a CD8⫹T cell expresses simultane-ously, has the greatest explanatory power for the inverse correla-tion between the polyfunccorrela-tionality of the immune response and the plasma viral load (Fig. 2). The functional diversity, i.e., the ability of the CD8⫹T cell response to mediate many different effector functions, is of less importance. This finding supports the assumption that, indeed, the increased overall functionality in polyfunctional CD8⫹T cell responses, rather than the functional breadth of the response, is essential for viral control. In general, increases in both lytic and nonlytic responses improve outcomes (59,60).
However, when looking at the abundance of specific functions in more detail, we found that CD8⫹T cell responses with a dom-inant nonlytic response show better maintenance of CD4⫹T cell counts and better viral control than responses with dominant cy-totoxicity (Fig. 4DandE). This hierarchy of effector functions was observed independently of the strength of the response.
Our observation is in line with several other studies suggesting that CD8⫹T cells control HIV infection by mainly nonlytic mech-anisms (45,54–57). The depletion (54,55) or the level (61,62) of virus-specific CD8⫹T cell responses is observed to have a strong effect on total viral loads but does not change the decay rate of infected cells significantly. Recent studies showed evidence that viral replication in rhesus macaques persistently infected with SIV is unlikely to be controlled by cytotoxicity (54,55). In addition, CD8⫹T cells in persistent infections, while losing their effector functions and becoming exhausted, maintain lytic capabilities (63–65) that nevertheless are assumed to be insufficient to allow systematic control of infection. In our model, responses dominant for lytic effector functions would lead to better viral control and CD4⫹T cell maintenance only if we assume that⬎80% of the loss of infected cells is due to cytotoxicity (k,⬃10.6 day⫺1). However, the general qualitative conclusions on the importance of strength and the neglecting influence of functional diversity on disease out-come remain valid.
Using realistic levels of cytotoxicity (45), among the nonlytic responses studied in our model, the inhibition of viral replication leads to lower viral loads and the maintenance of higher CD4⫹T cell counts than the inhibition of viral entry. Besides depending on the relative parameterization of both effector functions, this ob-servation also depends on the assumed viral production rate and turnover of uninfected cells. If the viral production rate is high and uninfected cells have a long half-life, inhibiting viral replication is more effective in reducing viral load, as a larger number of cells would need to be protected from becoming infected (equation 3).
In our model, we used IFN-␥as a surrogate for the effect of a cytokine inhibiting viral replication in infected cells and hindering the production of new diffusing HIV virions, i.e., representing the CD8⫹T cell anti-HIV factor (CAF), which has not yet been iden-tified (24,27). The role of IFN-␥in the response against HIV is still controversial (66–68). While IFN-␣and IFN-, but not IFN-␥, have been observed to inhibit viral replicationin vitroin some studies (69), other studies showed a suppressive effect of IFN-␥on HIV replication in certain cell lines (23,70). Koyanagi et al. (66) observed that the timing of IFN-␥treatment might be important: while treatment with IFN-␥before infection enhanced viral rep-lication, IFN-␥treatment after infection reduced HIV expression. As we are focusing on the steady state of the CD4⫹T cell count in chronic HIV infection, the assumption of an inhibiting effect of IFN-␥on viral replication is reasonable.
Based on our parameterization, our results support the use of noncytolytic cytokines as therapeutic agents against HIV, as is done for other chronic diseases (71). However, while MIP-1 mainly blocks the CCR5 chemokine receptor on CD4⫹T cells, this effector function might be ineffective in individuals who harbor HIV strains that use a coreceptor different from CCR5 (72). MIP-1/RANTES might even mediate the selection pressure forcing this coreceptor switch (73). Immunomodulatory interventions have been found to be successful in persistent infections. Barber et al. (15) showed that blocking the immunoregulatory PD-1 (pro-grammed death 1) receptor on exhausted CD8⫹T cells restores the functionality of these cells and reduces plasma viral load in mice persistently infected with the LCMV clone 13 strain. Those authors suggest that the blocking of this PD-1-inhibitory pathway is a potential therapeutic strategy in chronic infections, as, for example, was done recently for patients chronically infected with hepatitis C virus (74).
Our model neglects dynamic changes in the CD8⫹T cell re-sponse, such as, e.g., the occurrence of CTL escape. As lytic as well as nonlytic responses, if acting locally, can drive CTL escape (73, 75), more polyfunctional responses might also mediate increased selective pressure. Determination of which combination of func-tions would minimize the emergence of escape would be an inter-esting topic for future study but is beyond the scope of the present analysis.
In our model, the strength of the response, defined as the av-erage number of functionalities expressed by an HIV-1-specific CD8⫹T cell, showed a slightly better predictive power than the expected frequency of polyfunctional CD8⫹T cells, as is used in experimental and clinical studies today. However, we do not make any assumptions about the correlative expression of effector func-tions, as we monitored frequencies of cell populations rather than individual cells. When we analyzed the data reported previously by Betts et al. (12), we found that within CD8⫹T cells of HIV-infected patients, the independent expression of both functional-ities by bifunctional CD8⫹T cells cannot be ruled out. For cells expressing three or more functions simultaneously, a correlative expression of the different effector functions was determined, ex-cluding combinations involving IL-2. This observation could be made for each HIV-specific epitope examined. Correlative expres-sion of certain effector functions among HIV-1-specific CD8⫹T cells has also been observed previously (12,52,53). In addition, multifunctional T cells seem to be optimized for effector function, as the expression level of certain cytokines per cell measured in mean fluorescent intensity is up to 10-fold higher in
on November 7, 2019 by guest
http://jvi.asm.org/
tional T cells than in monofunctional T cells expressing only one particular effector function (76–78). If this difference in expres-sion levels also translates into a higher efficacy in performance, the frequency of polyfunctional CD8⫹T cells might already represent the fraction of the response having by far the greatest impact on viral control, i.e., explaining the observed correlation.
To evaluate the role of CD8⫹T cells in HIV-1 infection and to determine possible immune correlates of protection in more de-tail, current measurements of CD8⫹T cell responses have to be refined. In order to account for the actual quality of the CD8⫹T cell response, the antiviral impact of each effector function and each specific epitope has to be quantified in more detail. In addi-tion, the relationship between cytokine expression levels and an-tiviral effects needs to be determined, also in terms of the correl-ative expression of certain effector functions. These missing links would allow us to combine cell frequencies and expression levels of certain chemokines in individual cells to calculate a functional correlative of the CD8⫹T cell response in HIV-1-infected indi-viduals and to determine if this strength of the response can be used to predict disease progression.
ACKNOWLEDGMENTS
We thank Michael Betts, Richard Koup, and Martha Nason for sharing their data with us. We thank Samuel Alizon, Roger Kouyos, and Annette Oxenius for helpful discussions and Alan Perelson for critical reading of the manuscript.
F.G. and R.R.R. were supported by the Swiss National Science Foun-dation (SNF grant numbers 315200-114148 and 315230-130855 to R.R.R.). F.G. was also funded by the Center for Modeling and Simulation in the Biosciences (BIOMS) of Heidelberg University.
REFERENCES
1.Borrow P, Lewicki H, Hahn BH, Shaw GM, Oldstone MB. 1994. Virus-specific CD8⫹cytotoxic T-lymphocyte activity associated with control of viremia in primary human immunodeficiency virus type 1 in-fection. J. Virol.68:6103– 6110.
2.Koup RA, Safrit JT, Cao Y, Andrews CA, McLeod G, Borkowsky W, Farthing C, Ho DD.1994. Temporal association of cellular immune responses with the initial control of viremia in primary human immuno-deficiency virus type 1 syndrome. J. Virol.68:4650 – 4655.
3.Guidotti LG, Borrow P, Brown A, McClary H, Koch R, Chisari FV.
1999. Noncytopathic clearance of lymphocytic choriomeningitis virus from the hepatocyte. J. Exp. Med.189:1555–1564.http://dx.doi.org/10 .1084/jem.189.10.1555.
4.Wherry EJ, Blattman JN, Murali-Krishna K, van der Most R, Ahmed R.
2003. Viral persistence alters CD8 T-cell immunodominance and tissue dis-tribution and results in distinct stages of functional impairment. J. Virol.77:
4911– 4927.http://dx.doi.org/10.1128/JVI.77.8.4911-4927.2003.
5.Jin X, Bauer DE, Tuttleton SE, Lewin S, Gettie A, Blanchard J, Irwin CE, Safrit JT, Mittler J, Weinberger L, Kostrikis LG, Zhang L, Perelson AS, Ho DD.1999. Dramatic rise in plasma viremia after CD8⫹T cell depletion in simian immunodeficiency virus-infected macaques. J. Exp. Med.189:991–998.http://dx.doi.org/10.1084/jem.189.6.991.
6.Schmitz JE, Kuroda MJ, Santra S, Sasseville VG, Simon MA, Lifton MA, Racz P, Tenner-Racz K, Dalesandro M, Scallon BJ, Ghrayeb J, Forman MA, Montefiori DC, Rieber EP, Letvin NL, Reimann KA.1999. Control of viremia in simian immunodeficiency virus infection by CD8⫹ lympho-cytes. Science 283:857– 860.http://dx.doi.org/10.1126/science.283.5403 .857.
7.Makedonas G, Betts MR.2011. Living in a house of cards: re-evaluating CD8⫹T-cell immune correlates against HIV. Immunol. Rev.239:109 – 124.http://dx.doi.org/10.1111/j.1600-065X.2010.00968.x.
8. Altman JD, Moss PAH, Goulder PJR, Barouch DH,
McHeyzer-Williams MG, Bell JI, McMichael AJ, Davis MM. 1996. Phenotypic analysis of antigen-specific T lymphocytes. Science274:94 –96.http://dx .doi.org/10.1126/science.274.5284.94.
9.Moss PA, Rowland-Jones SL, Frodsham PM, McAdam S, Giangrande P,
McMichael AJ, Bell JI.1995. Persistent high frequency of human immu-nodeficiency virus-specific cytotoxic T cells in peripheral blood of infected donors. Proc. Natl. Acad. Sci. U. S. A.92:5773–5777.http://dx.doi.org/10 .1073/pnas.92.13.5773.
10. Wilson JD, Ogg GS, Allen RL, Goulder PJ, Kelleher A, Sewell AK, O’Callaghan CA, Rowland-Jones SL, Callan MF, McMichael AJ.1998. Oligoclonal expansions of CD8(⫹) T cells in chronic HIV infection are antigen specific. J. Exp. Med.188:785–790.http://dx.doi.org/10.1084/jem .188.4.785.
11. Buchbinder SP, Mehrotra DV, Duerr A, Fitzgerald DW, Mogg R, Li D, Gilbert PB, Lama JR, Marmor M, Del Rio C, McElrath MJ, Casimiro DR, Gottesdiener KM, Chodakewitz JA, Corey L, Robertson MN, Kelleher T, Emery S, Cooper D, Barroso P, Schechter M, Kalichman A, Kallas E, Bruneau J, Loutfy M, Tyndale M, Donastorg Y, Koenig E, Joseph P, Pape J, Figueroa P, Casapia M, Cabello R, Sanchez J, Leon R, Zorrilla C, Frew P, Mulligan M, Goepfert P, Baden L, Mayer K, Novak R, Judson F, Lee P, Tyring S, Brown S, Santiago S, Daskalakis D, Hammer S, Koblin B, et al.2008. Efficacy assessment of a cell-mediated immunity HIV-1 vaccine (the Step study): a double-blind, randomised, placebo-controlled, test-of-concept trial. Lancet372:1881–1893.http://dx .doi.org/10.1016/S0140-6736(08)61591-3.
12. Betts MR, Nason MC, West SM, De Rosa SC, Migueles SA, Abraham J, Lederman MM, Benito JM, Goepfert PA, Connors M, Roederer M, Koup RA.2006. HIV nonprogressors preferentially maintain highly func-tional HIV-specific CD8⫹T cells. Blood107:4781– 4789.http://dx.doi .org/10.1182/blood-2005-12-4818.
13. Lieberman J, Shankar P, Manjunath N, Andersson J.2001. Dressed to kill? A review of why antiviral CD8 T lymphocytes fail to prevent progres-sive immunodeficiency in HIV-1 infection. Blood98:1667–1677.http: //dx.doi.org/10.1182/blood.V98.6.1667.
14. Shin H, Wherry EJ.2007. CD8 T cell dysfunction during chronic viral infection. Curr. Opin. Immunol.19:408 – 415.http://dx.doi.org/10.1016/j .coi.2007.06.004.
15. Barber DL, Wherry EJ, Masopust D, Zhu B, Allison JP, Sharpe AH, Freeman GJ, Ahmed R.2006. Restoring function in exhausted CD8 T cells during chronic viral infection. Nature439:682– 687.http://dx.doi .org/10.1038/nature04444.
16. Velu V, Titanji K, Zhu B, Husain S, Pladevega A, Lai L, Vanderford TH, Chennareddi L, Silvestri G, Freeman GJ, Ahmed R, Amara RR.2009. Enhancing SIV-specific immunity in vivo by PD-1 blockade. Nature458:
206 –210.http://dx.doi.org/10.1038/nature07662.
17. Rehr M, Cahenzli J, Haas A, Price DA, Gostick E, Huber M, Karrer U, Oxenius A.2008. Emergence of polyfunctional CD8⫹T cells after pro-longed suppression of human immunodeficiency virus replication by an-tiretroviral therapy. J. Virol.82:3391–3404.http://dx.doi.org/10.1128/JVI .02383-07.
18. Schellens IM, Borghans JA, Jansen CA, De Cuyper IM, Geskus RB, van Baarle D, Miedema F.2008. Abundance of early functional HIV-specific CD8⫹T cells does not predict AIDS-free survival time. PLoS One3:e2745. http://dx.doi.org/10.1371/journal.pone.0002745.
19. Krakauer DC, Nowak M.1999. T-cell induced pathogenesis in HIV: bystander effects and latent infection. Proc. Biol. Sci.266:1069 –1075. http://dx.doi.org/10.1098/rspb.1999.0745.
20. Dragic T, Litwin V, Allaway GP, Martin SR, Huang Y, Nagashima KA, Cayanan C, Maddon PJ, Koup RA, Moore JP, Paxton WA.1996. HIV-1 entry into CD4⫹cells is mediated by the chemokine receptor CC-CKR-5. Nature381:667– 673.http://dx.doi.org/10.1038/381667a0.
21. Tomaras GD, Lacey SF, McDanal CB, Ferrari G, Weinhold KJ, Green-berg ML.2000. CD8⫹T cell-mediated suppressive activity inhibits HIV-1 after virus entry with kinetics indicating effects on virus gene expression. Proc. Natl. Acad. Sci. U. S. A.97:3503–3508.http://dx.doi.org/10.1073 /pnas.97.7.3503.
22. Janeway CA, Travers P, Walport M, Shlomchik M.1996. Immunobiol-ogy. Garland Publishing, New York, NY.
23. Hammer SM, Gillis JM, Groopman JE, Rose RM.1986. In vitro modi-fication of human immunodeficiency virus infection by granulocyte-macrophage colony-stimulating factor and gamma interferon. Proc. Natl. Acad. Sci. U. S. A.83:8734 – 8738.http://dx.doi.org/10.1073/pnas.83.22 .8734.
24. Mackewicz CE, Blackbourn DJ, Levy JA.1995. CD8⫹T cells suppress human immunodeficiency virus replication by inhibiting viral transcrip-tion. Proc. Natl. Acad. Sci. U. S. A.92:2308 –2312.http://dx.doi.org/10 .1073/pnas.92.6.2308.
CD8⫹T Cell Quality and HIV
on November 7, 2019 by guest
http://jvi.asm.org/
25. Walker CM, Moody DJ, Stites DP, Levy JA.1986. CD8⫹lymphocytes can control HIV infection in vitro by suppressing virus replication. Sci-ence234:1563–1566.http://dx.doi.org/10.1126/science.2431484. 26. Walker CM, Levy JA.1989. A diffusible lymphokine produced by CD8⫹
T lymphocytes suppresses HIV replication. Immunology66:628 – 630. 27. Levy JA.2003. The search for the CD8⫹cell anti-HIV factor (CAF). Trends
Immunol.24:628 – 632.http://dx.doi.org/10.1016/j.it.2003.10.005. 28. Cocchi F, DeVico AL, Garzino-Demo A, Arya SK, Gallo RC, Lusso P.
1995. Identification of RANTES, MIP-1 alpha, and MIP-1 beta as the major HIV-suppressive factors produced by CD8⫹T cells. Science270:
1811–1815.http://dx.doi.org/10.1126/science.270.5243.1811.
29. Nowak MA, May RM.2000. Virus dynamics. Oxford University Press, Oxford, United Kingdom.
30. Regoes RR, Barber DL, Ahmed R, Antia R.2007. Estimation of the rate of killing by cytotoxic T lymphocytes in vivo. Proc. Natl. Acad. Sci. U. S. A.
104:1599 –1603.http://dx.doi.org/10.1073/pnas.0508830104.
31. Wei X, Ghosh SK, Taylor ME, Johnson VA, Emini EA, Deutsch P, Lifson JD, Bonhoeffer S, Nowak MA, Hahn BH, Saag MS, Shaw GM.
1995. Viral dynamics in human immunodeficiency virus type 1 infection. Nature373:117–122.http://dx.doi.org/10.1038/373117a0.
32. Althaus CL, De Boer RJ. 2008. Dynamics of immune escape during HIV/SIV infection. PLoS Comput. Biol.4:e1000103.http://dx.doi.org/10 .1371/journal.pcbi.1000103.
33. Ramratnam B, Bonhoeffer S, Binley J, Hurley A, Zhang L, Mittler JE, Markowitz M, Moore JP, Perelson AS, Ho DD.1999. Rapid production and clearance of HIV-1 and hepatitis C virus assessed by large volume plasma apheresis. Lancet354:1782–1785.http://dx.doi.org/10.1016/S0140 -6736(99)02035-8.
34. Betts MR, Ambrozak DR, Douek DC, Bonhoeffer S, Brenchley JM, Casazza JP, Koup RA, Picker LJ.2001. Analysis of total human immu-nodeficiency virus (HIV)-specific CD4⫹and CD8⫹T-cell responses: re-lationship to viral load in untreated HIV infection. J. Virol.75:11983– 11991.http://dx.doi.org/10.1128/JVI.75.24.11983-11991.2001. 35. Migueles SA, Laborico AC, Shupert WL, Sabbaghian MS, Rabin R,
Hallahan CW, Van Baarle D, Kostense S, Miedema F, McLaughlin M, Ehler L, Metcalf J, Shuying L, Connors M.2002. HIV-specific CD8⫹T cell proliferation is coupled to perforin expression and is maintained in nonprogressors. Nat. Immunol.3:1061–1068.http://dx.doi.org/10.1038 /ni845.
36. Bodman-Smith MD, Williams I, Johnstone R, Boylston A, Lydyard PM, Zumla A.2002. T cell receptor usage in patients with non-progressing HIV infection. Clin. Exp. Immunol.130:115–120.http://dx.doi.org/10 .1046/j.1365-2249.2002.01944.x.
37. Trepel F.1974. Number and distribution of lymphocytes in man. A crit-ical analysis. Klin. Wochenschr.52:511–515.http://dx.doi.org/10.1007 /BF01468720.
38. De Odorico I, Spaulding KA, Pretorius DH, Lev-Toaff AS, Bailey TB, Nelson TR. 1999. Normal splenic volumes estimated using three-dimensional ultrasonography. J. Ultrasound Med.18:231–236. 39. Fleury S, de Boer RJ, Rizzardi GP, Wolthers KC, Otto SA, Welbon CC,
Graziosi C, Knabenhans C, Soudeyns H, Bart PA, Gallant S, Corpataux JM, Gillet M, Meylan P, Schnyder P, Meuwly JY, Spreen W, Glauser MP, Miedema F, Pantaleo G.1998. Limited CD4⫹T-cell renewal in early HIV-1 infection: effect of highly active antiretroviral therapy. Nat. Med.
4:794 – 801.http://dx.doi.org/10.1038/nm0798-794.
40. Kuroda MJ, Schmitz JE, Charini WA, Nickerson CE, Lord CI, Forman MA, Letvin NL.1999. Comparative analysis of cytotoxic T lymphocytes in lymph nodes and peripheral blood of simian immunodeficiency virus-infected rhesus monkeys. J. Virol.73:1573–1579.
41. Ngai P, McCormick S, Small C, Zhang X, Zganiacz A, Aoki N, Xing Z.
2007. Gamma interferon responses of CD4 and CD8 T-cell subsets are quantitatively different and independent of each other during pulmonary Mycobacterium bovis BCG infection. Infect. Immun.75:2244 –2252.http: //dx.doi.org/10.1128/IAI.00024-07.
42. Markowitz M, Louie M, Hurley A, Sun E, Di Mascio M, Perelson AS, Ho DD.2003. A novel antiviral intervention results in more accurate assessment of human immunodeficiency virus type 1 replication dynam-ics and T-cell decay in vivo. J. Virol.77:5037–5038.http://dx.doi.org/10 .1128/JVI.77.8.5037-5038.2003.
43. Ho DD, Neumann AU, Perelson AS, Chen W, Leonard JM, Markowitz M.
1995. Rapid turnover of plasma virions and CD4 lymphocytes in HIV-1 in-fection. Nature373:123–126.http://dx.doi.org/10.1038/373123a0. 44. Perelson AS, Neumann AU, Markowitz M, Leonard JM, Ho DD.1996.
HIV-1 dynamics in vivo: virion clearance rate, infected cell life-span, and viral generation time. Science271:1582–1586.http://dx.doi.org/10.1126 /science.271.5255.1582.
45. Asquith B, Edwards CTT, Lipsitch M, McLean AR.2006. Inefficient cytotoxic T lymphocyte-mediated killing of HIV-1-infected cells in vivo. PLoS Biol.4:e90.http://dx.doi.org/10.1371/journal.pbio.0040090. 46. Asquith B, Mosley AJ, Barfield A, Marshall SE, Heaps A, Goon P,
Hanon E, Tanaka Y, Taylor GP, Bangham CR.2005. A functional CD8⫹ cell assay reveals individual variation in CD8⫹cell antiviral efficacy and explains differences in human T-lymphotropic virus type 1 proviral load. J. Gen. Virol.86:1515–1523.http://dx.doi.org/10.1099/vir.0.80766-0. 47. Dimitrov DS, Hillman K, Manischewitz J, Blumenthal R, Golding H.
1992. Kinetics of soluble CD4 binding to cells expressing human immu-nodeficiency virus type 1 envelope glycoprotein. J. Virol66:132–138. 48. Haase AT, Henry K, Zupancic M, Sedgewick G, Faust RA, Melroe H,
Cavert W, Gebhard K, Staskus K, Zhang ZQ, Dailey PJ, Balfour HH, Jr, Erice A, Perelson AS.1996. Quantitative image analysis of HIV-1 infec-tion in lymphoid tissue. Science274:985–989.http://dx.doi.org/10.1126 /science.274.5289.985.
49. Chen HY, Di Mascio M, Perelson AS, Ho DD, Zhang L.2007. Deter-mination of virus burst size in vivo using a single-cycle SIV in rhesus macaques. Proc. Natl. Acad. Sci. U. S. A.104:19079 –19084.http://dx.doi .org/10.1073/pnas.0707449104.
50. Douek DC, Brenchley JM, Betts MR, Ambrozak DR, Hill BJ, Okamoto Y, Casazza JP, Kuruppu J, Kunstman K, Wolinsky S, Grossman Z, Dybul M, Oxenius A, Price DA, Connors M, Koup RA.2002. HIV preferentially infects HIV-specific CD4⫹T cells. Nature417:95–98.http: //dx.doi.org/10.1038/417095a.
51. Simpson EH.1949. Measurement of diversity. Nature163:688.http://dx .doi.org/10.1038/163688a0.
52. Lichterfeld M, Yu XG, Waring MT, Mui SK, Johnston MN, Cohen D, Addo MM, Zaunders J, Alter G, Pae E, Strick D, Allen TM, Rosenberg ES, Walker BD, Altfeld M.2004. HIV-1-specific cytotoxicity is preferen-tially mediated by a subset of CD8(⫹) T cells producing both interferon-gamma and tumor necrosis factor-alpha. Blood104:487– 494.http://dx .doi.org/10.1182/blood-2003-12-4341.
53. Sandberg JK, Fast NM, Nixon DF.2001. Functional heterogeneity of cytokines and cytolytic effector molecules in human CD8⫹T lympho-cytes. J. Immunol.167:181–187.http://dx.doi.org/10.4049/jimmunol.167 .1.181.
54. Klatt NR, Shudo E, Ortiz AM, Engram JC, Paiardini M, Lawson B, Miller MD, Else J, Pandrea I, Estes JD, Apetrei C, Schmitz JE, Ribeiro RM, Perelson AS, Silvestri G.2010. CD8⫹lymphocytes control viral replication in SIVmac239-infected rhesus macaques without decreasing the lifespan of productively infected cells. PLoS Pathog.6:e1000747.http: //dx.doi.org/10.1371/journal.ppat.1000747.
55. Wong JK, Strain MC, Porrata R, Reay E, Sankaran-Walters S, Ignacio CC, Russell T, Pillai SK, Looney DJ, Dandekar S.2010. In vivo CD8⫹ T-cell suppression of SIV viremia is not mediated by CTL clearance of productively infected cells. PLoS Pathog.6:e1000748.http://dx.doi.org/10 .1371/journal.ppat.1000748.
56. Elemans M, Seich Al Basatena NK, Klatt NR, Gkekas C, Silvestri G, Asquith B.2011. Why don’t CD8⫹T cells reduce the lifespan of SIV-infected cells in vivo? PLoS Comput. Biol.7:e1002200.http://dx.doi.org /10.1371/journal.pcbi.1002200.
57. Elemans M, Thiebaut R, Kaur A, Asquith B.2011. Quantification of the relative importance of CTL, B cell, NK cell, and target cell limitation in the control of primary SIV-infection. PLoS Comput. Biol.7:e1001103.http: //dx.doi.org/10.1371/journal.pcbi.1001103.
58. Ganusov VV, Antia R.2005. Pathology during acute infections: contri-butions of intracellular pathogens and the CTL response. Biol. Lett.
1:239 –242.http://dx.doi.org/10.1098/rsbl.2004.0276.
59. Wodarz D, Krakauer DC.2000. Defining CTL-induced pathology: im-plications for HIV. Virology274:94 –104.http://dx.doi.org/10.1006/viro .2000.0399.
60. Wodarz D, Christensen JP, Thomsen AR.2002. The importance of lytic and nonlytic immune response in viral infections. Trends Immunol.23:
194 –200.http://dx.doi.org/10.1016/S1471-4906(02)02189-0.
61. Davenport MP, Zhang L, Bagchi A, Fridman A, Fu TM, Schleif W, Shiver JW, Ribeiro RM, Perelson AS.2005. High-potency human im-munodeficiency virus vaccination leads to delayed and reduced CD8⫹ T-cell expansion but improved virus control. J. Virol.79:10059 –10062. http://dx.doi.org/10.1128/JVI.79.15.10059-10062.2005.