UNIVERSITI TEKNIKAL MALAYSIA MELAKA
PROTOTYPE DEVELOPMENT OF SELF ASSES SPLIT UNIT
AIR CONDITIONING SYSTEM MAINTENANCE
This report submitted in accordance with requirement of the Universiti Teknikal Malaysia Melaka (UTeM) for the Bachelor’s Degree in Mechanical Engineering
Technology (Refrigeration and Air-Conditioning Systems) (Hons.)
by
MUHAMMAD AZIM BIN ZAINAL B071310110
900814-01-5193
ii
UNIVERSITI TEKNIKAL MALAYSIA MELAKA
BORANG PENGESAHAN STATUS LAPORAN PROJEK SARJANA MUDA
TAJUK: Prototype Development Of Self Asses Split Unit Air Conditioning System Maintenance
SESI PENGAJIAN: 2016/2017 Semester 1
Saya MUHAMMAD AZIM BIN ZAINAL
mengaku membenarkan Laporan PSM ini disimpan di Perpustakaan Universiti Teknikal Malaysia Melaka (UTeM) dengan syarat-syarat kegunaan seperti berikut:
1. Laporan PSM adalah hak milik Universiti Teknikal Malaysia Melaka dan penulis. 2. Perpustakaan Universiti Teknikal Malaysia Melaka dibenarkan membuat salinan untuk
tujuan pengajian sahaja dengan izin penulis.
3. Perpustakaan dibenarkan membuat salinan laporan PSM ini sebagai bahan pertukaran antara institusi pengajian tinggi.
4. **Sila tandakan ( )
SULIT
TERHAD
TIDAK TERHAD
(Mengandungi maklumat yang berdarjah keselamatan atau kepentingan Malaysia sebagaimana yang termaktub dalam AKTA RAHSIA RASMI 1972)
(Mengandungi maklumat TERHAD yang telah ditentukan oleh organisasi/badan di mana penyelidikan dijalankan)
(________________________)
Alamat Tetap:
No. 11, Jalan 40, Taman Rambai Jaya,
Taman Tanjong Minyak,
75250, Melaka.
Tarikh: ________________________
Disahkan oleh:
(_________________________)
Cop Rasmi:
Tarikh: _______________________
i
DECLARATION
I hereby, declared this report entitled “Prototype Development Of Self Asses Split Unit Air Conditioning System Maintenance” is the result of my own research except
as cited in references.
Signature :………
Name : MUHAMMAD AZIM BIN ZAINAL
ii
APPROVAL
This report is submitted to the Faculty of Engineering Technology of UTeM as a partial fulfillment of the requirements for the degree of Bachelor of Engineering Technology (Refrigeration and Air-Conditioning System) (Hons.). The member of the supervisory is as follow:
iii
ABSTRACT
This project will be performed to develop a device that can inform consumer when suitable time to do maintenance for their split unit system. To determine the most suitable time for maintenance on air conditioner is not an easy decision for normal consumer. This project was performed to design and fabricate a device that can help consumer on that problem. Maintenance should be done when the performance of the system dropped below satisfied level. Performance of split air conditioner system was determined by Coefficient of Performance (COP). The project had been conducted by interrupting airflow on condenser and evaporator to simulate low performance of the system. The study had determined the best coefficient of performance of the selected unit was 5.19 while the lowest coefficient of performance was 1.98. From the study also determined the best time to do maintenance on the split unit when the coefficient of performance between 2 to 4.
iv
ABSTRAK
v
DEDICATIONS
vi
ACKNOWLEDGMENTS
vii
TABLE OF CONTENTS
DECLARATION ... i
APPROVAL ... ii
ABSTRACT ... iii
ABSTRAK ... iv
DEDICATIONS ... v
ACKNOWLEDGMENTS ... vi
LIST OF TABLE ... x
LIST OF FIGURES ... xi
CHAPTER 1 ... 1
INTRODUCTION ... 1
1.0 Background ... 1
1.1 Problem statement ... 1
1.2 Aim and Objective ... 2
1.3 Scope ... 2
CHAPTER 2 ... 3
LITERATURE REVIEW ... 3
2.1 Split unit air conditioning system ... 3
2.2 Vapor Compression Cycle ... 4
2.3 Performance of split unit air conditioner system ... 7
viii
CHAPTER 3 ... 14
METHODOLOGY ... 14
3.1 Methodology chart ... 14
3.2 Design ... 16
3.2.1 Design Concept ... 17
3.2.2 Material selection ... 18
3.2.2.2 Software material ... 20
3.2.2.2.1 Arduino programmed ... 20
3.2.2.2.2 Microsoft Office Excel ... 21
3.3 Fabrication... 21
3.3.1 Assemble ... 22
3.3.2 Temperature sensor location ... 22
3.3.3 Pressure gauge location ... 23
3.4 Experiment ... 23
3.4.1 Data experiment ... 24
CHAPTER 4 ... 25
RESULT AND DISCUSSION ... 25
4.1 Coefficient of performance percentage ... 25
4.1.1 Percentage of performance condenser and evaporator fan slow ... 26
4.1.2 Percentage of performance for both condenser and evaporator fan slow ... 28
4.2 Design performance percentage ... 30
ix
4.2.2 Bad condition ... 32
4.2.3 Good condition ... 33
CHAPTER 5 ... 34
CONCLUSION AND RECOMMENDATION ... 34
5.0 Summary of the Project ... 34
5.1 Achievement of Project Objectives ... 34
5.2 Future Development ... 35
REFERENCES ... 36
x
LIST OF TABLE
Table 3.1 Hardware Material ... 19
Table 3.2 Data Collect... 24
Table 4.1 Very bad condition ... 31
Table 4.2 Bad condition ... 32
Table 4.3 Good condition ... 33
xi
LIST OF FIGURES
Figure 2.1 : Split unit air conditioning system ... 3
Figure 2.2 : Basic vapor compression refrigeration cycle... 5
Figure 2.3 : p-h diagram ... 6
Figure 2.4 : Schematic diagram ... 8
Figure 2.5 : T-s diagram ... 8
Figure 2.6 : p-h diagram ... 9
Figure 2.7 : Capacity and minimum efficiency ... 11
Figure 2.8 : Component failure rate over time for component population ... 12
Figure 3.1 : Methodology chart ... 15
Figure 3.2 : System design at outdoor unit ... 16
Figure 3.3 : Design concept flow chart ... 18
Figure 3.4 : Arduino software ... 20
Figure 3.5 : Calculator coefficient of performance ... 21
Figure 3.6 : Temperature sensor location ... 22
Figure 3.7 : p-h diagram temperature sensor location... 22
Figure 3.8 : Pressure gauge location ... 23
Figure 3.9 : p-h diagram pressure gauge location ... 23
Figure 4.1 : Percentage of perfromance for condenser and evaporator fan slow ... 26
1
CHAPTER 1
INTRODUCTION
1.0 Background
Split unit air conditioner is widely used in residential and commercial building. The statistics show that more than 50% of the electricity bill in a commercial building and more than 30% of total electricity bills in residential areas are contributed by the operating cost of air conditioners (Y.H. Yau, 2014). It consumes very high amount of energy to maintain indoor air temperature. For that, each instrument that used in the system has its own lifetime. The lifetime of the equipment is based on the way of use and care of the equipment. This is why maintenance important for all equipment. One of the common problems for all air conditioner split unit is the system not operating with higher efficiency and waste of cost and energy usage if maintenance of air conditioning split unit is done early from the time supposed to be. To ensure air conditioning operates with higher efficiency, maintenance is required so that the system will not cause problem for long term usage. This project will be designed to help consumers to know the suitable time to do maintenance for their system.
1.1 Problem statement
2
a) Consumers do not know when is the right time to do maintenance for their air
conditioning split unit.
1.2 Aim and Objective
To develop a device that can help consumer to know when is the right time to maintenance split unit air conditioner system. A few objectives have been created:
a) To design and fabricate a device that can be used for consumers to know when is the best time to do maintenance for split unit.
b) To analyse the capability of the device to measure the coefficient of performance for split unit.
1.3 Scope
For this project, the scope that has been selected is constant split unit air conditioner wall mount type with 1 HP.
1.4 Thesis structure
3
CHAPTER 2
LITERATURE REVIEW
2.1 Split unit air conditioning system
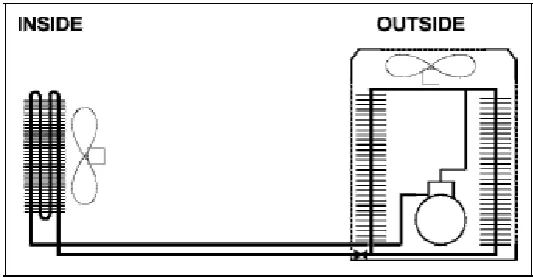
[image:16.595.188.455.451.590.2]In split unit air conditioning system, compressor and condenser of the refrigeration system is chosen separately from the rest of the system and connected by refrigerant line to the system includes the evaporator unit. Refrigerant line that connecting the system including pipes and insulation only millimetres in diameter. The separation of the two part of the refrigeration system to produce the split diagrammed in figure 2.1. This system is for small residential system for example home, office and others. (McDOWALL, 2007).
4 Room air conditioner has four way reversing valve that added to all room heat pumps. Room air conditioner are separate in two split units that is outdoor unit has condensing unit with compressor and condenser, and indoor unit in more advantageous location and to reduce compressor noise indoors. (Wang, 2000).
The major component in split type air conditioner include evaporator fan pressurize and supplies the conditioned air to the space. In tube and fin coil, the refrigerant evaporates, expands directly inside the tubes, and absorbs the heat energy from the ambient air during the cooling season. Refrigerant react as heat pump when hot refrigerant release heat during heating season. (Wang, 2000).
A compressor will compress the refrigerant from a lower evaporating pressure to higher condensing pressure. After refrigerant being compress from hot gas to liquid it will reject heat through a coil and condenser fan. A temperature sensor that sense space inside air temperature and control starts and stops the compressor and next control it’s cooling and heating capacity through a thermostat. (Wang, 2000) .
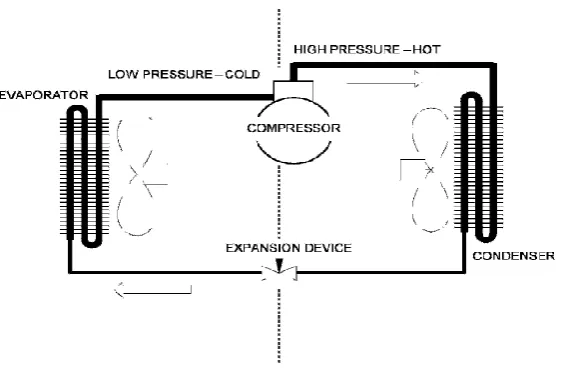
2.2 Vapor Compression Cycle
Vapor compression cycles (VCC) are widely used in air conditioning systems which is the most energy consuming domestic appliances. All residential electricity consumption in air conditioning shows 13.7% and 16%. Hence, better designs of cooling system are required to minimize the energy consumption. (Mahmoud A. Alzoubi, 2015)
5
Figure 2.2 : Basic vapor compression refrigeration cycle
Compressor - compresses refrigerant vapor to a high pressure, this process produce hot temperature of refrigerant.
Condenser - air or water reduce temperature of the refrigerant and cause it to condense into liquid.
Expansion valve - allows a controlled amount of the liquid refrigerant to flow through into the low-pressure section of the system.
Evaporator - air or water heats the liquid refrigerant so that it evaporates back into a vapor.
The following refrigeration processes occur during the operation of an air or gas expansion refrigeration system:
1. Compression - Air or gas is compressed to a higher pressure and temperature. 2. Heat releas - Heat is released to the surroundings at constant pressure in
order to reduce the temperature of the air or gas.
3. Throttling and expansion - Air or gas is throttled and expanded so that its temperature is lowered.
4. Heat absorption - Heat is absorbed from the surroundings because of the lower air or gas temperature.
6 reservoir and releasing it to a higher temperature reservoir in such a way that the final state is equal in all respects to the initial state. It is said to have undergone a closed refrigeration cycle. When air or gas undergoes a series of compression, heat release, throttling, expansion, and heat absorption processes, and its final state is not equal to its initial state, it is said to have undergone an open refrigeration cycle. (Wang, 2000)
The expansion device is a length of very small-bore tube that restricts the refrigerant liquid flow from the high-pressure side to the low-pressure side. A thermostat turns the compressor “on” when cooling temperature is required, and “off” again when the temperature is cool enough. The evaporator fan draws room air over the evaporator coil to cool space. The condenser is placed outside and the condenser fan draws outside air over the condenser coil to reject heat into the outside air. (McDOWALL, 2007)
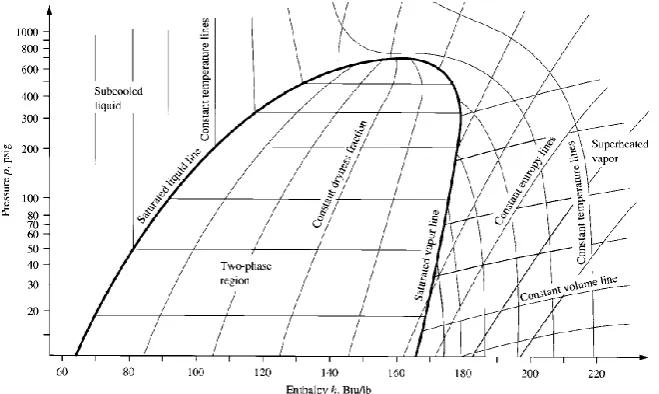
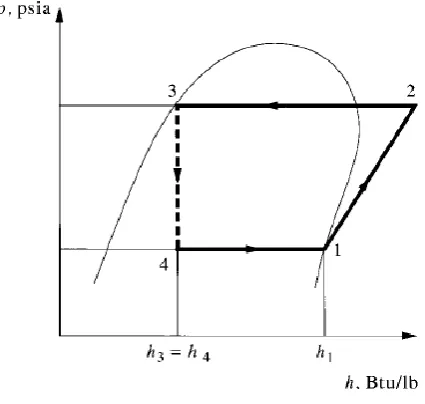
[image:19.595.156.486.481.678.2]The most common graphical tool that used to calculate heat adds work transfer and performance of refrigerant cycle that is pressure-enthalpy diagram or can be known as p-h diagram. This diagram is divided by two side of region that is high pressure region and low pressure region. Heat and work transfer can be calculated by change of enthalpy. (Wang, 2000)
7 From Figure 2.3, the diagram shows that the saturated vapor line separates the phase which liquid and superheated vapor and saturated liquid separates the phase which vapor and liquid refrigerants. In the two phase region, the mixture of vapor and liquid is subdivided by the constant dryness fraction quality line. The constant temperature lines are nearly vertical in the sub cooled liquid region. At higher temperatures, they are curves near the saturated liquid line. In the two phase region, the constant temperature lines are horizontal. In the superheated region, the constant temperature lines curve down sharply. Because the constant-temperature lines and constant-pressure lines in the two-phase region are horizontal, they are closely related. The specific pressure of a refrigerant in the two-phase region determines its temperature, and vice versa. Also in the superheated region, the constant-entropy lines incline sharply upward, and constant volume lines are flatter. Both are slightly curved. (Wang, 2000).
2.3 Performance of split unit air conditioner system
The coefficient of performance is a ratio of heating or cooling provided to work required. The performance of vapor compression refrigeration system is measured as COP. When the system extracts more heat, the COP is higher and the system is more efficient. (Sheikh Ismail THARVES MOHIDEEN).
Energy consumption and life cycle costs are important to every unit of air conditioner. To achieve the most lower cost there are several thing that will be consider that is operating costs during the life cycle of the asset. This is including the energy used form the system, labour, and operation maintenance costs. Energy consumption can be determined by the performance of the system. More electrical energy is used for split systems because of their lower energy efficiency. (H. Yang, 2001).
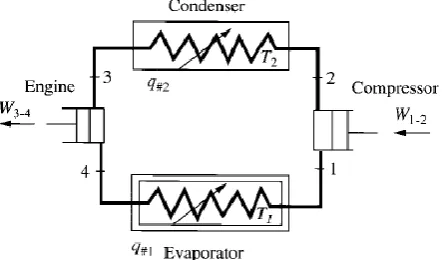
8 another for expansion 3-4. The cycle are consist of four process that is: (Wang, 2000).
1. An isothermal process 4-1 in which heat q#1 is extracted at constant temperature T1 per lb (kg) of working substance
2. An isentropic compression process 1-2
3. An isothermal process 2-3 in which q#2 is rejected at constant temperature T2 per lb (kg) of working substance
[image:21.595.210.434.283.413.2]4. An isentropic expansion process 3-4
[image:21.595.216.415.458.636.2]Figure 2.4 : Schematic diagram
Figure 2.5 : T-s diagram
9
Figure 2.6 : p-h diagram
For isentropic compression between points 1 and 2, applying the steady flow energy equation and ignoring the change of kinetic energy:
ℎ₁ + 0 = ℎ₂ + 𝑊
−𝑊 = ℎ₂ − ℎ₁
Work input to the compressor Win. Btu / lb (kJ / kg):
𝑊𝑖𝑛 = ℎ₂ − ℎ₁
Similarly, for condensation between points 2 and 3:
ℎ₂ + 𝑞# = ℎ₃ + 0
the heat release by the refrigerant in the condenser –q#. Btu / lb (kJ / kg):
−𝑞# = ℎ₂ − ℎ₃
For the throttling process between points 3 and 4, assuming that the heat loss in negligible:
ℎ₃ + 0 = ℎ₄ + 0
10 The COP of the single stage ideal vapor compression cycle is:
𝐶𝑂𝑃 =𝑟𝑒𝑓𝑟𝑖𝑔𝑒𝑟𝑎𝑛𝑡 𝑒𝑓𝑓𝑒𝑐𝑡 (𝑞#)
𝑤𝑜𝑟𝑘 𝑖𝑛𝑝𝑢𝑡 (𝑊𝑖𝑛)
𝑞# 𝑊𝑖𝑛
=
ℎ₁−ℎ₄ ℎ₂−ℎ₁
Where,
ℎ₁ = Enthalpy of refrigerant at points 1, respectively, Btu/lb (J/kg)
ℎ₄ = Enthalpy of refrigerant at points 4, respectively, Btu/lb (J/kg)
ℎ₂ = Enthalpy of refrigerant at points 2, respectively, Btu/lb (J/kg)
𝑞# = Heat supplied per lb (kg) of working substance during evaporation process, Btu/ lb (J /kg)
Win = net work done by system; sign is positive, or if it is a work input to system, sign is negative.
For analyse the performance of the refrigerant cycle, the enthalpy (h) must be determined to calculate the refrigerant effect, work input, and COP. The enthalpy of the refrigerant at saturated liquid and saturated vapor state is a function of saturated temperature and pressure. In other words, saturated temperature Ts and saturated pressure P of the refrigerant are dependent upon each other. (Wang, 2000).
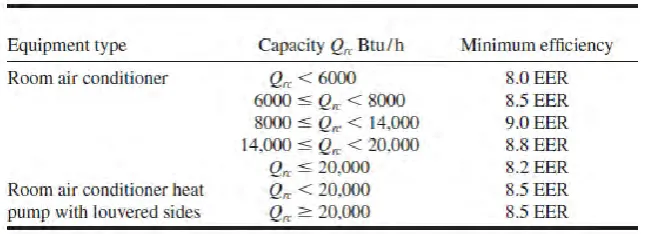
11 air conditioners with louvered sides and room air conditioner heat pumps with louvered sides as follows: (Wang, 2000).
Figure 2.7 : capacity and minimum efficiency
The effect of weather on split unit air conditioning can influence the performance of the total cooling capacity and sensible heat factor (SHF). Based on the studied of Y.H. Yau, it stated that 1◦C incrementing outdoor temperature will cause the COP and the total cooling capacity of the existing system reduce by 2% while the SHF drops less than 2% from 2020 to 2080.this must be considered and analyzed to preserve substantial of energy. (Y.H. Yau, 2014).
2.4 Maintenance requirements