Epstein-Barr Virus Infection of Cell Lines Derived from Diffuse
Large B-Cell Lymphomas Alters MicroRNA Loading of the
Ago2 Complex
Hiresh Ayoubian,a,bNicole Ludwig,bTobias Fehlmann,cJennifer Menegatti,aLaura Gröger,bEleni Anastasiadou,d Pankaj Trivedi,eAndreas Keller,b,cEckart Meese,bFriedrich A. Grässera
aDepartment of Virology, Saarland University Medical School, Homburg, Germany
bDepartment of Human Genetics and Center of Human and Molecular Biology, Saarland University Medical School, Homburg, Germany
cChair for Clinical Bioinformatics, Saarland University, Saarbrücken, Germany
dDepartment of Pathology, Harvard Medical School, Boston, Massachusetts, USA
eDepartment of Experimental Medicine, La Sapienza University, Rome, Italy
ABSTRACT Diffuse large B-cell lymphoma (DLBCL) is an aggressive lymphoid tumor which is occasionally Epstein-Barr virus (EBV) positive and is further subtyped as acti-vated B-cell DLBCL (ABC-DLBCL) and germinal center B-cell DLBCL (GCB-DLBCL), which has implications for prognosis and treatment. We performed Ago2 RNA im-munoprecipitation followed by high-throughput RNA sequencing (Ago2-RIP-seq) to capture functionally active microRNAs (miRNAs) in EBV-negative ABC-DLBCL and GCB-DLBCL cell lines and their EBV-infected counterparts. In parallel, total miRNA profiles of these cells were determined to capture the cellular miRNA profile for comparison with the functionally active profile. Selected miRNAs with differential abundances were validated using real-time quantitative PCR (RT-qPCR) and Northern blotting. We found 6 miRNAs with differential abundances (2 upregulated and 4 downregulated miRNAs) between EBV-negative and -positive ABC-DLBCL cells and 12 miRNAs with differential abundances (3 upregulated and 9 downregulated miR-NAs) between EBV-negative and -positive GCB-DLBCL cells. Eight and twelve miRNAs were confirmed using RT-qPCR in ABC-DLBCL and GCB-DLBCL cells, respectively. Se-lected miRNAs were analyzed in additional type I/II versus type III EBV latency DLBCL cell lines. Furthermore, upregulation of miR-221-3p and downregulation of let7c-5p in ABC-DLBCL cells and upregulation of 363-3p and downregulation of miR-423-5p in GCB-DLBCL cells were verified using RIP-Northern blotting. Our compre-hensive sequence analysis of the DLBCL miRNA profiles identified sets of deregu-lated miRNAs by Ago2-RIP-seq. Our Ago2-IP-seq miRNA profile could be considered an important data set for the detection of deregulated functionally active miRNAs in DLBCLs and could possibly lead to the identification of miRNAs as biomarkers for the classification of DLBCLs or even as targets for personalized targeted treatment.
IMPORTANCE Diffuse large B-cell lymphoma (DLBCL) is a highly aggressive tumor of lymphoid origin which is occasionally Epstein-Barr virus (EBV) positive. MicroRNAs are found in most multicellular organisms and even in viruses such as EBV. They regulate the synthesis of proteins by binding to their cognate mRNA. MicroRNAs are tethered to their target mRNAs by “Argonaute” proteins. Here we compared the overall miRNA content of the Ago2 complex by differential loading to the overall content of miRNAs in two DLBCL cell lines and their EBV-converted counterparts. In all cell lines, the Ago2 load was different from the overall expression of miRNAs. In addition, the loading of the Ago2 complex was changed upon infection with EBV. This indicates that the virus not only changes the overall content of miRNAs but also influences the expression of proteins by affecting the Ago complexes.
CitationAyoubian H, Ludwig N, Fehlmann T,
Menegatti J, Gröger L, Anastasiadou E, Trivedi P, Keller A, Meese E, Grässer FA. 2019. Epstein-Barr virus infection of cell lines derived from diffuse large B-cell lymphomas alters microRNA loading of the Ago2 complex. J Virol 93:e01297-18.https://doi.org/10.1128/JVI .01297-18.
EditorJae U. Jung, University of Southern
California
Copyright© 2019 American Society for
Microbiology.All Rights Reserved. Address correspondence to Friedrich A. Grässer, [email protected]. E.M. and F.A.G. contributed equally to this work.
Received30 July 2018
Accepted5 November 2018
Accepted manuscript posted online14
November 2018 Published
crossm
17 January 2019
on November 6, 2019 by guest
http://jvi.asm.org/
KEYWORDS Ago-IP, Argonaute, DLBCL, Epstein-Barr virus, microRNA, profiling, sequencing
M
icroRNAs (miRNAs) are conserved, single-stranded, noncoding RNAs of 19 to 25nucleotide molecules in length that posttranscriptionally regulate gene expres-sion. In the context of tumorigenesis, miRNAs can function either as tumor suppressors or as oncogenes. They are bound to their target mRNA in RNA-induced silencing complexes (RISCs) through direct interaction with Argonaute proteins that tether the miRNA to their target mRNA (1). Binding of the miRNA to the target initially inhibits protein synthesis by reducing translation but eventually leads to degradation of the mRNA target (2).
Infection with EBV is serologically detectable in more than 95% of adults worldwide and occasionally results in infectious mononucleosis, a usually benign, self-limiting proliferation of monocytes. Although the viral infection generally has no further consequences for the infected individual, EBV can under some circumstances exert
oncogenic properties. This oncogenic potential is revealed byin vitrogrowth
transfor-mation of resting B cells into permanently growing lymphoblastoid cell lines (LCLs) (3). EBV is linked to B-cell lymphoproliferative disorders, including Burkitt’s lymphoma (BL), Hodgkin’s lymphoma (HL), and diffuse large B-cell lymphoma (DLBCL), the most common subtype of non-Hodgkin’s lymphomas (NHLs) (4), and epithelial tumors such as nasopharyngeal carcinoma (NPC) and gastric adenocarcinomas (5).
EBV was the first virus described to encode miRNAs (6). It encodes a total of 44 mature miRNAs derived from 25 precursors that are encoded in two clusters, one derived from the viral BART and the other derived from the BHRF1 segment (7). EBV infection changes the miRNA pattern of the host cell by expressing its own miRNAs and by disturbing the cellular miRNA profile (reviewed in reference 8).
The cellular and viral miRNA profiles of EBV-infected tumors such as NPC (9), HL (10), DLBCL (11), peripheral T-cell lymphoma (TCL) (12), nasal NK/T-cell lymphoma (NKTL) (13), gastric carcinoma (GC) (14), and posttransplant lymphoproliferative disease (PTLD) (15) have been analyzed in various publications. Several reports have shown that EBV-encoded miRNAs (EBV-miRNAs) play pivotal roles in the transformation of B cells (16) and also strongly modulate antiviral immunity (17).
It was demonstrated previously that the loading of miRNAs in the Ago complex better reflects their inhibitory potential, as loading might be 100-fold different from their relative presence in a given total cell RNA profile (18). Furthermore, the majority of miRNAs in resting tissues are predominantly found in low-molecular-weight com-plexes, not associated with mRNA, compared to growing cells, i.e., tumor tissue (19).
These observations prompted us to compare the RISC-associated miRNA expression
profiles of the EBV-negative (EBV⫺) DLBCL cell line U2932 and its EBV-converted
counterpart (U2932-EBV) and RISC loading and the overall change in miRNA expression to those of their EBV-infected counterparts. In the U2932-EBV cell line, viral miRNAs represented 1.3% of the total miRNA count. We show that Ago2 loading of miRNAs is changed upon EBV infection. To confirm this observation in a second cell line, the same analysis was carried out in the EBV-negative cell line SUDHL5 and its counterpart SUDHL5-EBV. Here the virus-encoded miRNAs in the Ago complex represent about 28% of all miRNAs, comparable to their relative abundance of about 23% of the total miRNA reads, thus replacing various cellular miRNAs from the Ago complex compared to the uninfected SUDHL5 cell line.
RESULTS
The aims of this study were (i) to determine the miRNA profile of the DLBCL cell line U2932 in comparison to its EBV-converted counterpart U2932-EBVclA (type I/II EBV latency) (here referred to as “U2932-EBV”) (“total miRNA profile”), (ii) to determine whether EBV infection had an influence on the loading of the Ago complex (“Ago profile”), and (iii) to compare the loading of the Ago2 complex of the individual cell
on November 6, 2019 by guest
http://jvi.asm.org/
and miRNAs isolated from their Ago2 complexes (“Ago bound”) were subjected to high-throughput sequencing. Because EBV conversion changed not only the miRNA profile of infected U2932-EBV cells but also the loading of the Ago2 complex, the same analysis was also subsequently carried out for the cell line SUDHL5 and its counterpart SUDHL5-EBVcl5 (EBV type III latency) (here referred to as “SUDHL5-EBV”). The Western blots of the immunoprecipitation (IP) of the Ago2 complexes (“Ago-IP”) and the corresponding control experiments for U2932/U2932-EBV and SUDHL5/SUDHL5-EBV cells are shown in Fig. 1A and B, respectively. The Ago2 protein was visible in the Ago2 precipitates but clearly absent in the control IP.
The overall results of the miRNA analysis are depicted in Table S1 in the supple-mental material. Below, the results for the two sets of cell lines are shown together for
clarity. We obtained between 1.81⫻106and 2.07⫻106miRNA reads, corresponding to
17.42% to 23.72% of the total reads in the profiling of the cell lines, while the
sequencing of the Ago-bound miRNAs yielded between 22.26⫻106and 38.16⫻106
miRNA reads, corresponding to 68.25% to 78.82% of all reads (Table S1). The analysis yielded between 713 and 851 different miRNAs in the total profile of the four cell lines and 1,102 to 1,372 different miRNAs in the Ago-IP. However, when a 0.1% cutoff for reasonably functional levels of miRNAs (18) was applied, only between 58 and 62 miRNAs remained in the total profile, and 50 to 57 of the cellular miRNAs remained the Ago-IP profile (Table S1). In the U2932 and U2932-EBV cells, the remaining 61 and 62 miRNAs represented 96.4% and 94.4% of the total miRNA counts, respectively, and in the SUDHL5-EBV and SUDHL5 cells, the remaining 58 and 59 miRNAs represented 73.3% and 97.0% of all reads above the 0.1% cutoff, respectively. In the EBV-positive
(EBV⫹) cell lines, the viral miRNAs represented 1.3% of all counts in the U2932-EBV cell
line, which is in type II latency, but 23.4% of the miRNA reads of SUDHL5-EBV cells (type III latency). Applying the 0.1% cutoff, only 6 EBV-miRNAs in the U2932-EBV cell line but 23 out of 44 known EBV-encoded miRNAs in the SUDHL5-EBV cell line remained above the 0.1% cutoff. Likewise, the EBV miRNAs represented 1.6% versus 28.2% of the Ago-associated EBV-miRNAs in U2932-EBV versus SUDHL5-EBV cells, respectively (see below).
Table 1 lists, in descending order, the top 15 miRNAs in the total pool of miRNAs in each individual cell line with respect to their overall abundances. For instance, miR-92a-3p had the highest overall expression levels in both U2932 and U2932-EBV cells, while miRNAs miR-142-5p and miR-21-5p represented 28.4 and 14.2% of all reads in SUDHL5 and SUDHL5-EBV cells, respectively. The complete list is shown in Table S2.
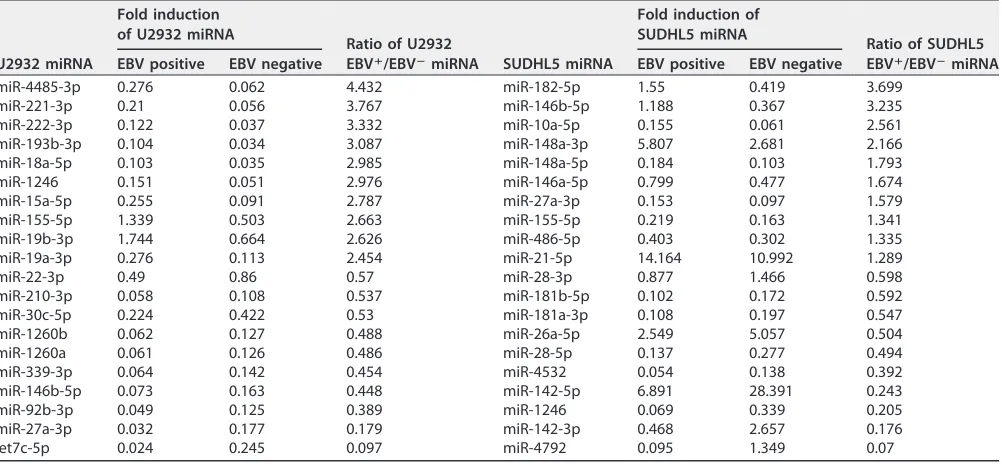
The top 20 induced or reduced miRNAs due to EBV infection in the total profiles are shown in Table 2. For instance, miR-4485-3p showed the strongest relative induction (4.4-fold), and miR-let7c-5p showed the strongest reduction (0.097-fold), in the total profile of U2932-EBV compared to U2932 cells, while miR-182-5p showed the strongest induction (3.6-fold), and miR-4792 showed the strongest reduction (0.07-fold), in SUDHL5-EBV compared to SUDHL5 cells. The complete list of enriched or depleted
miRNAs for the comparison of the two cell lines (EBV⫹versus EBV⫺) is shown in Table
S3.
Table 3 shows, in descending order, the top 15 miRNAs precipitated in the Ago2 complexes of the individual cell lines. Here miR-92a-3p represented the most prevalent Ago2-associated miRNA in both U2932 and U2932-EBV cells, whereas miR-21-5p was the most prevalent human miRNA in both SUDHL5 and SUDHL5-EBV cells. The com-plete list of all Ago2-bound miRNAs above the 0.1% cutoff is shown in Table S4. Note that ebv-miR-BHRF1-1, -BART8-5p, and -BART6-3p were among the 10 most prevalent Ago-bound miRNAs in SUDHL5-EBV cells, representing 7.03%, 4.15%, and 3.14% of Ago2-associated viral miRNAs, respectively, whereas in U2932-EBV cells, ebv-miR-BART8-5p represented only 0.42% of Ago2-associated viral miRNAs (see below).
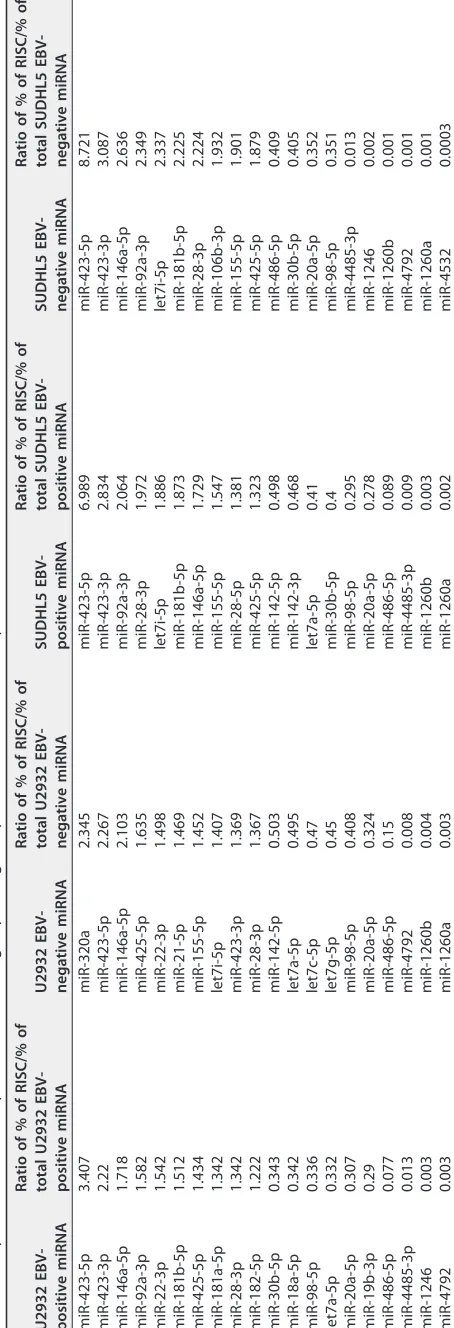
Finally, we compared the relative abundances of Ago2-bound miRNAs to their overall presence in the total profile. This is shown in Table 4. For instance, miR-423-5p was 8.7-fold enriched while miR-4532 was more than 3,000-fold depleted in
on November 6, 2019 by guest
http://jvi.asm.org/
FIG 1Western blot analysis of Ago2 immunoprecipitation. Extracts of EBV-infected and noninfected U2932 cells (A) and EBV-infected and noninfected SUDHL5 cells (B) were immunoprecipitated with Ago2-specific antibodies and isotype control antibodies, as indicated. Precipitated Ago2 protein was visualized with Ago2 antibody followed by mouse anti-rat IgG coupled to horseradish peroxidase. The blot was developed using enhanced chemilumines-cence (ECL). Markers on the left side of the blot indicate the positions of molecular mass marker proteins run on the same gel (prestain marker protein mix, catalog no. P77065S; New England Biolabs). The positions of the IgG heavy and light chains stained by secondary mouse anti-rat IgG coupled to horseradish peroxidase are indicated on the right side of the blot.
on November 6, 2019 by guest
http://jvi.asm.org/
[image:4.585.45.407.67.613.2]TABLE 1 Top 15 miRNAs in the U2932 and SUDHL5 cell lines and their EBV-positive counterparts in total cellular RNA U2932 miRNA % of total U2932 miRNA pool that is EBV positive U2932-EBV miRNA % of total U2932-EBV miRNA pool that is EBV negative SUDHL5 miRNA % of total SUDHL5 miRNA pool that is EBV positive SUDHL5-EBV miRNA % of total SUDHL5-EBV miRNA pool that is EBV negative miR-92a-3p 16.8 miR-92a-3p 17.2 miR-21-5p 14.2 miR-142-5p 28.4 miR-191-5p 9.2 miR-191-5p 11.6 miR-142-5p 6.9 miR-21-5p 11.0 miR-181a-5p 7.8 miR-148a-3p 8.4 miR-BHRF1-1 6.0 miR-181a-5p 5.6 miR-146a-5p 5.8 miR-181a-5p 7.1 miR-148a-3p 5.8 miR-26a-5p 5.1 miR-148a-3p 5.7 let7a-5p 4.6 miR-191-5p 4.9 miR-191-5p 4.1 miR-142-5p 5.2 miR-26a-5p 4.2 miR-181a-5p 3.6 miR-16-5p 3.6 miR-16-5p 3.9 miR-142-5p 3.9 miR-16-5p 3.3 miR-30d-5p 3.0 let7f-5p 3.6 let7f-5p 3.8 miR-BART10-3p 3.3 miR-92a-3p 3.0 let7a-5p 3.5 miR-146a-5p 3.4 miR-22-3p 3.2 let7a-5p 2.8 miR-30d-5p 3.4 miR-16-5p 3.1 miR-30d-5p 3.1 miR-22-3p 2.8 miR-26a-5p 2.9 miR-30d-5p 2.7 miR-BART8-5p 3.0 let7f-5p 2.7 miR-21-5p 2.6 miR-182-5p 2.6 let7a-5p 2.6 miR-148a-3p 2.7 miR-27b-3p 1.8 miR-30e-5p 1.7 let7f-5p 2.6 miR-142-3p 2.7 miR-19b-3p 1.7 miR-20a-5p 1.7 miR-26a-5p 2.5 miR-30e-5p 2.0 miR-182-5p 1.6 miR-27b-3p 1.6 miR-92a-3p 2.4 miR-28-3p 1.5
on November 6, 2019 by guest
http://jvi.asm.org/
[image:5.585.117.300.140.739.2]negative SUDHL5 cells. Of note, miR-423-3p and -5p were among those with the strongest Ago enrichment in the four cell lines analyzed. At 8.7-fold, miR-423-5p showed the strongest relative induction in SUDHL5-EBV cells. Conversely, the level of miR-486-5 was 2.4- to 12-fold decreased in these cell lines. miR-1260a/b, which is assumed to have oncogenic potential (20), was essentially absent from the Ago2 complex. We note that miR-142-3p and -5p, previously found to be affected by (presumably inactivating) mutations in DLBCLs (21, 22), showed a reduced presentation in the Ago complexes in both lines irrespective of EBV infection (Tables S5 and S6). The relative induction/depletion of all miRNAs above the 0.1% cutoff in U2932/U2932-EBV and SUDHL5/SUDHL5-EBV cells is shown in Tables S5 and S6, respectively.
Table S7 shows the relative induction/depletion of the Ago2-bound miRNAs above the 0.1% cutoff in the two pairs of cell lines with regard to EBV infection. Here EBV conversion resulted in a 2.53-fold increase in the level of Ago-bound miR-15a-5p in U2932-EBV cells and a 6.04-fold increase in Ago loading of miR-363-3p in SUDHL5-EBV cells.
We also determined which miRNAs were found exclusively in the total or the Ago-associated fraction in the four cell lines. The corresponding Venn diagrams are shown in Fig. S1A to D in the supplemental material. Applying the 0.1% cutoff, we found, for instance, that miR-363-3p was exclusively present in EBV-positive SUDHL5 cells, while miRNAs miR-15b-5p, -106b-3p, and -425-5p were exclusively found in the Ago2-bound fraction of EBV-negative SUDHL5 cells.
[image:6.585.44.545.83.315.2]Finally, the relative amounts of the EBV-encoded miRNAs are shown in Table S8. As pointed out above, the viral miRNAs represented 1.3% of the total miRNA count in U2932-EBV cells but 23.4% of the total miRNA count in the SUDHL5-EBV line. Accord-ingly, only 6 of the EBV miRNAs were found at a level above 0.1% of the total miRNAs in U2932-EBV cells, which accounted for about 1.65% of the Ago-bound miRNAs. In contrast, the 23 viral miRNAs above the 0.1% cutoff represented 28.2% of the Ago-bound miRNAs, indicating a slight overrepresentation versus the cellular miRNAs. The EBV-encoded miRNAs also showed a differential presentation within the Ago complex; for instance, the level of ebv-miR-BART11-3p was 2.14-fold increased and the level of ebv-miR-BART10-3p was about 2-fold decreased in the Ago complex of U2932-EBV cells, while the level of ebv-miR-BART6-3p was 2.83-fold increased and the level of ebv-miR-BART5-5p was about 3.4-fold decreased in SUDHL5-EBV cells (Table S9).
TABLE 2Top 20 induced/reduced miRNAs in the total cellular profile in EBV-positive versus -negative cell lines
U2932 miRNA
Fold induction of U2932 miRNA
Ratio of U2932
EBVⴙ/EBVⴚmiRNA SUDHL5 miRNA
Fold induction of SUDHL5 miRNA
Ratio of SUDHL5 EBVⴙ/EBVⴚmiRNA
EBV positive EBV negative EBV positive EBV negative
miR-4485-3p 0.276 0.062 4.432 miR-182-5p 1.55 0.419 3.699 miR-221-3p 0.21 0.056 3.767 miR-146b-5p 1.188 0.367 3.235 miR-222-3p 0.122 0.037 3.332 miR-10a-5p 0.155 0.061 2.561 miR-193b-3p 0.104 0.034 3.087 miR-148a-3p 5.807 2.681 2.166 miR-18a-5p 0.103 0.035 2.985 miR-148a-5p 0.184 0.103 1.793 miR-1246 0.151 0.051 2.976 miR-146a-5p 0.799 0.477 1.674 miR-15a-5p 0.255 0.091 2.787 miR-27a-3p 0.153 0.097 1.579 miR-155-5p 1.339 0.503 2.663 miR-155-5p 0.219 0.163 1.341 miR-19b-3p 1.744 0.664 2.626 miR-486-5p 0.403 0.302 1.335 miR-19a-3p 0.276 0.113 2.454 miR-21-5p 14.164 10.992 1.289 miR-22-3p 0.49 0.86 0.57 miR-28-3p 0.877 1.466 0.598 miR-210-3p 0.058 0.108 0.537 miR-181b-5p 0.102 0.172 0.592 miR-30c-5p 0.224 0.422 0.53 miR-181a-3p 0.108 0.197 0.547 miR-1260b 0.062 0.127 0.488 miR-26a-5p 2.549 5.057 0.504 miR-1260a 0.061 0.126 0.486 miR-28-5p 0.137 0.277 0.494 miR-339-3p 0.064 0.142 0.454 miR-4532 0.054 0.138 0.392 miR-146b-5p 0.073 0.163 0.448 miR-142-5p 6.891 28.391 0.243 miR-92b-3p 0.049 0.125 0.389 miR-1246 0.069 0.339 0.205 miR-27a-3p 0.032 0.177 0.179 miR-142-3p 0.468 2.657 0.176 let7c-5p 0.024 0.245 0.097 miR-4792 0.095 1.349 0.07
on November 6, 2019 by guest
http://jvi.asm.org/
TABLE 3 Top 15 miRNAs in U2932 and SUDHL5 cell lines and their EBV-positive counterparts by Ago2-miRNA profiling U2932 miRNA % of U2932 Ago2-IP miRNA pool that is EBV positive U2932-EBV miRNA % of U2932-EBV Ago2-IP miRNA pool that is EBV negative SUDHL5 miRNA % of SUDHL5 Ago2-IP miRNA pool that is EBV positive SUDHL5-EBV miRNA % of SUDHL5-EBV Ago2-IP miRNA pool that is EBV negative miR-92a-3p 26.6 miR-92a-3p 23.2 miR-21-5p 16.2 miR-21-5p 14.4 miR-181a-5p 10.4 miR-181a-5p 9.2 miR-BHRF1-1 7.0 miR-142-5p 13.4 miR-146a-5p 10.1 miR-148a-3p 7.2 miR-92a-3p 4.9 miR-181a-5p 8.8 miR-191-5p 5.4 miR-146a-5p 7.1 miR-148a-3p 4.2 miR-92a-3p 7.1 miR-16-5p 4.6 miR-191-5p 6.6 miR-BART8-5p 4.2 miR-26a-5p 6.3 miR-148a-3p 4.1 miR-26a-5p 4.3 miR-181a-5p 4.1 miR-16-5p 5.1 miR-30d-5p 3.2 miR-16-5p 3.6 miR-22-3p 3.9 miR-22-3p 4.8 miR-26a-5p 3.1 miR-182-5p 3.1 miR-142-5p 3.4 miR-191-5p 3.4 let7f-5p 2.7 miR-30d-5p 3.1 miR-16-5p 3.2 let7f-5p 3.3 miR-21-5p 2.6 let7f-5p 2.9 miR-BART6-3p 3.1 miR-28-3p 3.3 miR-142-5p 2.1 let7a-5p 2.3 miR-191-5p 2.9 miR-30d-5p 3.0 miR-182-5p 2.0 miR-21-5p 2.0 miR-30d-5p 2.6 miR-148a-3p 2.6 miR-27b-3p 1.9 miR-142-5p 1.9 let7f-5p 2.6 miR-423-5p 1.6 miR-155-5p 1.3 miR-27b-3p 1.7 miR-BART10-3p 2.5 miR-30e-5p 1.6 let7a-5p 1.2 miR-30e-5p 1.5 miR-26a-5p 2.2 miR-142-3p 1.5
on November 6, 2019 by guest
http://jvi.asm.org/
[image:7.585.117.300.187.740.2]TABLE 4 Top 20 enriched or depleted miRNAs in Ago2 profiling compared to the total cellular profile U2932 EBV-positive miRNA Ratio of % of RISC/% of total U2932 EBV-positive miRNA U2932 EBV-negative miRNA Ratio of % of RISC/% of total U2932 EBV-negative miRNA SUDHL5 EBV-positive miRNA Ratio of % of RISC/% of total SUDHL5 EBV-positive miRNA SUDHL5 EBV-negative miRNA Ratio of % of RISC/% of total SUDHL5 EBV-negative miRNA miR-423-5p 3.407 miR-320a 2.345 miR-423-5p 6.989 miR-423-5p 8.721 miR-423-3p 2.22 miR-423-5p 2.267 miR-423-3p 2.834 miR-423-3p 3.087 miR-146a-5p 1.718 miR-146a-5p 2.103 miR-92a-3p 2.064 miR-146a-5p 2.636 miR-92a-3p 1.582 miR-425-5p 1.635 miR-28-3p 1.972 miR-92a-3p 2.349 miR-22-3p 1.542 miR-22-3p 1.498 let7i-5p 1.886 let7i-5p 2.337 miR-181b-5p 1.512 miR-21-5p 1.469 miR-181b-5p 1.873 miR-181b-5p 2.225 miR-425-5p 1.434 miR-155-5p 1.452 miR-146a-5p 1.729 miR-28-3p 2.224 miR-181a-5p 1.342 let7i-5p 1.407 miR-155-5p 1.547 miR-106b-3p 1.932 miR-28-3p 1.342 miR-423-3p 1.369 miR-28-5p 1.381 miR-155-5p 1.901 miR-182-5p 1.222 miR-28-3p 1.367 miR-425-5p 1.323 miR-425-5p 1.879 miR-30b-5p 0.343 miR-142-5p 0.503 miR-142-5p 0.498 miR-486-5p 0.409 miR-18a-5p 0.342 let7a-5p 0.495 miR-142-3p 0.468 miR-30b-5p 0.405 miR-98-5p 0.336 let7c-5p 0.47 let7a-5p 0.41 miR-20a-5p 0.352 let7a-5p 0.332 let7g-5p 0.45 miR-30b-5p 0.4 miR-98-5p 0.351 miR-20a-5p 0.307 miR-98-5p 0.408 miR-98-5p 0.295 miR-4485-3p 0.013 miR-19b-3p 0.29 miR-20a-5p 0.324 miR-20a-5p 0.278 miR-1246 0.002 miR-486-5p 0.077 miR-486-5p 0.15 miR-486-5p 0.089 miR-1260b 0.001 miR-4485-3p 0.013 miR-4792 0.008 miR-4485-3p 0.009 miR-4792 0.001 miR-1246 0.003 miR-1260b 0.004 miR-1260b 0.003 miR-1260a 0.001 miR-4792 0.003 miR-1260a 0.003 miR-1260a 0.002 miR-4532 0.0003
on November 6, 2019 by guest
http://jvi.asm.org/
[image:8.585.95.322.73.737.2]Confirmation of NGS data by RT-qPCR. To validate the sequencing data, we analyzed the RNAs obtained from the cell lines by real-time quantitative PCR (RT-qPCR) for selected miRNAs that were present at 0.1% in at least one of the profiles. The results are shown in Fig. 2A and B for U2932 “total” and U2932 “Ago-IP.” Likewise, the results for SUDHL5-EBV compared to SUDHL5 cells are shown in Fig. 2C and D, respectively. In detail, we confirmed the upregulation of miR-10a-5p, -146a-5p, -221-3p, and -363-3p in U2932-EBV (total) fraction compared to U2932 cells and the upregulation of miR-10a-5p, -146a-miR-10a-5p, -155-miR-10a-5p, -221-3p, and -363-3p in SUDHL5-EBV (total) compared to SUDHL5 cells. Conversely, we confirmed the downregulation of miR-let7c-5p, -28-3p, -423-3p, and -92a-3p in the “total” miRNA of the U2932-EBV/U2932 pair and the downregulation of miR-15a-5p, -28-3p, -423-3p, 423-5p, and -92-3p in the SUDHL5-EBV/SUDHL5 pair. Furthermore, the upregulation of miRNAs in the Ago-IP was confirmed for U2932-EBV compared to U2932 cells for miRNAs miR-10a-5p, -146a-5p, -155-5p, -15a-5p, -221-3p,
FIG 2Validation of miRNA sequencing of U2932-EBV, U2932, SUDHL5-EBV, and SUDHL5 cells by RT-qPCR. Shown are comparisons of the U2932-EBV line versus U2032 (total miRNA profile) (A), U2932-EBV versus U2932 (profile of Ago2-bound miRNAs) (B), SUDHL5-EBV versus SUDHL5 (total miRNA profile) (C), and SUDHL5-EBV versus SUDHL5 (profile of Ago2-bound miRNAs) (D). The results for RNA sequencing were compared to the values obtained by RT-qPCR. NGS, next-generation sequencing.
on November 6, 2019 by guest
http://jvi.asm.org/
[image:9.585.46.520.97.518.2]-363-3p, -486-5p, and -92a-3p and for SUDHL5-EBV compared to SUDHL5 cells for miR-10a-5p, -146a-5p, -155-5p, -221-3p, and -363-3p. Conversely, the lower level of the Ago-bound miRNAs was confirmed for miR-let7c-5p and -28-3p in the U2932-EBV/ U2932 pair and for miR-let7c-5p, -15a-5p, -28-3p, -423-3p, -423-5p, -486-5p, and 92a-3p in SUDHL5-EBV compared to SUDHL5 cells.
Analysis of total and Ago-bound miRNAs by Northern blotting.To confirm some of the results of the sequence analysis by a second method, we assayed the RNA obtained from whole cells (“total RNA”) and the Ago2 precipitate (“Ago-IP”) by Northern blotting. Because it is not possible to include an internal control for the Ago-IP other than the isotype control antibody, we decided to test miRNAs that were either enriched or depleted in the total RNA or the Ago2-precipitated miRNAs. Equal amounts of RNA
from each pair of total RNA (20g/lane) or RNA from the Ago2-IP (200 ng/lane) were
loaded for the analysis. The RNA was isolated from the beads of the isotype control IP as for the RNA from the Ago2-IP. The control elute was suspended in the same amount of buffer, and the same volumes were loaded from the four cell lines for the Ago2-IP and the control IP. For U2932 and U2932-EBV cells, we assayed miR-221-3p and miR-let7c-5p. miR-221-3p was enriched in the total RNA of EBV-infected U2932 cells compared to U2932 cells by about 4-fold. However, miR-221-3p was depleted from the Ago2 complex by 1.8-fold in EBV-infected U2932 cells (0.21% of the total reads versus 0.114% of Ago2-bound miRNAs). This miRNA was also slightly depleted from the Ago2 complex in U2932 cells (0.056% of the total reads versus 0.045% of Ag2-bound miRNAs). As shown in Fig. 3A, the signal for this miRNA was much stronger in the virus-infected cells in both the total and the Ago2-bound fractions. Furthermore, no signal was obtained in the bands representing the isotype control for the Ago2 precipitation (Fig. 3A, left). The membrane was then stripped to remove the signal of miR-221-3p and probed with miR-let7c-5p, which had a 10-fold-higher representation in the total RNA of U2932 cells than in U2932-EBV cells (0.245% versus 0.024%, respectively). However, in both cell lines, this miRNA was also depleted from the Ago2 complex and the Ago2-bound miRNAs of noninfected U2932 cells by about 2-fold each, as the Ago2-bound RNAs represented 0.115% of miRNAs in U2932 cells and 0.013% in U2932-EBV cells. As shown in Fig. 3A, right, the signal for this miRNA was stronger in both the total and the Ago2-bound fractions.
SUDHL5 and SUDHL5-EBV cells were then tested for miR-423-5p and miR-363-3p. Sequencing of the total RNA revealed a slight reduction in the signal for miR-423-5p in the EBV-converted SUDHL5 cells compared to the SUDHL5 cells (0.138% versus 0.188%, respectively) but a strong increase in the Ago2-bound fraction in both cell lines. As shown in Table 3, the relative increase in the amount of Ago2-bound miR-423-5p was more than 8-fold in the EBV-negative SUDHL5 cells, and the relative increases in the Ago2-bound fraction versus the total fraction were still more than 6-fold in the SUDHL5-EBV cells. This was confirmed by Northern blotting, as shown in Fig. 3B. The signal for miR-363-3p showed the opposite behavior in that it was stronger in the total RNA of SUDHL5-EBV cells than in SUDHL5 cells, but the relative representation of the Ago2-bound fraction was not or only moderately increased by 1.1-fold in SUDHL5-EBV and by 1.3-fold in SUDHL5 cells. The resulting blot, shown in Fig. 3B, confirmed these data. In SUDHL5 and SUDHL5-EBV cells, miR-423-5p was present in only small amounts, while it was clearly enriched in the Ago2-precipitated miRNAs in both EBV-negative and -positive SUDHL5 cells but with a stronger relative signal in noninfected SUDHL5 cells. This result confirmed the strong relative loading of miR-423-5p compared to its overall low level in the four cell lines. In the reverse experiment, the signal for miR-363 was detectable only in SUDHL5-EBV cells and strongly present in the Ago2-IP, confirming its low abundance in SUDHL5 cells.
The U2932 line is considered to be an activated B-cell -type DLBCL (ABC-DLBCL), while SUDHL5 is a germinal center B-cell-type DLBCL (GCB-DLBCL) (23). Because the two cell lines U2932-EBVclA and SUDHL5-EBVcl5 used for miRNA sequencing analysis were in type I/II and type III latency, respectively, we analyzed the cell lines
on November 6, 2019 by guest
http://jvi.asm.org/
EBVcl2, which is in type III latency, and SUDHL5-EBVcl6, which is in type I/II latency, by RT-qPCR. In addition, the cell line SUDHL4 and its EBV-converted counterparts SUDHL4-EBVclB (type I/II latency) and SUDHL4-EBVcl7 (type III latency) were tested. Western blotting, shown in Fig. S2 in the supplemental material, was used to confirm type I/II
FIG 3Validation of total cell and Ago2-bound miRNA sequencing by Northern blotting. (A) Total RNA isolated from the U2932-EBV and U2932 cell lines (20g/lane) and RNA isolated from the Ago2 complexes of the same cell lines (200 ng/lane) were analyzed by Northern blotting using the probes for miR-221-3p and miR-let7c-5p, as indicated. The loading control is shown below the blots. Note that due to the small amount of RNA loaded from the Ago2-IP, no signals were obtained for the loading control. (B) Total RNA isolated from SUDHL5-EBV and SUDHL5 cells (20g/lane) and RNA isolated from the Ago2 complexes of the same cell lines (200 ng/lane) were analyzed by Northern blotting using the probes for miR-363-3p and miR-423-5p, as indicated. The loading control is shown below the blots. Note that due to the small amount of RNA loaded from the Ago2-IP, no signals were obtained for the loading control. EtBr, ethidium bromide.
on November 6, 2019 by guest
http://jvi.asm.org/
[image:11.585.54.360.69.586.2]latency (low EBNA2 level) versus type III latency (high EBNA2 level). We then isolated the total miRNA from these cells and subjected cell extracts to immunoprecipitation as described above; the immunoprecipitation with an isotype control antibody showed that the control precipitate did not contain Ago2, while the 11A9 antibody clearly precipitated Ago2 (data not shown). Figure S3A depicts the overall level of EBV miRNAs; the relative representation of these miRNAs in the Ago2 complexes is shown in Fig. S3B. U2932-EBVcl2 cells (type III latency) contained more EBV-miRNAs (Fig. S3, black bars) than did U2932-EBVclA cells (type I/II latency) (open bars), as did SUDHL5-EBVcl6 cells (type III latency) (black bars) compared to SUDHL5-EBVcl5 cells (type I/II latency) (white bars). In contrast, SUDHL4-EBVcl7 cells (type III latency) (black bars) showed a mixed picture in that some miRNAs in SUDHL4-clb cells (type I/II latency) (open bars) had the same or almost equal levels. Surprisingly, ebv-miR-BAHRF1-2 showed lower levels in type III than in type I/II latency. The comparison of the EBV-miRNAs in the Ago2 complex of U2932-EBVcl2 (type III) to those of U2932-EBVclA (type I/II latency) cells showed a higher level of Ago-bound EBV-miRNAs derived from either the BART or the BHRF1 cluster. The BHRF1-encoded miRNAs usually have higher expression levels in tumors in type III latency than those in type I/II latency. As there is Ago2 enrichment in U2932 cells in type III latency, this result indicates that a shift in Ago2 loading toward EBV-encoded miRNAs may also take place in the ABC-DLBCL-derived cell line U2932. The same tendency, but less pronounced, was observed in EBV-converted SUDHL4 cells, while the comparison of EBV-converted SUDHL5 cells showed relatively fewer Ago2-bound EBV miRNAs in type III latency than in type I/II latency.
With the same RNAs, we first analyzed the relative expression levels of the cellular miRNAs miR-let7c-5p, -221-3p, -363-3p, -486-5p, and 92a-3p both in the total extract and in the EBV convertants, as shown in Fig. S4A. Here we included noninfected cells in the comparison with EBV-infected cells. As already detected by miRNA sequencing, we observed a reduction of miR-let7c-5p levels in type I/II U2932-EBVclA cells but an increase in type III U2932-EBVcl2 cells (Fig. 2). A relative decrease of the miR-let7c-5p level in both type I/II and III latency was also detected in the EBV convertants of SUDHL4 and SUDHL5 cells, confirming the sequencing results for SUDHL5 versus SUDHL5-EBVcl5 cells. Induction as observed by RNA sequencing (RNA-seq) and previous RT-qPCR was seen with miRNAs miR-221-3p, -363-3p, and -486-5p for U2932 cells, while the miR-92a-3p level was also increased but not decreased as seen in the RNA-seq experiments depicted in Fig. 2. In SUDHL5 cells, we confirmed the strong increase of the miR-363-3p level in the type III convertant but a slight decrease in type I/II SUDHL5-EBVcl6 cells. Likewise, the decrease of the miR-486-5p level already seen by RT-qPCR in the first set of experiments (Fig. 2) was confirmed. The signals were low for both miR-221-3p and -92a-3p. In the SUDHL4 setting, the miR-let7c-5p level was decreased in both type I/II and III cells versus noninfected cells, again with low signals for miR-221-3p and decreases of the signals for miR-363, -486-5p, and also -92a-3p. We note the very strong signals for miR-486-5p in SUDHL4 cells and the convertants.
When looking at the Ago2-bound cellular miRNAs, we observed a relative loss of miR-let7c-5p in type I/II U2932-EBVclA cells, as seen by miRNA sequencing but an increase in Ago2 loading in type III U2932-EBVcl2 cells (Fig. S4B). In accordance with data from the sequencing experiments, we find increases in both type I/II and III convertant U2932 lines for miRNAs miR-221-3p, -363-3p, -486-5p, and also -92a-3p; the latter showed decreased Ago2 loading in the sequencing analysis. In SUDHL5 cells and the convertants, the levels of miRNAs miR-let7, -363-3p, -486-5p, and also -92a-3p were increased in the Ago2-bound fraction; very low signals for miR-221-3p were in line with low overall expression levels (Fig. S4A). In the SUDHL4 line and its convertants, we saw a decrease for miR-92a-3p, no or only slight increases for miR-let7c-5p and -221-3p, a strong increase for miR-363-3p, and very large amounts of Ago2-bound miR486-5p in SUDHL4 cells. Overall, miR-363-3p was strongly present in all Ago2-bound fractions by RT-qPCR.
We then carried out a pathway analysis where we compared the change in Ago2 loading due to EBV infection. These data are shown in Table S11. Viral infection resulted
on November 6, 2019 by guest
http://jvi.asm.org/
pathways like the insulin/IGF-1R/AKT-1, focal adhesion/fatty acid synthase (FAS), or JAK/STAT pathways, epidermal growth factor receptor (EGFR) signaling, and the DNA damage response (24–27), these pathways as well as signaling via AMPK/WNT, interleukin-7 (IL-7), IL-3, and the ErbB-2, B-cell, c-Kit, and platelet-derived growth factor (PDGF) receptors also appear to be activated by changes in Ago2 miRNA loading due to viral infection. For instance, it is well established that EBV has seized the Notch pathway via activation of RBPjK by EBNA2 (28). Finally, Table S12 shows the known and experimentally confirmed target genes of the miRNAs found in our study to have increased levels in the Ago2 complex due to infection with EBV.
DISCUSSION
The goals of the experiments described here were (i) to determine the miRNA profiles in two DLBCL cell lines and their EBV-converted counterparts and to determine the relative increase or decrease in the levels of miRNAs depending on viral infection and (ii) to analyze the loading of miRNAs in the Ago2 complex compared to their overall presence in the cell. First, we could confirm data from a previous study (18) which showed that there is a discrepancy in the overall presence of miRNAs in a cell compared to their presence in the Argonaute complex.
U2932 is an ABC-DLBCL-derived line, and SUDHL5 is a GCB-type DLBCL line. For primary tumors of the ABC and GCB subtypes and also some cell lines, the miRNA profiles have been established previously (for recent reviews, see references 4 and 29). Usually considered to be an ABC-type DLBCL (23), a recent analysis placed the U2932 cell line somewhat intermediately between the ABC and GCB subtypes of DLBCL (30). A comparison of the U2932 and SUDHL5 profiles generated here showed that 12 of the top 15 miRNAs identified in these studies, albeit at different ratios, were present in both U2932 and SUDHL5 cells (Table 2), and two additional miRNAs (miR-21-5p and -22-3p) were among the top 20 (see Table S2 in the supplemental material). Likewise, U2932-EBV and SUDHL5-U2932-EBV cells shared 11 of their top 15 miRNAs (Table 2). In SUDHL5-U2932-EBV cells, ebv-miR-BHRF1-1, -BART-10-3p, and BART8-5p were among the top 15, with 5.9%, 3.2%, and 2.9% of the total miRNA count. In contrast, in U2932-EBV cells, ebv-miR-BART10-3p, with 0.43% of the total, had the highest relative expression level of the EBV-miRNAs, and only 6 of the viral RNAs passed the 0.1% cutoff level (Table S3).
In comparison to a previous study where we compared the miRNA profiles of EBV⫹
versus EBV⫺primary DLBCLs from patients (11), we found a number of deregulated
miRNAs that matched the results of the present analysis. We observed the induction of miR-27b and miR-378 and the reduction of miR-151-3p as found in the primary tumors,
while miR-155, -221, and -222 were induced in the EBV⫹cell lines but reduced in the
primary tumors. A recent study by Hezaveh et al. (21) indicated that miR-143 is among the highly expressed miRNAs in Burkitt’s lymphoma (BL) as well as DLBCL. However, we found only small quantities overall and no enrichment in the Ago complex. This might be due to differences in the experimental procedures as well as the fact that primary tumors contain stromal cells/infiltrates in addition to tumor cells. Table S10 shows a list of miRNAs also found to be deregulated in other EBV-infected tumors, such as naso-pharyngeal carcinoma (NPC), Hodgkin’s lymphoma (HL), T-cell lymphoma (TCL), gastric carcinoma (GC), posttransplant lymphoproliferative disease (PTLD), BL, and nasal NK/ T-cell lymphoma (NKTL).
As predicted by a previous publication (18), we observed a discrepancy in the relative abundance of a given miRNA in the total versus the Ago-associated pool. For instance, the previous publication reported a strong relative increase of 59.33-fold for miR-197-3p (0.02% in the total fraction and 1.21% in the Ago-bound fraction) or a strong decrease of more than 30-fold for miR-1307-5p (0.34% in the total fraction and
0.03% in the Ago-bound fraction) in 293 cells. They also assayed in vitro
EBV-transformed LCLs but did not present detailed numbers for the LCLs.
We found a larger number of Ago2-associated miRNAs than with the total miRNA profiling, indicating that a substantial number of miRNAs are present in very small
on November 6, 2019 by guest
http://jvi.asm.org/
amounts that are detectable only due to their enrichment in the Ago2 complex. Thus, when we applied the 0.1% cutoff for presumably biologically “irrelevant or nonfunc-tional” miRNAs in the total pool due to their low abundance (18), we found that between 82 and 87% of the microRNAs that had a presentation of more than 0.1% in the total pool were also Ago2 associated (Table S1). However, in the SUDHL5-EBV line (which is in EBV latency type III), where viral miRNAs represented about 23% of all miRNAs and 28.2% of all Ago2-bound miRNAs, the viral miRNAs still represented 25.69% of all Ago2-associated miRNAs above the 0.1% cutoff. This indicates that under the type III latency conditions encountered, for instance, in EBV-associated PTLD, viral miRNAs might functionally displace a substantial amount of cellular miRNAs in addition to the dysregulation of cellular miRNA expression brought about by viral infection (31). In contrast, the EBV-encoded miRNAs in the U2932 cells, which were in type I or II latency (very low EBNA2 expression level [32]) represented only 1.6% of all Ago2-bound miRNAs. In contrast, the miRNA with the highest presence in the Ago2 complex was BHRF1-1, with more than 7% of all reads in SUDHL5-EBV cells, while ebv-miR-BART8-5p, the EBV-encoded miRNA with the highest number of reads, accounted for only 0.4% of Ago2-associated viral miRNAs in U2932-EBV cells (see, for instance, Table S8). Under type I or II latency conditions, the viral miRNAs might not displace the cellular miRNAs, but the presence of the virus nevertheless changes the overall expres-sion of certain cellular miRNAs (31). miR-15a-5p is found in the Ago-bound fraction of U2932 cells but at levels below 0.1% in the total fraction (Fig. S1). High expression levels of miR-15a-5p in conjunction with miR-16 and the miR-17-92 cluster, which were highly expressed in all cell lines, were previously described to result in poor prognosis for patients with acute myeloid leukemia (33). Also present in the Ago2 complex but below the 0.1% threshold in SUDHL5 cells was miR-106b-3p, which promotes cell cycle progression via p21/CDKN1A and might thus override a negative effect exerted by miR-15b-5p (34).
The analysis of the additional clones U2932-EBVcl2, which is in type III latency, and SUDHL5-EBVcl6 (type I/II latency) to complement their respective counterparts indi-cated that the increase in Ago2 loading of EBV-miRNAs due to EBV infection is not necessarily dependent on the GCB type of DLBCL but may also take place in ABC-DLBCLs. Conversely, we observed a relative loss of Ago2 loading in the SUDHL5 line when comparing type III to type I/II EBV latency. Our data indicate that viral infection leads to not only a change in overall expression but also a shift in Ago2 loading of the DLBCL lines analyzed. We point out that the conversion of the cell lines by EBV infection and subsequent growth of the cells under hygromycin selection might not reflect the situation in primary tumors. However, the scarcity of primary tumor tissues for this type of neoplasia and the fact that tumors are a mixture of stromal and tumor cells speak for the use of DLBCL lines and their virally infected counterparts.
In SUDHL5 cells, the strongest enrichment was 8.7-fold for miR-423-5p. We note that both miR-423-5p and -3p were among the top Ago2-enriched miRNAs in the four cell lines tested. miR-423 has been identified as a growth-promoting miRNA and was found to be overexpressed in various tumors (35). miR-423 downregulates the growth inhib-itor ING-4, which is also a target for the EBV-borne EBNA3C gene (36). miR-423-3p also targets the Bcl-2-interacting mediator of cell death (BIM), a tumor suppressor which is also targeted by the EBV-encoded EBNA3A/C proteins (37). Furthermore, exosomal miR-423 targets suppressor of fused protein (SUFU) in gastric carcinoma, leading to increased tumor growth and enhanced metastatic potential (38). EBV conversion resulted in a 6-fold enrichment of miR-363-3p in the Ago2 complex of SUDHL5-EBV cells, in contrast to SUDHL5 cells (Table S6). This miRNA is part of the oncogenic miR-106a-363 cluster (39). Also part of the miR-17-92 cluster of oncogenic miRNAs is miR-92, which is consistently found at high numbers in both the total as well as the Ago2-bound fractions of the four cell lines analyzed here. The enrichment of miRNAs in the Ago2 complex indicates that these miRNAs might have an important function for the transformed state. In noninfected U2932 cells, miR-320a and -15a-5p were strongly enriched in the Ago2 complex. However, miR-320a has been associated with
on November 6, 2019 by guest
http://jvi.asm.org/
miR-1260 from the Ago complexes in the four cell lines, in line with its association with Ago1 (41). This miRNA was shown to differentiate between GCB- and ABC-DLBCLs (42) and is considered to have oncogenic properties (43). We assume that the enrichment of growth-retarding miRNAs like miR-320a to a level only slightly above the 0.1% cutoff is offset by a rise of growth-promoting miRNAs, either by their overall level or by their Ago2 enrichment. Alternatively, a miRNA might have growth-promoting effects in one cell or tissue type but growth-retarding effects in other settings, as described previously for miR-26a (44). Table S12 shows the known, experimentally confirmed target genes for the 10 most upregulated miRNAs by Ago2 profiling when EBV-positive versus EBV-negative cells were compared.
EBV infection of both U2932 and SUDHL5 cells resulted in the loss of miRNAs from the Ago2 complex. For instance, miR-486-5p is strongly removed from the Ago2 complex in SUDHL5 cells and virtually absent from the Ago2 complex in the other three cell lines. It is consistently downregulated on a variety of tumors; for instance, miR-486-5p has been associated with tumor-suppressive behavior in hepatocellular carci-noma (45). Curiously, miR-486-5p is induced in NPC (46). Likewise, miR-1260 was almost completely depleted from the Ago2 complex; the expression of this miRNA, however, is increased in metastatic neuroblastoma cells (47). miR-142-3p and -5p were depleted by about 50% from the Ago2 pool in all four cell lines used in the present study. We have previously shown that miR-142 is mutated in about 20% of DLBCL cases; muta-tions in the seed region were found to affect its activity toward known targets (22). This mutation rate was later confirmed by another study (21). It is possible that mutations and/or depletion from the Ago2 complex could account for the loss of function. For instance, low miR-142 levels predicted a poor outcome in patients with gastric carci-noma (48). Downregulation of miR-142 was found in a large number of cases of acute myeloid leukemia (49), and miR-142 was shown to have tumor suppressor activity in osteosarcoma (50), highlighting a role for reduced levels of miR-142 in tumorigenesis. In summary, we show in two DLBCL cell lines that the overall levels of miRNAs are similar in that the top 10 to 15 miRNAs are in the same range of enrichment or depletion. Furthermore, EBV conversion changes the overall expression of miRNAs. In particular, the loading of the Ago2 complex is different from the overall expression of miRNAs, confirming previous observations (18) indicating that the overall amount of a miRNA within a cell line or in a given tissue does not necessarily reflect its presence in the Ago complex and, thus, its biological activity. Our data extend those previous observations in that a strong expression of viral miRNAs changes the composition of the Ago2 complexes, in that cell miRNAs are replaced by viral miRNAs. As mentioned above, large amounts of miRNAs in resting tissues are apparently present in inactive low-molecular-weight complexes (19), which might complicate the comparison of tumor specimens with their nontransformed tissues. This problem might be solved by
analyzing highly expressed miRNAs or their loss directly in tumor cells by in situ
hybridization or by recently developed single-cell sequencing procedures that might allow direct measurement of the miRNA content of (tumor) cells and detection of a possible heterogeneity of miRNAs in tumor cells (for a review, see reference 51).
MATERIALS AND METHODS
Cell lines and antibodies.The U2932, SUDHL4, and SUDHL5 cell lines and their EBV-converted counterparts (U2932-EBVclA [type I/II EBV latency], U2932-EBVcl2 [type III EBV latency], SUDHL4-EBVclB [type I/II EBV latency], SUDHL4-EBVcl7 [type III EBV latency], SUDHL5-EBVcl6 [type I/II EBV latency], and SUDHL5-EBVcl5 [type III EBV latency]) (11, 52) were maintained in RPMI 1640 GlutaMAX medium (Sigma, Munich, Germany) supplemented with 10% (vol/vol) fetal calf serum (FCS; Biochrom, Berlin, Germany) and antibiotics (40 IU/ml penicillin and 50g/ml streptomycin [Sigma, Munich, Germany], 1 IU/ml neomycin-sulfate [Roth, Karlsruhe, Germany], and 90 IU/ml nystatin [Fagroms, Barsbüttel, Germany]). Cells were kept at 37°C in a 5% CO2humidified environment. The growth medium for the EBV-converted lines was additionally supplemented with 200 mg/ml G418 (Invitrogen, ThermoFisher, Schwerte, Ger-many). Anti-Ago2 monoclonal antibody clone 11A9 (rat IgG2a) was a generous gift from Gunter Meister, University of Regensburg, Germany (53). Rat anti-EBNA2 monoclonal antibody R3 was described previ-ously (54). Mouse anti-glyceraldehyde-3-phosphate dehydrogenase (GAPDH) (clone 14C10) was obtained
on November 6, 2019 by guest
http://jvi.asm.org/
from Cell Signaling (Frankfurt am Main, Germany). Secondary antibodies were purchased from Sigma or Jackson Immuno Research (Dianova GmbH, Hamburg, Germany).
Immunoprecipitation and immunoblotting.Ago2-IP was performed as described previously (55). Briefly, 100l of Sepharose-protein G beads (GE Healthcare, Freiburg, Germany) was coupled overnight on a vertical rotator at 4°C with 1.6 ml hybridoma culture supernatant of Ago2 antibody 11A9 (rat IgG2a) or an irrelevant isotype control antibody (rat IgG2a). Coupled beads were then washed three times with phosphate-buffered saline (PBS) and once with lysis buffer (25 mM Tris-HCl [pH 7.4], 150 mM KCl, 2 mM EDTA, 0.5% IGEPAL, protease inhibitors [Complete mini; Roche, Berlin, Germany]). For immunoprecipi-tation, 3.5⫻108cells of the U2932 and SUDHL5 lines and their EBV-positive counterparts were pellet and washed in PBS three times. The pellet was lysed in 1.5 ml of lysis buffer for 30 min on a vertical rotator at 4°C. The lysate was then centrifuged at 20,000⫻gfor 30 min at 4°C. The lysate was then precleared with 100l of protein G-Sepharose beads for 60 min at 4°C in a vertical rotator to reduce nonspecific binding. Next, samples were centrifuged at 20,000⫻gfor 5 min at 4°C. One hundred microliters of the cleared lysate was removed to prepare total RNA and the protein input for Western blotting. The remainder was divided into two equal volumes for Ago2-IP and isotype control IP. The coupled beads were incubated with the lysate overnight on a vertical rotator at 4°C. The beads were washed three times with a buffer consisting of 50 mM Tris-HCl (pH 7.4), 300 mM KCl, 1 mM MgCl2, and 0.5% IGEPAL and once with PBS. Twenty-five microliters of each immunoprecipitate was removed and analyzed by immuno-blotting to check for the efficiency of Ago2. The remainder of the beads was suspended in 700l of Qiazol (Qiagen, Hilden, Germany) for RNA extraction.
RNA isolation.Total RNA was isolated from the total cellular lysate and immunoprecipitates using the miRNeasy kit (Qiagen, Hilden, Germany) according to the manufacturer’s instructions. RNA concen-tration and integrity were analyzed using a NanoDrop ND 2000 instrument (Thermo Scientific) and an Agilent 2100 instrument (Agilent small RNA kit, catalog no. 5067-1548).
Processing and analysis of deep sequencing data.Deep sequencing was carried out as described previously (56). The reads were first adapter trimmed and quality filtered with miRMaster (57). We then mapped all reads against the human genome (hg38) with one mismatch using Bowtie (58). All reads not mapping to the human genome were then used for the quantification of EBV miRNAs with miRMaster, while all reads that mapped were used to quantify human miRNAs. Briefly, reads were mapped against miRBase (v21) (59) while allowing one mismatch. To account for isomiRs, reads in a window of up to 2 nucleotides upstream and 5 nucleotides downstream of the annotated miRNA were considered.
Quantitative real-time PCR.For validation, we selected 12 deregulated miRNAs and performed RT-qPCR. In detail, reverse transcription of 200 ng from RNA from total lysates or 20 ng from immunoprecipitates was performed in a 20-l total volume using a miScript II RT kit (catalog no. 218161) according to the manufacturer’s instructions. Quantitative real-time PCR was set up in duplicates with 2l of a 1:10-diluted RT reaction mixture as the input for each PCR. Real-time PCR was carried out using a miScript SYBR green PCR kit (catalog no. 218076) on a StepOnePlus real-time PCR instrument (Life Technologies). As an endogenous control, we selected miR-30d, as previous experiments revealed no expression difference of miR-30d between EBV-positive and EBV-negative cell lysates or immunoprecipitates. The fold change in EBV-negative versus EBV-infected DLBCLs was calculated as 2[(miR-X EBV negative⫺miR-30d EBV negative)⫺(miR-X EBV positive⫺miR-30d EBV positive)]for the cellular input and Ago RNA, respectively. Deregulation of a miRNA was defined as validated if the miRNA showed at least a 2-fold expression difference between EBV-positive and EBV-negative probes and was deregulated in the same direction as in the sequencing data.
Targets of all miRNAs were extracted from Tarbase v8 (60). The pathway enrichment analysis of the miRNAs was performed using miEAA (61), andPvalues were adjusted according to the Benjamini-Hochberg procedure (62). The miRNAs were inputted in sorted order according to the fold change of their median expression values.
Northern blotting.Equal amounts of extracted RNA from the total cellular lysate (15 to 20g) or Ago2-IP and the isotype control (200 ng of purified RNA) were loaded onto 12.5% urea–polyacrylamide gels and analyzed as described previously (13).
SUPPLEMENTAL MATERIAL
Supplemental material for this article may be found at https://doi.org/10.1128/JVI
.01297-18.
SUPPLEMENTAL FILE 1,PDF file, 1.43 MB.
ACKNOWLEDGMENTS
H.A. was supported by grant GR950/16-1 to F.A.G. by the Deutsche Forschungsge-meinschaft (DFG).
We thank Ruth Nord for excellent technical assistance.
REFERENCES
1. Ambros V. 2004. The functions of animal microRNAs. Nature 431: 350 –355.https://doi.org/10.1038/nature02871.
2. Meister G. 2013. Argonaute proteins: functional insights and
emerg-ing roles. Nat Rev Genet 14:447– 459. https://doi.org/10.1038/ nrg3462.
3. Rickinson AB, Kieff E. 2007. Epstein-Barr virus, p 2655–2700.InKnipe DM,
on November 6, 2019 by guest
http://jvi.asm.org/
Fields virology, 5th ed, vol 2. Lippincott Williams & Wilkins, Philadelphia, PA. 4. Mugnaini EN, Ghosh N. 2016. Lymphoma. Prim Care 43:661– 675.https://
doi.org/10.1016/j.pop.2016.07.012.
5. Delecluse HJ, Feederle R, O’Sullivan B, Taniere P. 2007. Epstein Barr virus-associated tumours: an update for the attention of the working pathologist. J Clin Pathol 60:1358 –1364. https://doi.org/10.1136/jcp .2006.044586.
6. Pfeffer S, Zavolan M, Grasser FA, Chien M, Russo JJ, Ju J, John B, Enright AJ, Marks D, Sander C, Tuschl T. 2004. Identification of virus-encoded microRNAs. Science 304:734 –736. https://doi.org/10 .1126/science.1096781.
7. Grundhoff A, Sullivan CS, Ganem D. 2006. A combined computational and microarray-based approach identifies novel microRNAs encoded by human gamma-herpesviruses. RNA 12:733–750.https://doi.org/10.1261/ rna.2326106.
8. Klinke O, Feederle R, Delecluse HJ. 2014. Genetics of Epstein-Barr virus microRNAs. Semin Cancer Biol 26:52–59. https://doi.org/10 .1016/j.semcancer.2014.02.002.
9. Zhu JY, Pfuhl T, Motsch N, Barth S, Nicholls J, Grasser F, Meister G. 2009. Identification of novel Epstein-Barr virus microRNA genes from nasopha-ryngeal carcinomas. J Virol 83:3333–3341.https://doi.org/10.1128/JVI .01689-08.
10. Navarro A, Gaya A, Martinez A, Urbano-Ispizua A, Pons A, Balague O, Gel B, Abrisqueta P, Lopez-Guillermo A, Artells R, Montserrat E, Monzo M. 2008. MicroRNA expression profiling in classic Hodgkin lymphoma. Blood 111:2825–2832.https://doi.org/10.1182/blood-2007-06-096784. 11. Imig J, Motsch N, Zhu JY, Barth S, Okoniewski M, Reineke T, Tinguely M,
Faggioni A, Trivedi P, Meister G, Renner C, Grässer FA. 2011. MicroRNA profiling in Epstein-Barr virus-associated B-cell lymphoma. Nucleic Acids Res 39:1880 –1893.https://doi.org/10.1093/nar/gkq1043.
12. Jun SM, Hong YS, Seo JS, Ko YH, Yang CW, Lee SK. 2008. Viral microRNA profile in Epstein-Barr virus-associated peripheral T cell lymphoma. Br J Haematol 142:320 –323.https://doi.org/10.1111/j.1365-2141.2008.07186.x. 13. Alles J, Menegatti J, Motsch N, Hart M, Eichner N, Reinhardt R, Meister G,
Grasser FA. 2016. miRNA expression profiling of Epstein-Barr virus-associated NKTL cell lines by Illumina deep sequencing. FEBS Open Bio 6:251–263.https://doi.org/10.1002/2211-5463.12027.
14. Shinozaki-Ushiku A, Kunita A, Isogai M, Hibiya T, Ushiku T, Takada K, Fukayama M. 2015. Profiling of virus-encoded microRNAs in Epstein-Barr virus-associated gastric carcinoma and their roles in gastric carcinogen-esis. J Virol 89:5581–5591.https://doi.org/10.1128/JVI.03639-14. 15. Fink SE, Gandhi MK, Nourse JP, Keane C, Jones K, Crooks P, Johrens K,
Korfel A, Schmidt H, Neumann S, Tiede A, Jager U, Duhrsen U, Neuhaus R, Dreyling M, Borchert K, Sudhoff T, Riess H, Anagnostopoulos I, Trappe RU. 2014. A comprehensive analysis of the cellular and EBV-specific microRNAome in primary CNS PTLD identifies different patterns among EBV-associated tumors. Am J Transplant 14:2577–2587.https://doi.org/ 10.1111/ajt.12858.
16. Feederle R, Linnstaedt SD, Bannert H, Lips H, Bencun M, Cullen BR, Delecluse HJ. 2011. A viral microRNA cluster strongly potentiates the transforming properties of a human herpesvirus. PLoS Pathog 7:e1001294.https://doi.org/10.1371/journal.ppat.1001294.
17. Albanese M, Tagawa T, Buschle A, Hammerschmidt W. 2017. MicroRNAs of Epstein-Barr virus control innate and adaptive antiviral immunity. J Virol 91:e01667-16.https://doi.org/10.1128/JVI.01667-16.
18. Flores O, Kennedy EM, Skalsky RL, Cullen BR. 2014. Differential RISC association of endogenous human microRNAs predicts their inhibitory potential. Nucleic Acids Res 42:4629 – 4639.https://doi.org/10.1093/nar/ gkt1393.
19. La Rocca G, Olejniczak SH, Gonzalez AJ, Briskin D, Vidigal JA, Spraggon L, DeMatteo RG, Radler MR, Lindsten T, Ventura A, Tuschl T, Leslie CS, Thompson CB. 2015. In vivo, Argonaute-bound microRNAs exist pre-dominantly in a reservoir of low molecular weight complexes not asso-ciated with mRNA. Proc Natl Acad Sci U S A 112:767–772.https://doi .org/10.1073/pnas.1424217112.
20. Hirata H, Hinoda Y, Shahryari V, Deng G, Tanaka Y, Tabatabai ZL, Dahiya R. 2014. Genistein downregulates onco-miR-1260b and upregulates sFRP1 and Smad4 via demethylation and histone modification in pros-tate cancer cells. Br J Cancer 110:1645–1654.https://doi.org/10.1038/bjc .2014.48.
21. Hezaveh K, Kloetgen A, Bernhart SH, Mahapatra KD, Lenze D, Richter J, Haake A, Bergmann AK, Brors B, Burkhardt B, Claviez A, Drexler HG, Eils R, Haas S, Hoffmann S, Karsch D, Klapper W, Kleinheinz K, Korbel J,
Mantovani-Loeffler L, Lopez C, McHardy AC, Moller P, Rohde M, Rosen-stiel P, Rosenwald A, Schilhabel M, Schlesner M, Scholz I, Stadler PF, Stilgenbauer S, Sungalee S, Szczepanowski M, Trumper L, Weniger MA, Siebert R, Borkhardt A, Hummel M, Hoell JI, ICGC MMML-Seq Project. 2016. Alterations of microRNA and microRNA-regulated messenger RNA expression in germinal center B-cell lymphomas determined by integra-tive sequencing analysis. Haematologica 101:1380 –1389. https://doi .org/10.3324/haematol.2016.143891.
22. Kwanhian W, Lenze D, Alles J, Motsch N, Barth S, Doll C, Imig J, Hummel M, Tinguely M, Trivedi P, Lulitanond V, Meister G, Renner C, Grasser FA. 2012. MicroRNA-142 is mutated in about 20% of diffuse large B-cell lymphoma. Cancer Med 1:141–155.https://doi.org/10.1002/cam4.29. 23. Davis RE, Ngo VN, Lenz G, Tolar P, Young RM, Romesser PB, Kohlhammer
H, Lamy L, Zhao H, Yang Y, Xu W, Shaffer AL, Wright G, Xiao W, Powell J, Jiang JK, Thomas CJ, Rosenwald A, Ott G, Muller-Hermelink HK, Gascoyne RD, Connors JM, Johnson NA, Rimsza LM, Campo E, Jaffe ES, Wilson WH, Delabie J, Smeland EB, Fisher RI, Braziel RM, Tubbs RR, Cook JR, Weisenburger DD, Chan WC, Pierce SK, Staudt LM. 2010. Chronic active B-cell-receptor signalling in diffuse large B-cell lymphoma. Nature 463:88 –92.https://doi.org/10.1038/nature08638.
24. Zhou X, Fang X, Jiang Y, Geng L, Li X, Li Y, Lu K, Li P, Lv X, Wang X. 2017. Klotho, an anti-aging gene, acts as a tumor suppressor and inhibitor of IGF-1R signaling in diffuse large B cell lymphoma. J Hematol Oncol 10:37.
https://doi.org/10.1186/s13045-017-0391-5.
25. Wasil LR, Shair KH. 2015. Epstein-Barr virus LMP1 induces focal adhesions and epithelial cell migration through effects on integrin-alpha5 and N-cadherin. Oncogenesis 4:e171.https://doi.org/10.1038/oncsis.2015.31. 26. Gires O, Kohlhuber F, Kilger E, Baumann M, Kieser A, Kaiser C, Zeidler R, Scheffer B, Ueffing M, Hammerschmidt W. 1999. Latent membrane protein 1 of Epstein-Barr virus interacts with JAK3 and activates STAT proteins. EMBO J 18:3064 –3073. https://doi.org/10.1093/emboj/18.11 .3064.
27. Charalambous CT, Hannigan A, Tsimbouri P, McPhee GM, Wilson JB. 2007. Latent membrane protein 1-induced EGFR signalling is negatively regulated by TGF alpha prior to neoplasia. Carcinogenesis 28: 1839 –1848.https://doi.org/10.1093/carcin/bgm055.
28. Kempkes B, Ling PD. 2015. EBNA2 and its coactivator EBNA-LP. Curr Top Microbiol Immunol 391:35–59.https://doi.org/10.1007/978-3-319-22834 -1_2.
29. Ni H, Tong R, Zou L, Song G, Cho WC. 2016. MicroRNAs in diffuse large B-cell lymphoma. Oncol Lett 11:1271–1280.https://doi.org/10.3892/ol .2015.4064.
30. Deeb SJ, D’Souza RC, Cox J, Schmidt-Supprian M, Mann M. 2012. Super-SILAC allows classification of diffuse large B-cell lymphoma subtypes by their protein expression profiles. Mol Cell Proteomics 11:77– 89.https:// doi.org/10.1074/mcp.M111.015362.
31. Cameron JE, Fewell C, Yin Q, McBride J, Wang X, Lin Z, Flemington EK. 2008. Epstein-Barr virus growth/latency III program alters cellular mi-croRNA expression. Virology 382:257–266.https://doi.org/10.1016/j.virol .2008.09.018.
32. Boccellato F, Anastasiadou E, Rosato P, Kempkes B, Frati L, Faggioni A, Trivedi P. 2007. EBNA2 interferes with the germinal center phenotype by downregulating BCL6 and TCL1 in non-Hodgkin’s lymphoma cells. J Virol 81:2274 –2282.https://doi.org/10.1128/JVI.01822-06.
33. Gao X, Zhang R, Qu X, Zhao M, Zhang S, Wu H, Jianyong L, Chen L. 2012. miR-15a, miR-16-1 and miR-17-92 cluster expression are linked to poor prognosis in multiple myeloma. Leuk Res 36:1505–1509.https://doi.org/ 10.1016/j.leukres.2012.08.021.
34. Ivanovska I, Ball AS, Diaz RL, Magnus JF, Kibukawa M, Schelter JM, Kobayashi SV, Lim L, Burchard J, Jackson AL, Linsley PS, Cleary MA. 2008. MicroRNAs in the miR-106b family regulate p21/CDKN1A and promote cell cycle progression. Mol Cell Biol 28:2167–2174.https://doi.org/10 .1128/MCB.01977-07.
35. Farazi TA, Spitzer JI, Morozov P, Tuschl T. 2011. miRNAs in human cancer. J Pathol 223:102–115.https://doi.org/10.1002/path.2806.
36. Li S, Zeng A, Hu Q, Yan W, Liu Y, You Y. 2017. miR-423-5p contributes to a malignant phenotype and temozolomide chemoresistance in glioblas-tomas. Neuro Oncol 19:55– 65.https://doi.org/10.1093/neuonc/now129. 37. Kong P, Zhu X, Geng Q, Xia L, Sun X, Chen Y, Li W, Zhou Z, Zhan Y, Xu D. 2017. The microRNA-423-3p-Bim axis promotes cancer progression and activates oncogenic autophagy in gastric cancer. Mol Ther 25: 1027–1037.https://doi.org/10.1016/j.ymthe.2017.01.013.
38. Yang H, Fu H, Wang B, Zhang X, Mao J, Li X, Wang M, Sun Z, Qian H, Xu
on November 6, 2019 by guest
http://jvi.asm.org/
W. 23 May 2018. Exosomal miR-423-5p targets SUFU to promote cancer growth and metastasis and serves as a novel marker for gastric cancer. Mol Carcinoghttps://doi.org/10.1002/mc.22838.
39. Landais S, Landry S, Legault P, Rassart E. 2007. Oncogenic potential of the miR-106-363 cluster and its implication in human T-cell leukemia. Cancer Res 67:5699 –5707. https://doi.org/10.1158/0008-5472.CAN-06 -4478.
40. Zhao H, Dong T, Zhou H, Wang L, Huang A, Feng B, Quan Y, Jin R, Zhang W, Sun J, Zhang D, Zheng M. 2014. miR-320a suppresses colorectal cancer progression by targeting Rac1. Carcinogenesis 35:886 – 895.
https://doi.org/10.1093/carcin/bgt378.
41. Venkatesh T, Suresh PS, Tsutsumi R. 2016. tRFs: miRNAs in disguise. Gene 579:133–138.https://doi.org/10.1016/j.gene.2015.12.058.
42. Bradshaw G, Sutherland HG, Haupt LM, Griffiths LR. 2016. Dysregulated microRNA expression profiles and potential cellular, circulating and polymorphic biomarkers in non-Hodgkin lymphoma. Genes (Basel) 7:E130.https://doi.org/10.3390/genes7120130.
43. Xu L, Li L, Li J, Li H, Shen Q, Ping J, Ma Z, Zhong J, Dai L. 2015. Overexpression of miR-1260b in non-small cell lung cancer is associated with lymph node metastasis. Aging Dis 6:478 – 485.https://doi.org/10 .14336/AD.2015.0620.
44. Huse JT, Holland EC. 2009. Yin and yang: cancer-implicated miRNAs that have it both ways. Cell Cycle 8:3611–3612.https://doi.org/10.4161/cc.8 .22.9893.
45. Fu SJ, Chen J, Ji F, Ju WQ, Zhao Q, Chen MG, Guo ZY, Wu LW, Ma Y, Wang DP, Zhu XF, He XS. 5 May 2017. miR-486-5p negatively regulates onco-genic NEK2 in hepatocellular carcinoma. Oncotargethttps://doi.org/10 .18632/oncotarget.17635.
46. Wong AM, Kong KL, Tsang JW, Kwong DL, Guan XY. 2012. Profiling of Epstein-Barr virus-encoded microRNAs in nasopharyngeal carcinoma reveals potential biomarkers and oncomirs. Cancer 118:698 –710.https:// doi.org/10.1002/cncr.26309.
47. Khan FH, Pandian V, Ramraj S, Aravindan S, Herman TS, Aravindan N. 2015. Reorganization of metastamiRs in the evolution of metastatic aggressive neuroblastoma cells. BMC Genomics 16:501.https://doi.org/ 10.1186/s12864-015-1642-x.
48. Zhang X, Yan Z, Zhang J, Gong L, Li W, Cui J, Liu Y, Gao Z, Li J, Shen L, Lu Y. 2011. Combination of hsa-miR-375 and hsa-miR-142-5p as a pre-dictor for recurrence risk in gastric cancer patients following surgical resection. Ann Oncol 22:2257–2266. https://doi.org/10.1093/annonc/ mdq758.
49. Wang F, Wang XS, Yang GH, Zhai PF, Xiao Z, Xia LY, Chen LR, Wang Y, Wang XZ, Bi LX, Liu N, Yu Y, Gao D, Huang BT, Wang J, Zhou DB, Gong JN, Zhao HL, Bi XH, Yu J, Zhang JW. 2012. miR-29a and miR-142-3p downregulation and diagnostic implication in human acute myeloid leukemia. Mol Biol Rep 39:2713–2722.https://doi.org/10.1007/s11033 -011-1026-5.
50. Zheng Z, Ding M, Ni J, Song D, Huang J, Wang J. 2015. miR-142 acts as a tumor suppressor in osteosarcoma cell lines by targeting Rac1. Oncol Rep 33:1291–1299.https://doi.org/10.3892/or.2014.3687.
51. Papalexi E, Satija R. 2018. Single-cell RNA sequencing to explore immune cell heterogeneity. Nat Rev Immunol 18:35– 45.https://doi.org/10.1038/ nri.2017.76.
52. Amini RM, Berglund M, Rosenquist R, Von Heideman A, Lagercrantz S, Thunberg U, Bergh J, Sundstrom C, Glimelius B, Enblad G. 2002. A novel B-cell line (U-2932) established from a patient with diffuse large B-cell lymphoma following Hodgkin lymphoma. Leuk Lymphoma 43: 2179 –2189.https://doi.org/10.1080/1042819021000032917.
53. Rudel S, Flatley A, Weinmann L, Kremmer E, Meister G. 2008. A multi-functional human Argonaute2-specific monoclonal antibody. RNA 14: 1244 –1253.https://doi.org/10.1261/rna.973808.
54. Kremmer E, Kranz B, Hille A, Klein K, Eulitz M, Hoffmann-Fezer G, Feiden W, Herrmann K, Delecluse H-J, Delsol G, Bornkamm GW, Mueller-Lantzsch N, Grässer FA. 1995. Rat monoclonal antibodies differentiating between the Epstein-Barr virus nuclear antigens 2A (EBNA2A) and 2B (EBNA2B). Virology 208:336 –342.https://doi.org/10.1006/viro.1995.1157. 55. Dolken L, Malterer G, Erhard F, Kothe S, Friedel CC, Suffert G, Marci-nowski L, Motsch N, Barth S, Beitzinger M, Lieber D, Bailer SM, Hoffmann R, Ruzsics Z, Kremmer E, Pfeffer S, Zimmer R, Koszinowski UH, Grässer F, Meister G, Haas J. 2010. Systematic analysis of viral and cellular mi-croRNA targets in cells latently infected with human gamma-herpesviruses by RISC immunoprecipitation assay. Cell Host Microbe 7:324 –334.https://doi.org/10.1016/j.chom.2010.03.008.
56. Leidinger P, Hart M, Backes C, Rheinheimer S, Keck B, Wullich B, Keller A, Meese E. 29 January 2016. Differential blood-based diagnosis between benign prostatic hyperplasia and prostate cancer: miRNA as source for biomarkers independent of PSA level, Gleason score, or TNM status. Tumour Biolhttps://doi.org/10.1007/s13277-016-4883-7.
57. Fehlmann T, Meese E, Keller A. 2017. Exploring ncRNAs in Alzheimer’s disease by miRMaster. Oncotarget 8:3771–3772. https://doi.org/10 .18632/oncotarget.14054.
58. Langmead B, Trapnell C, Pop M, Salzberg SL. 2009. Ultrafast and memory-efficient alignment of short DNA sequences to the human genome. Genome Biol 10:R25.https://doi.org/10.1186/gb-2009-10-3-r25. 59. Kozomara A, Griffiths-Jones S. 2014. miRBase: annotating high confi-dence microRNAs using deep sequencing data. Nucleic Acids Res 42: D68 –D73.https://doi.org/10.1093/nar/gkt1181.
60. Karagkouni D, Paraskevopoulou MD, Chatzopoulos S, Vlachos IS, Tast-soglou S, Kanellos I, Papadimitriou D, Kavakiotis I, Maniou S, Skoufos G, Vergoulis T, Dalamagas T, Hatzigeorgiou AG. 2018. DIANA-TarBase v8: a decade-long collection of experimentally supported miRNA-gene inter-actions. Nucleic Acids Res 46:D239 –D245.https://doi.org/10.1093/nar/ gkx1141.
61. Backes C, Khaleeq QT, Meese E, Keller A. 2016. miEAA: microRNA enrich-ment analysis and annotation. Nucleic Acids Res 44:W110 –W116.
https://doi.org/10.1093/nar/gkw345.
62. Banjamini Y, Hochberg Y. 1995. Controlling the false discovery rate: a practical and powerful approach to multiple testing. J R Stat Soc 57: 289 –300.