ENG4112 – Research Project Part 2 &
ENG4111 – Research Project 1
Improving Project Delivery: Through the
Application of Project Management
Techniques
Submitted By:
Aron Molloy
Student Number:
0061021071
Submitted On:
13/10/2016
DECLARATION: I declare that:
• No part of this assignment has been copied from any other person’s work or from any other source except where due acknowledgment is made in the assignment, and
i
ABSTRACT
Substantial investment was made in Australian water infrastructure in the post war period in the 1950’s and 1960’s. Much of this infrastructure is now reaching the end of its usable life
and will need to be replaced in the near future. However, in the preceding years a shift has
occurred in the water industry from a government subsidized industry to user pays businesses
(Coombs & Roberts 2007).
Many regional centers have also seen decreases in population. The infrastructure that was
needed to supply water to a large population is now being used to supply only a fraction of
the users for which the supply network was designed (Hicks & Woods 2010). However, the
outer edges of the supply network have not changed, water is pumped from a source to be
treated, distributed, collected as waste water and treated at a waste water treatment facility.
The infrastructure owned by water authorities is diverse in nature, spanning Civil (pipelines),
Mechanical (pumps), Electrical (control systems), Chemical (water treatment) and
Environmental (waste water) Engineering disciplines (Rokstad, M, Ugarelli, R 2015). Each
discipline knows intrinsically well the importance of their own field of expertise, however,
this can often be hard to convey to a colleague in another field.
In this business environment of falling revenue and population bases, diverse and aging
infrastructure profiles it is necessary that Capital Expenditure (CAPEX) projects are
delivered on time and on budget. Furthermore, managing projects over a diverse range of
fields can be a complex proposition which can lead to failed project delivery and increased
project costs.
To deliver projects in a timely manner it is important that organisation’s undertake their
project work using proven project management techniques. Tracking the progress of the
project through the use of ‘Key Performance Indicators’ (KPI’s) and ‘Project Dashboards’
will ensure that the project is delivered on time, on budget and meet the expectations of the
ii
University of Southern Queensland
Faculty of Health, Engineering and Sciences
ENG4111/ENG4112 Research Project
LIMITATIONS OF USE
The Council of the University of Southern Queensland, its Faculty of Health, Engineering
& Sciences, and the staff of the University of Southern Queensland, do not accept any
responsibility for the truth, accuracy or completeness of material contained within or
associated with this dissertation.
Persons using all or any part of this material do so at their own risk, and not at the risk of the
Council of the University of Southern Queensland, its Faculty of Health, Engineering &
Sciences or the staff of the University of Southern Queensland.
This dissertation reports an educational exercise and has no purpose or validity beyond this exercise. The sole purpose of the course pair entitled “Research Project” is to contribute to the overall education within the student’s chosen degree program. This document, the
associated hardware, software, drawings, and other material set out in the associated
appendices should not be used for any other purpose: if they are so used, it is entirely at the
iii
University of Southern Queensland
Faculty of Health, Engineering and Sciences
ENG4111/ENG4112 Research Project
CERTIFICATION
I certify that the ideas, designs and experimental work, results, analyses and conclusions set
out in this dissertation are entirely my own effort, except where otherwise indicated and acknowledged.
I further certify that the work is original and has not been previously submitted for
assessment in any other course or institution, except where specifically stated.
Aron Molloy
iv
ACKNOWLEDGEMENTS
I would like to acknowledge and thank all the people whom have given guidance, support,
assistance and their advice to aid in the completion of this dissertation. The completion of
this dissertation has been made, at times, an almost enjoyable task through the input of
numerous people.
To my supervisor Mr Bob Fulcher, a sincere, thank you. Your guidance throughout this
process has been outstanding. Your understanding and knowledge of the topic has been
greatly appreciated. Furthermore, the time you have given to helping me outside of this
project is proof of your genuine concern for students’ wellbeing.
To Mr Chris Snook I echo the sentiments that I forwarded to Mr Bob Fulcher. The
understanding that you have shown, also shows the genuine concerns that you have for the
wellbeing of your students.
To the Management Team at AUSWater FW, thank you. The mentoring that you have all
given me throughout the entirety of my studies has been second to none. Thank you as well
for the all the time you have given pointing me in the right direction to complete this project.
To my family, my wife Sarah and my children Grace, Scarlet and Olive thank you for the
v
NOMENCALTURE
AC Actual Cost
ACWP Actual Cost of Work Preformed
AT Actual Time
AWFW AUS Water FW
BCWP Budgeted Cost of Work Preformed BCWS Budgeted Cost of Work Schedule CAPEX Capital Expenditure
CPI Cost Performance Index
CV Cost Variance
EA Engineers Australia EF Earliest Finish
ES Earned Schedule
ES Earliest Start
EV Earned Value
EVM Earned Value Management EW Essential Water
IA Infrastructure Australia
IPART Independent Pricing And Regulatory Tribunal IT Information Technology
KPI Key Performance Indicator
LF Latest Finish
LS Latest Start
NWC National Water Commission
OBS Organisational Breakdown Structure OPEX Operational expenditure
PMO Project Management Office PACl Polyaluminium Chloride
PV Planned Value
SPI Schedule Performance Index
SPI(t) Schedule Performance Index over Time SV Schedule Variance
vi
PREFACE
The research project has been written using seven chapters to present the completed work for this dissertation. The chapters are structured as follows:
Chapter 1 – Introduction
This chapter has a brief introduction to the topic of interest and clear presentation of the aims and objectives of the dissertation
Chapter 2 – Literature Review
This chapter presents an extended literature review to the reader, which forms the basis of this research. The topics of urban water supply, project management and the obstacles to effective project delivery are researched.
Chapter 3 - Methodology
The chapter describes and justifies the methodology to be used to collect the data needed to examine the effectiveness of the project delivery at a regional water business.
Chapter 4 – Analysis
In this chapter the authority’s past performance on project delivery is investigated. Gaps in the expertise of the organisation are identified with the aim of this information to aid in the development of the Project Management Suite.
Chapter 5 – Development
In this chapter the design of the project management tool is document. Information gather in the analysis phase has been utilised to tailor the tool to the organisation’s needs. The logic behind the tools features are explained in detail.
Chapter 6 – Testing, Discussion and Recommendations
In this Chapter the results that the tool during testing are discussed, and recommendations are given on how to improve the organisations project delivery with its continued use.
Chapter 7 – Conclusions and Further Work
Table of Contents
ABSTRACT ... i
LIMITATIONS OF USE ... ii
CERTIFICATION ... iii
ACKNOWLEDGEMENTS ... iv
NOMENCALTURE ... v
PREFACE ... vi
1 Introduction ... 1
1.1 Background ... 1
1.2 Idea Initiation ... 1
1.3 AUS Water FW ... 2
1.4 Project Management ... 3
1.5 Project Management Tools ... 4
1.6 Project Aim ... 5
1.7 Project Objectives ... 6
2 Literature Review ... 7
2.1 Water Infrastructure in Australia ... 7
2.1.1 Population Growth ... 8
2.1.2 Increased Operating Costs ... 9
2.1.3 Increasing Efficiency / Productivity ... 10
2.1.4 Transitioning Out of Drought ... 10
2.1.5 Climate Change ... 11
2.1.5 Industry Partnerships ... 11
2.2 Project Management ... 12
2.2.1 The Three Constraints ... 12
2.2.2 The Project Management Life Cycle ... 13
2.2.3 The Project Stakeholders ... 15
2.3 Project Management Tools ... 18
2.3.1 Bar Charts – ‘The Gantt Chart’ ... 18
2.3.2 Critical Path Method & Program Evaluation and Review Technique ... 20
2.3.3 Earned Value Method – The S-Curve ... 25
2.4 Why Projects Fail ... 29
3 Methodology ... 32
3.1 Introduction ... 32
3.2 Project Feasibility Analysis ... 32
3.3 Literature Review ... 33
3.4 Project Initiation Meeting ... 33
3.5 Policy Review... 34
3.6 Quality Assurance Plan ... 34
3.7 Project Plan ... 34
3.8 Resource Requirements ... 36
3.9 Risk Assessment ... 37
3.10 Communication Plan ... 40
3.11 Special Requirements ... 41
3.12 Project Schedule... 41
4 Analysis ... 43
4.1 Introduction AUS Water FW ... 43
4.2 AUS Water FW Assets ... 44
4.2.1 AUS Water FW Raw Water Assets... 45
4.2.2 AUS Water FW Water Treatment and Reticulation ... 45
4.2.3 AUS Water FW Waste Water Reticulation and Treatment ... 46
4.3 AUS Water FW Project Stakeholders ... 46
4.3.1 Project Governance ... 46
4.3.2 Project Managers ... 46
4.3.3 Other Stakeholders ... 47
4.4 AUS Water FW Project Identification ... 48
4.4.1 Breakdowns ... 48
4.4.2 Regulator Instructed ... 49
4.4.3 Top-Down Identification ... 49
4.5 AUS Water FW Project Delivery Review ... 51
4.5.1 Method ... 51
4.5.2 Analysis ... 51
4.5.3 Discussion ... 51
4.6 AUS Water FW Case Studies ... 52
4.6.2 Case Study Two – Polyaluminium Chloride Tank Installation ... 54
4.7 Discussion ... 56
4.8 Conclusion ... 56
5 Development ... 57
5.1 Introduction ... 57
5.2 What Should the Tool Include? ... 58
5.3 Visual Basic for Applications in Excel ... 58
5.4 Further Research into Dashboard Design ... 59
5.5 Project Management Tool Dashboard ... 59
5.6 How the tool works ... 60
5.7 Dashboard Elements ... 60
5.7.1 Information Bar ... 60
5.7.2 KPI’s and Project Phase ... 61
5.7.3 Driving Constraint ... 61
5.7.4 Project Health Speedometer ... 62
5.7.5 Simple PERT Chart ... 63
5.7.6 Simple S-Curve ... 63
5.7.7 Simple Gantt Chart ... 64
5.7.8 Multi Criteria Analysis ... 64
6 Testing, Discussion and Recommendations ... 65
6.1 Introduction ... 65
6.2 Desktop Audits ... 65
6.2.1 Desktop Audit – Grit Collector Overhaul... 66
6.2.2 Desktop Audit – PACl Tanks Installation ... 66
6.3 Discussion and Recommendations ... 67
7 Conclusion and Further Work ... 68
7.1 Conclusion ... 68
7.1 Further Work ... 69
8 References ... 70
8 Appendices ... 74
Appendix A – Project Specification ... 74
Appendix B – USQ Procurement Risk Assessment Matrix – Level of Risk ... 75
Appendix D – PACl Tank Installation Financial Information ... 77
Appendix E – AUS Water FW Risk Matrix ... 78
Appendix F – AUS Water FW CAPEX Update June 2016 ... 79
Appendix G – Grit Collector Overhaul Project Check List ... 80
Appendix H – PACl Tank Installation Project Check List ... 81
Appendix I – Speedometer Control Formulas ... 82
Table of Figures
Figure 1.1 - Project Triple Constraint (Haughey 2016) ... 4Figure 1.2 - Activity on Arrow CPM (Molloy 2014) ... 5
Figure 2.1 - Historical Spending on Infrastructure by Type 1988 – 2013 (Kaspura, A 2013)……..…….8
Figure 2.2 - Projected Population Increase 2011 to 2061 (IA 2015)……….……….9
Figure 2.2 - Operating Costs Water and Sewer ($ per property), 2005 - 2013 (IA 2015)………...9
Figure 2.4 - % Change in Productivity in the Water Industry 2006 -2010 (NWC 2014)……….10
Figure 2.5 - Sources of Water Utilized In Australia in 2012 -13 (NWC 2014)……….…..11
Figure 2.6 - The Dynamic Nature of the Three Constraints (Dobson & Leeman 2010)……….…..12
Figure 2.7 - Project Management Lifecycle (Westland 2006)……….……….13
Figure 2.8 - Project Stakeholders (Australian Standards 2016)……….………….15
Figure 2.9 - Simple Gantt Chart (Nicholas & Steyn 2008)……….……….….19
Figure 2.10 - Activity-on-Arrow (Nicholas & Steyn 2008)……….……….…….21
Figure 2.11 - Activity-on-Node (Nicholas & Steyn 2008)……….……….……...21
Figure 2.12 - Distribution of the Activity and of the Project (Gray & Larson 2011)……….…….…….……24
Figure 2.13 - S-Curve Cost verse Time with Variances indicated (Wysocki 2009)………….……….……….26
Figure 2.14 - S-Curve with Earned Schedule Superimposed (Acebes et al 2014)………..…...26
Figure 2.15 - Example of SPI and CPI vs Month Graphs (Aliverdi et al 2013)……….………….…….28
Figure 2.16 - Overall Governance Performance Score Card (IA 2013)……….…..…….30
Figure 3.1 – Communication Plan Schematic………....40
Figure 3.2 – Project Schedule……….41
Figure 4.1 –AUS Water FW Area of Operation in NSW……….………43
Figure 4.2 – AUS Water FW Water Assets Schematic………44
Figure 4.3 – AUS Water FW Top-Down Project identification (Molloy 2016)………..50
Figure 4.4 – Grit Collector (Molloy FW 2016)………. 52
Figure 5.1 – Project Management Tool Dashboard (Molloy 2016)………...59
Figure 5.2 – Information Bar (Molloy 2016)……….60
Figure 5.3 – KPI’s and Project Phase (Molloy 2016)………61
Figure 5.4 – Driving Constraint Chart (Molloy 2016)………....61
Figure 5.5 – Speedometer Project Health Chart (Molloy 2016)……….62
Figure 5.6 – Simple PERT Chart (Molloy 2016)………63
Figure 5.7 – Simple S-Curve (Molloy 2016)………..63
Figure 5.8 – Simple Gantt Chart (Molloy 2016………..64
Figure 5.9 – Multi Criteria Analysis (Molloy 2016)………..64
Figure 6.1 – Time as Driving Constraint (Molloy 2016)………65
Figure 6.1 – Project Health Score for the Grit Collector Overhaul (Molloy 2016)……….66
Figure 6.2 – Project Health Score for the PACl Tank Installation (Molloy 2016)……….……66
List of Tables
Figure 1.1 - Project Triple Constraint (Haughey 2016) ... 4ENG4112 Research Project 2 & ENG4111 Research Project 1 Aron Molloy 0061021071
1
1
Introduction
1.1 Background
Substantial investment was made in Australian water infrastructure in the post war period in the 1950’s and 1960’s. Much of this infrastructure is now reaching the end of its usable life
and will need to be replaced in the near future. However, in the preceding years a shift has
occurred in the water industry from a government subsidized industry to user pays businesses
(Coombs & Roberts 2007). Many regional towns during this time have also seen decreases
in population. The infrastructure that was needed to supply water to larger populations is
now being used to supply only a fraction of the users for which the supply network was
designed (Hicks & Woods 2010).
In this business environment of falling revenue and population bases, diverse and aging
infrastructure, it is important that water businesses spend their Capital Expenditure
(CAPEX) budgets prudently. When it is necessary to replace an asset, a robust and
transparent methodology must be used in both, selecting a suitable replacement and
managing the process of asset renewal.
1.2 Idea Initiation
This topic arose from initial discussions with Mr Stephen Bastian (Steve), Civil Engineer and Department Manager of ‘Planning and Design’ at AUS Water FW. Mr Bastian, who has
extensive experience in the Water Industry in NSW has been involved in developing
previous IPART submissions for AUS Water FW. Steve has identified the need for AUS
Water FW to develop a transparent system of managing CAPEX projects that form the basis of EW’s IPART submission. The process needs to be transparent as it will be scrutinised by
IPART and the Broken Hill community to determine if previous projects have been
completed cost effectively.
Mr. Bastian suggested investigating the application of a ‘Suite of Project Management Tools’ to address AUS Water FW’s needs. In the suite, Mr Bastian suggested to include tools
to track the project throughout all stages from project initiation and justification, project
ENG4112 Research Project 2 & ENG4111 Research Project 1 Aron Molloy 0061021071
2 FW would be left to manage these assets throughout their lifecycle, hence, consideration
would need to be given to the ongoing costs of any new infrastructure, for example cost of
electricity and ongoing maintenance.
Upon these suggestions I conducted a detailed journal search in the ‘Science Direct’ database accessible from the University of Southern Queensland’s Library homepage. This initial
search returned very little in the way of journal articles that were written regarding specific
challenges in project management or the methods used in the water industry. However, searching on the topic of ‘Project Management’ revealed a magnitude of information on
project management techniques, tools and philosophies, all of which will be valuable in
understanding contemporary project management theory.
Notable articles were written by Rokstad & Ugarelli 2015, and Deckro & Hebert 2011. The
focus of Rokstad & Ugarelli research was applying Multi Criteria Analysis (MCA) in
identifying grouped assets for replacement. For example a number of water mains with in a
geographical close area with the aim of reducing cost on installation. While Deckro & Hebert
suggest, that greater control can be achieved through the application of both new and old
project management tools. In this paper the limitations of Microsoft Project are discussed
and the authors turn to linear programming methods to resolve time/cost trade-offs.
However, the initial research demonstrated that there is little contemporary formal
information on the project management practices of water authorities in Australia. The lack
of documented evidence would suggest that the topic area has sufficient knowledge gaps to
warrant further research as the basis of a student project.
1.3 AUS Water FW
AUS Water FW (AWFW) is a water business that supplies water and sewer services to its
ten thousand customers throughout Far West of NSW in the towns of Broken Hill, Menindee,
Silverton and Sunset Strip. To facilitate this AWFW has an extensive, though aging,
infrastructure network which AUS Water FW is required to monitor, maintain and replace
ENG4112 Research Project 2 & ENG4111 Research Project 1 Aron Molloy 0061021071
3 employees which are spread over work groups and a large geographical location (Essential
Water 2016).
Due to the isolation of the area in which AWFW operates the organization has a monopoly
on supply of water. As a monopoly, the prices of AWFW’s services have been set since 2006 by the ‘Independent Pricing Authority and Regulatory Tribunal’ (IPART) which ensures
transparency in AWFW’s pricing practices. This means that proposed Capital and
Operational budgets are scrutinized to ensure that works are prudent and offer a benefit to
the customer.
Traditionally AUS Water FW has operated as an ‘Operation and Maintenance’ organization,
which enjoyed deficit funding from the state government to reconcile the short falls in
revenue collection. However, AUS Water FW has transitioned to a user pays model as determined by IPART. To meet the requirements of IPART’s pricing determination, AWFW
is completing more CAPEX projects as a core business function.
To ensure that AUS Water FW’s CAPEX projects are completed prudently and in a timely
manner, a robust and transparent project management process needs to be employed. Developing ‘In-House’ project management tools will ensure that key stake holders will
have a sense of ownership of the process and will be more likely to continue to use the tools
after the completion of this dissertation.
1.4 Project Management
While it is apparent that there are projects which have been completed throughout human
history, some of which have immense organization and planning, modern project
management is a relatively new field. Modern project management can trace its origin to the early 1950’s. By this time, many projects had become so complex in nature that standard
management practices were no longer capable of keeping some projects under control.
ENG4112 Research Project 2 & ENG4111 Research Project 1 Aron Molloy 0061021071
4 time there have been many technological and philosophical changes that have occurred,
which have continued to develop the field of project management (Nicholas & Steyn 2008).
However, no matter what the project, the quality outcome of the project management process
is still constrained by the interplay of cost, time and scope. This is best described by ‘Figure
1.1 – Project Triple Constraint’, that shows these competing controls.
Figure 1.1 - Project Triple Constraint (Haughey 2016)
1.5 Project Management Tools
As previously discussed in Section 1.4 of this report, modern project management is ever
changing, with new philosophies being developed to meet the needs of different projects, for example ‘Agile’ in the field of software development (Nicholas & Steyn 2008). While older,
more established techniques such as PERT and CPM are still in use as they are proven
effective methods of managing engineering projects.
The current project management software that Essential Water utilizes is Microsoft Project, which is mainly used at EW to develop project ‘Gantt Charts’. Gantt Charts are a commonly
used form of bar chart, which displays tasks against time taken to complete them. Microsoft
Project is a standard, though powerful tool, that allows the user to visualize the
ENG4112 Research Project 2 & ENG4111 Research Project 1 Aron Molloy 0061021071
5 advantage of being able to display the same project information in a number ways. For example through changing the ‘View’ option a project can be displayed as a Calendar or ‘Arrow-on-Node’ (AON) precedence diagram (Deckro & Hebert 2011).
Figure 1.2 - Activity on Arrow CPM (Molloy 2014)
Precedence diagram easily display the critical path of a project, and form the basis of the Critical Path Method, which can be either ‘Activity-on-Arrow’ (AOA) as shown in Figure
1.2, or ‘Activity-on–Node’. In this method, the critical path is determined by activities that
if not completed at the earliest time possible, will result in the project being delivered late.
In their research, Deckro & Hebert have suggested that through using both Microsoft Project
and more traditional linear programming methods, improved project outcomes can be
achieved. As EW already utilises MS Project it is suggested that this this approach should
be investigated further.
1.6 Project Aim
The aim of this research project is to review the effectiveness of the current project
management techniques used at AUS Water FW and to develop a suite of Project
ENG4112 Research Project 2 & ENG4111 Research Project 1 Aron Molloy 0061021071
6 In undertaking this research project, the key areas of focus will be on gaining an
understanding of Australian Water Industry, Project Management techniques and the
development of a suite of project management tools to be used in a regional water business.
The procedure and suite of tools that will be developed to monitor the effectiveness of AUS
Water FW’s project delivery. The information that will need to be displayed in the form of a ‘Dash Board’ will be developed in conjunction with the Essential Water Management
group, as they are in the best position understand AWFW’s needs. Therefore, the scope of
the project will be limited to the development of the tool using these criteria. Criterion
outside of this list will not be addressed as it will unviable to do so as it will not gain the
needed support for successful application of the tool from inside AUS Water FW.
1.7 Project Objectives
The research investigation will focus on key objectives related to project management and
efficient project delivery and will include:
Research current best practices in ‘Project Management’, research to be presented in the form of extended literature review.
Analyze the policies, procedures and culture that influence ‘Project Management’
practices at AUS Water FW.
Develop through consultation with AUS Water FW’s management team a suite of
in-house project management tools to aid in project delivery.
Develop a procedure for using the project management tools.
Develop a set criteria for how the effectiveness of the tool and procedure will be
evaluated.
Implement a trial of the procedure and project management tools on a small sized
project.
Evaluate the effectiveness of the trial, through collecting feedback from staff and
ENG4112 Research Project 2 & ENG4111 Research Project 1 Aron Molloy 0061021071
7
2
Literature Review
As previously discussed in section 1.2 of this report it was found that there was very little
research at present into water authorities in Australia’s project management practices.
Therefore, it was decided that it would be necessary to investigate various aspects of the
topic area, so as to gain a better understanding of the issue as a whole.
To broaden my understanding of the chosen area of research it was decided to investigate
the following topics:
Urban Water Infrastructure in Australia
Project Management
Project Management Tools, and
Factors Affecting Project Delivery
The following section of this report is the literature review that was undertaken to develop
an understanding of the issues that will affect the outcomes of this report.
2.1 Water Infrastructure in Australia
The Australian water industry has long prided itself on the efficiency and reliability of its
infrastructure. As a whole however, the industry has generally under invested in its assets.
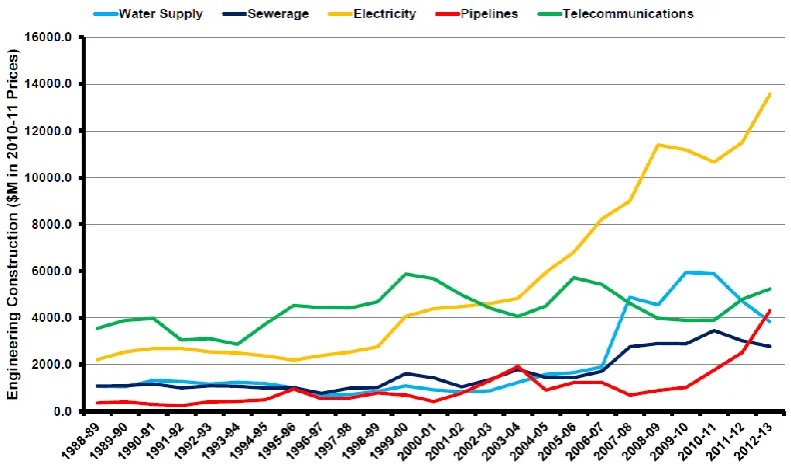
In a study completed by Engineers Australia in 2013 it was noted that historically the ‘Capital Expenditure’ on urban water infrastructure in Australia has, until recently, not kept
pace with spending in other sectors. It observed in this study that, when compared to the
electricity industry, investment in the water industry has been less than half of that invested
in the electrical sector. In recent times there has been an increase in expenditure, which saw
peaks in 2006 and 2011. However, this increase was in response to sever drought events.
Furthermore, due to this lack of investment in the infrastructure that is not drought related,
there is increased pressure on the remaining water infrastructure as population increases
ENG4112 Research Project 2 & ENG4111 Research Project 1 Aron Molloy 0061021071
8
Figure 2.1– Historical Spending on Infrastructure by Type 1988 – 2013 (Kaspura, A 2013)
In the research presented by Briggs, Joubert & Loke they assert that the biggest challenges
to the Australian water industry are, population growth, increasing operating costs,
transitioning from drought, increasing efficiency, developing industry partnerships and
climate change.
The following section of this report is a detailed explanation of how the prescribed factors
which are affecting the Urban Australian Water Industry. How these factors are affecting the
industry in detail is as follows:
2.1.1 Population Growth
The ‘Australian Bureau of Statistics’ has projected the population of Australia to increase
from a base of 22.7 million at 30 June 2012 to between 36.8 million and 48.3 million in 2061
(ABS 2013). The population is expected to increase predominately in urban areas, with the
[image:20.595.100.496.105.338.2]ENG4112 Research Project 2 & ENG4111 Research Project 1 Aron Molloy 0061021071
[image:21.595.137.461.83.286.2]9
Figure 2.2 – Projected Population Increase 2011 to 2061 (IA 2015)
This expected increase in population will see increasing demand for reliable water and sewer
services. Increasing demand will mean that there will be increased spending in water
infrastructure to secure future water supply to meet this demand (Briggs et al 2014).
2.1.2 Increased Operating Costs
In the ‘National Water Commissions’ (NWC) report on the performance of urban water
utilities 2012–2013, it is noted that increased operational costs are effecting the operational
efficiency of water utilities. The NWC define ‘Operating Costs’ as the costs associated with
running the day to day business of the utility, for example wages, fleet, energy, materials
and legal fees.
[image:21.595.129.468.560.728.2]ENG4112 Research Project 2 & ENG4111 Research Project 1 Aron Molloy 0061021071
10 Further to this, increases in operating costs are attributed to increasing, energy costs,
chemical costs, utilisation of reverse osmosis/desalination plants, defined benefit
superannuation payments, wages and IT costs. The steady increase in the cost of suppling
water per property over the period from 2005 – 2013 is shown in Figure 2.3.
2.1.3 Increasing Efficiency / Productivity
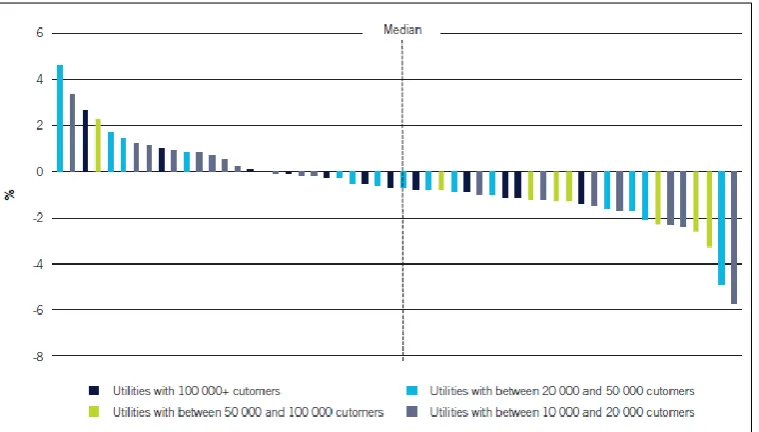
The water industry has seen an overall decrease in productivity in the period 2006 – 2010,
as determined by the National Water Commission. As seen in figure 2.4 the median
efficiency during this time has decreased by 0.7%. The NWC has used a number of studies
to benchmark this decrease, however it is suggested that this metric is difficult to measure.
The effect of this decrease in real terms, increases the price for consumers through decreased
[image:22.595.110.490.361.577.2]earned value.
Figure 2.4 – % Change in Productivity in the Water Industry 2006 -2010 (NWC 2014)
2.1.4 Transitioning Out of Drought
As shown in Figure 2.1, Briggs, Joubert & Loke, attribute much of the increased spending
which occurred from 2008 to 2010 in the water industry, to the building of infrastructure that
was needed to give supply options during the last drought. For example desalination plants
that are only needed when traditional supply options are unavailable. Briggs et al, identify
the fact that the water industry now faces a transition period from the building phase of the
ENG4112 Research Project 2 & ENG4111 Research Project 1 Aron Molloy 0061021071
11 of utilities has increased while the overall user base has remained similar to pre drought
numbers.
2.1.5 Climate Change
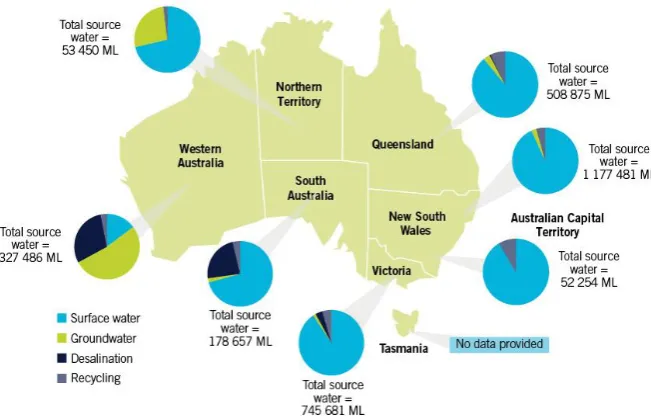
The bulk of Australia’s urban water supply is drawn from surface water catchments, shown
in figure 2.5. As climate change effects the seasonal weather cycles an increase in extreme drought and rains events is to be expected. Water Utilities will need to have flexibility in
supply options to deal with the variability in both the quantity and the quality of supply
(National Water Commission 2014).
[image:23.595.139.465.294.502.2]
Figure 2.5 – Sources of Water Utilized In Australia in 2012 -13 (NWC 2014)
2.1.5 Industry Partnerships
The final factor that is predicted to influence the water industry in the foreseeable future is
an increase reliance on industry partnerships. Funding for water infrastructure has historical
been sourced from public funding. However, as the population ages the pressure will be for
governments to increase funding in the social welfare, retirement and health sectors
(Infrastructure Australia 2015).
There are numerous models for private and public partnerships that can be explored. Though
it is expected that increased competition in the water industry through these partnerships will
ENG4112 Research Project 2 & ENG4111 Research Project 1 Aron Molloy 0061021071
12
2.2 Project Management
‘Project Management’ has been described as managing the process of change management, as compared to ‘Line Management’ that is concerned with running a business with as little
disruption as possible (Muller & Turner 2003). Project management is further defined as the
process of reaching goals within a set time, to a set cost, and performance that is defined by
the scope. These goals are reached through planning, monitoring, control and motivating
individuals to complete specific tasks (Lester 2013).
2.2.1 The Three Constraints
It is widely understood that all projects are bound by the triple constrains of ‘Cost’, ‘Time’
and ‘Scope or Performance’. These constraint will then align into a ‘Natural Hierarchy’ of
driver, middle and weak constraint, depending on the needs of the project. The driver is the
constraint that will most effect the project, for example, a short time frame will mean that
time is the most important constraint placed on a project. The next that will determine how
a project progresses is the weak constraint, or the most flexible constrain, for example, cost
will increase if time and performance are important. Lastly, the middle constraint is as the
name suggests, is in-between, it is not driving the project but it does not have the flexibility
inherent in the weak constraint (Dobson & Leeman 2010).
ENG4112 Research Project 2 & ENG4111 Research Project 1 Aron Molloy 0061021071
13 The three constraints of time, cost and scope are described as follows:
2.2.1.1 Time
The characteristic that defines a project when compared to other endeavors is that it is finite,
there is always an endpoint that is being worked towards. The time taken to complete a
project will be specific to the project. Time may be measured in days, weeks, months or
years, however, it must be measured.
2.2.1.2 Cost
As projects are usually conducted outside of the normal operation of the business the cost of
the project needs to be budgeted.
2.2.1.3 Scope / Performance
The scope of the project relates to the outcome or the performance improvement that will be
delivered by the project. For example, if a project is undertaken to increase the storage
capacity of reservoir the scope will included how much of an increase is required and the
standard against the success of the project will be measured.
2.2.2 The Project Management Life Cycle
Project Management is conducted over four distinct phases, definition, planning,
monitoring/controlling and review. These different stages form ‘The Project Management Life Cycle’ (Westland 2006), as shown in figure 2.7 and describe in the following sub section
of this report.
ENG4112 Research Project 2 & ENG4111 Research Project 1 Aron Molloy 0061021071
14
2.2.2.1 Project Initiation
This is phase where the issue or opportunity is identified. Once an issue is identified a ‘Business Case’ or ‘Option Study’ is developed to provide various solutions to the problem. After which, a ‘Feasibility Study’ is undertaken to ascertain which option is the most
desirable solution. Once a solution is chosen it is then recommended to management for approval. If approval is gained for the recommended solution, a ‘Term of Reference’ for the
project is developed. This will outline the objectives, scope, and structure of the project and
the project manager is selected (Westland 2006).
2.2.2.2 Project Planning
In this second phase of the project life cycle the project will enter a detailed planning phase
(Westland 2006). In this phase the following plans are developed:
Project Plan – Activities, tasks, dependencies and time frames are identified,
Resource Plan – Equipment, labour, and the materials required are identified,
Financial Plan – The cost of the identified resources is evaluated,
Quality Plan – The quality standards are identified, assurance and control measure,
Risk Plan – Risks to the project are identified and mitigating actions developed,
Acceptance Plan – Criteria for customer acceptance are listed,
Communications Plan – How information will be conveyed to stakeholders.
Procurement plan – Identifies all the materials that are to be sourced externally.
For further clarification on the construction of each one of these plans examples are provided
in following chapter of this report.
2.2.2.3 Project Execution
At this stage of the project all plans that have been developed during the planning stage are
applied. During this phase the project is monitored and controlled to ensure that the plan is
on target. Changes are made to the project as risks or issues are identified. While the standard
of the work completed is measured against the acceptance plan. Once execution of the
ENG4112 Research Project 2 & ENG4111 Research Project 1 Aron Molloy 0061021071
15
2.2.2.4 Project Closure
This is the last stage of the project, documentation and final deliverables are released,
contracts are terminated, communication is closed and resources are returned to their roles. The final step is to complete a ‘Project Review’ where the success of the project is quantified
and lessons are documented for use on future projects (Westland 2006).
2.2.3 The Project Stakeholders
Individuals or organisations that are actively engaged in delivering a project, or those whom
will be affected in some way by the execution or completion of the project, are known as the ‘Project Stakeholders’. A level of influence over the projects outcomes and objectives, may
also be exercised by the stakeholders (Project Management Institute 2004).
Figure 2.8 – Project Stakeholders (Australian Standards 2016)
The project stakeholders, can either internally influence the project delivery, such as the ‘Project Organisation’ and ‘Project Governance’, or have external influence, such as ‘Regulatory Bodies’ or ‘Suppliers’ as shown in figure 2.8. The level or involvement or
influence the stake holders have, can range from active engagement in the decision making
process or to being kept informed at a high level to the project performance and health (Flank
2015).
In AS ISO 21500:2016 the project stakeholders are divided into three distinct groups, these
ENG4112 Research Project 2 & ENG4111 Research Project 1 Aron Molloy 0061021071
16
2.2.3.1 Project Governance
Project Governance consist of the procedures and process that are enacted over the duration
of the project to ensure that the project meets its expected budget, schedule and performance.
Governance is defined by Flank, as the active process of monitoring the progress and
performance of the project while making decisions to steer the project to a successful
outcome (Flank 2015).
Project governance is provided by an individual, as the ‘Project Sponsor’, or a team, that is, the ‘Project Steering Committee’. The roles that these play in the effective delivery of the
project is as follows:
Project Sponsor – the project sponsor is expected to be the owner and champion of the project. The sponsor may also provide financial support for the project. As such, the sponsor’s approval is needed for any variation to the project scope, budget or
performance.
Project Steering Committee – the steering committee is formed to monitor the project
at a high level. The committee also provides guidance when needed to ensure the
effective delivery of the project.
As described in the figure 2.8, communication must flow between the project sponsor and
the project manager for governance of the project to be effective.
2.2.3.2 Project Management Team
The ‘Project Organisation’ is the institution whose employees have the most involvement in
delivering the project (Project Management Institute 2004). The organisation includes the
project manager, project management team and project delivery team. All the functions of
delivering the project are covered by this organisation (Flank 2015). Each of the resources
are described as such:
Project Manager – this is individual who is ultimately responsible of the delivery of
ENG4112 Research Project 2 & ENG4111 Research Project 1 Aron Molloy 0061021071
17 with the allocated resources. Further to this, the project manager must also facilitate any
changes that are required to the project plan or schedule as required to keep the project
progressing. The project manager finally, also has the responsibility of keeping the
project sponsor informed on the projects progress (Project Management Institute 2004).
Project Management Office – this is the grouping of professionals from both technical and business units that complete project tasks. The team member is only utilised by the
project as required, in some cases this will be for the duration of the project, while in
others it will be for the task that their expertise is required. Team member’s
responsibilities will be analogous to their position, for example an Engineer will provide
technical support, where as a Business Analyst will be interested in Process
improvement. There are many descriptions of the expected responsibilities of the
differing team members contained in the literature, however, one thing is common; that
is that the team members report to the project manager (Flank 2015).
2.2.3.3 External Stakeholders
External stake holders are those that are external to the project, however, they exert a level
of influence over the project. External stake holders in the water industry, form a very broad
group and can include the following groups:
Employees - employees outside of the core project team are often called upon to
complete work towards the completion of the project. If they do not fully understand the
need for the project or have a level of resistance to the change to the organisation that
the project will bring they can affect the timely delivery of the project. This situation
highlights the need to keep the work force updated on all projects that the organisation
is undertaking.
Customers - customers also exert influence over the project delivery. A project is
possibly being undertaken to meet the need of the customer, for example water mains
renewal to ensure a more reliable supply. However, customers are often also paying for
the project through higher prices, or rates in the case of a water authority, and often they
ENG4112 Research Project 2 & ENG4111 Research Project 1 Aron Molloy 0061021071
18 informed on the importance of required projects, so that they have a level of
understanding as to prices they are being charged.
Regulatory Bodies – projects are often undertaken to meet regulations imposed by the
specific industry regulator. For example there may be a change to the regulations for
minimum handrail height, which would require a project to change hand rails that are
under this height. Furthermore, a regulator may impose a directive on the organisation.
This a direct order to change something in the organisation that comes under their
regulation. For example the EPA could audit a business and discover that waste products
are being store incorrectly, a directive can be issued to fix the problem or fines will be
applied.
2.3 Project Management Tools
Project management tools and techniques are defined as systems that aid in the delivery of
the project to the triple constraints of time, cost and scope. They may be as simple as a
to-do list, as seemingly complex as a Gantt chart developed using Microsoft Project (Wysocki
2009). As discussed in section 1.4 of this report, the modern profession of project
management has been developing new methods to manage projects since the 1950’s.
In their research Deckro & Hebert have identified that through the use both Microsoft Project
and more traditional linear programming methods, improved project outcomes can be
achieved. Further to this Pries and Quigley, have advocated, combing ‘Scrum’ an ‘Agile’
project methodology developed to deliver IT projects, with Microsoft Project and more
traditional tools for increased efficiency.
This would suggest that traditional project management tools are as relevant as when they
were developed. The following sub sections of this report outlines traditional PM tools and how they are applied to managing projects effectively.
2.3.1 Bar Charts – ‘The Gantt Chart’
The most commonly used and simplest scheduling tool is the Bar Chart, which are more
ENG4112 Research Project 2 & ENG4111 Research Project 1 Aron Molloy 0061021071
19 the chart in conjunction with the US Army to track the progress of munitions to the front
line in World War One. During development of the chart, Gantt realised that the common
element that all tasks shared was that they took a specific ‘Time’ to complete. Through
tracking the status of the task with respect to time, a visual reference is produced that shows
how the project as a whole is progressing (Nicholas & Steyn 2008).
The appeal of the Gantt chart is in the ease in which it can be created. The project is broken
down into the elements that are necessary to complete the project and durations are estimated
for each task (Wysocki 2009). These tasks are then listed down the y-axis in the approximate
order that they will need to occur so that the project can be completed. As shown in figure
2.9, time forms the basis of the x-axis and the durations of the tasks are plotted to an
appropriate scale for the project that is in days, weeks, months or years if necessary (Nicholas
[image:31.595.114.482.374.603.2]& Steyn 2008).
Figure 2.9 – Simple Gantt Chart (Nicholas & Steyn 2008)
The final step in creating the Gantt chart is to arrange the tasks along the x-axis to the time
that they are likely to occur, for example a task may be reliant on another task being
completed before it can begin. This pattern of tasks cascading across the chart takes on the
appearance of a waterfall. The final tasks completion date gives the entire projects
ENG4112 Research Project 2 & ENG4111 Research Project 1 Aron Molloy 0061021071
20 The limitations of the Gantt chart is that it can be difficult to display complex dependencies
that are easier described on a network diagram (Wysocki 2009). Programs such as Microsoft
Project also allow for a clutter of distracting information. However, as stated in the research
of Denko et al, they are useful tool that are still useful even with the multitude of other tools
available.
2.3.2 Critical Path Method & Program Evaluation and Review Technique
As projects became more complex in nature during the cold war period of the 1950’s it was
necessary to develop more complex ways of controlling them. At this time and
independently to one another the ‘Critical Path Method’ and the ‘Program Evaluation and
Review Technique’ were develop by DuPont and the US Navy respectively to aid in
delivering complex projects (Mantel et al 2011).
Both of these methods are almost identical, each use precedence / network diagrams to show
the interconnectedness of the tasks required to complete the project. The network diagram
consists of nodes and arrows, and can take the form of either an ‘Activity on Arrow’ where
activities are shown on the arrow; or an ‘Activity on Node’ diagram, where activities are on
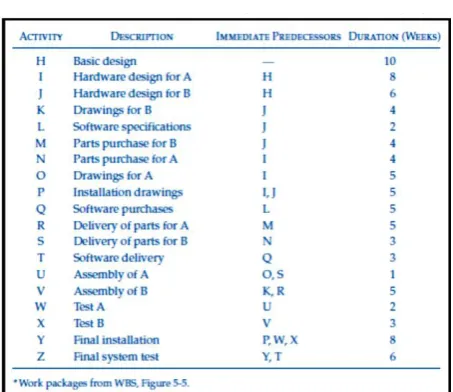
the node. In figures 2.10 and 2.11, the activities from the table 1 are shown in both Activity
[image:32.595.185.412.510.706.2]on Arrow and Activity on Node form respectively (Nicholas & Steyn 2008).
ENG4112 Research Project 2 & ENG4111 Research Project 1 Aron Molloy 0061021071
21
[image:33.595.115.482.78.291.2]Figure 2.10 – Activity-on-Arrow (Nicholas & Steyn 2008)
Figure 2.11 – Activity-on-Node (Nicholas & Steyn 2008)
To better understand the two methods it is first required to understand the terms that are used
to describe them, Mantel et al, give the following definitions of the terms that are common
to both the CPM and PERT when developing the network diagram:
Activity – a task essential to complete the project that uses the projects resources and
time.
Arrow – a link between nodes in a network diagram. Represents either the activity
needed or technical dependencies between activities. Arrows are always directed from
ENG4112 Research Project 2 & ENG4111 Research Project 1 Aron Molloy 0061021071
22
Event – a set point reached in the project through the full completion of one or more
activities, none of the projects resources or time are consumed by a project event.
Milestone – this an event that identifies that a significant progression point has been reached in the project.
Node – visual representation of an activity or an event, that form the basis of the project
network.
Network – a diagrammatic representation of a project. The network consist of project
nodes linked by arrows. The interconnectedness of the project activities and events are
shown from start to finish of the project.
Path – a set of connected nodes in the network which link events.
Critical Path – a sequence of activities or events that run the full length of the project.
The defining feature over other paths is that if one of the completion dates is delayed
the entire project will be overdue.
Critical Time - the time needed to finish every tasks on the critical path.
Slack – the time that an activity can be delayed without affecting the critical path of the
project.
As noted by Gray and Larson in 2011, the CPM and PERT methods are similar in
application, however there are distinct differences between the two methods. Critical Path
Method views each task as having a pre-determined length to completion, hence it is a ‘Deterministic’ method. Whereas, PERT accepts that there is a level of uncertainty attached
to completing the task on time, it is therefore a ‘Probabilistic’ model. Hence each task has a
statistical probability of being completed within a set timeframe. The following is a brief
explanation of each method:
2.3.2.1 Critical Path Method
In the critical path method the tasks are arranged into either an AOA or AON diagram, ensuring that related tasks are connected. ‘Earliest Start’ (ES) times and ‘Earliest Finish’ (EF) times are calculated by doing a ‘Forward Pass’, a left to right evaluation on the network.
After which a ‘Backward Pass’, a right to left evaluation is completed, to determine ‘Latest Start’ (LS) and ‘Latest Finish’ (LF) times for tasks. Tasks that are on the longest duration
ENG4112 Research Project 2 & ENG4111 Research Project 1 Aron Molloy 0061021071
23 2009). The significance of this path is that a delay in any of these tasks will delay the project
as a whole. To complete the process the Critical Path is then highlighted. Resources can then
be assigned appropriately to ensure that the tasks are completed as required (Lock 2007).
If the project is required to be completed sooner than the determined project length, some tasks may be ‘Crashed’, this is assigning extra resources to a task to shorten its duration.
However, crashing a task will also increase the cost to complete the task and effect the
critical path, as other task may move onto this path. Hence, the critical path will need to be
reassessed, as will the total cost of the project to ensure that the benefit is gained from doing
so (Wysocki 2009).
2.3.2.2 Program Evaluation and Review Technique
Similarly to the CPM the first step to using PERT is establishing a task list, identifying
connected tasks and developing a network diagram. Usually the AON method is used as this
allows for clear display of the information. At this point the two methods differ, instead of a
set time being allocated to the task, a probable length of the task is derived. To do this the three length s are assigned to the task, these are the ’Most Likely’ (m) time, ‘Optimistic’ (a) time and ‘Pessimistic’ (b) time. From these three times the ‘Weighted Average’ (te) task
time can be computed using the following formula (Wysocki 2009):
𝑡𝑒 =
(𝑎 + 4𝑚 − 𝑏) 6
This weighted average task time follows a statistical distribution that is called a ‘Beta’
distribution, which allows for a skewed distribution, as seen in figure 2.12. Tasks represent
work and as such when a task falls behind it is assumed it will always be behind, hence the
ENG4112 Research Project 2 & ENG4111 Research Project 1 Aron Molloy 0061021071
24
Figure 2.12 – Distribution of the Activity and of the Project (Gray & Larson 2011)
The standard deviation of the beta distribution is derived using the following formula (Gray
& Larson 2011).
𝜎𝑡𝑒 =
(𝑎 − 𝑏) 6
The variance in the task is then found by (Nicholas & Steyn 2008):
𝑉𝑎𝑟= 𝜎2 = ((𝑎 − 𝑏)/6)2
Through adding the entire variances along the critical path the ‘Critical Path Duration’ (TE)
is found. Now the standard deviation of the entire project (𝜎𝑇𝐸) can be derived, which follows
a normal distribution as shown in figure 2.12. The standard deviation of the entire project is found using the equation (Nicholas & Steyn 2008):
𝜎𝑇𝐸 = √∑ 𝜎𝑡𝑒
2
Once this is know the probability of completing a task is found using statistical data table,
as shown in table 2, and the following equation (Gray & Larson 2011):
𝑍 = 𝑇𝑆− 𝑇𝐸
√∑ 𝜎𝑡2𝑒
Where Z is the value used to derive a probability from table 2 and TS is the ‘Scheduled Time
ENG4112 Research Project 2 & ENG4111 Research Project 1 Aron Molloy 0061021071
[image:37.595.152.450.107.447.2]25
Table 2 – Normal distribution function of completing a project by time Ts (Nicholas & Steyn 2008)
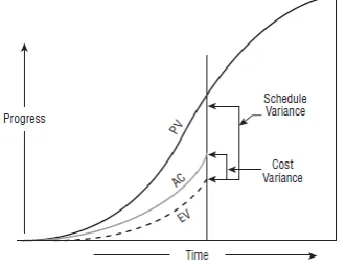
2.3.3 Earned Value Method – The S-Curve
‘Earned Value Management, (EVM), is a project management methodology that is
commonly used to control projects. EVM is popular, as the framework of the methodology
incorporates cost, time and scope controls (Acebes et al 2014). In Brief, the EVM
methodology relies on the depiction of the three key measures of ‘Planned Value’ (PV),
Actual Cost (AC) and ‘Earned Value’ (EV) on a Cost vs Time graph as shown in figure 2.13.
These three measures are described as follows by Acebes et al 2014:
Planned value - of a project is the ‘Budgeted Cost of Work Schedule’ (BCWS), this is the forecast spend of the entire project.
Actual Cost - of a project is described as, the ‘Actual Cost of Work Preformed’
ENG4112 Research Project 2 & ENG4111 Research Project 1 Aron Molloy 0061021071
26
Earned Value - of a project is the ‘Budgeted Cost of Work Preformed’ (BCWP), which
is the final cost on completion, or the forecast cost on completion of the project.
Figure 2.13 – S-Curve Cost verse Time with Variances indicated (Wysocki 2009)
Further to these three commonly used metrics it is also possible to derive a fourth key
measure, the ‘Earned Schedule’ (ES) as proposed by Lipke in 2004, which is shown along
aside the common metrics in figure 2.14 and is described as:
Earned Schedule - is the date when the present EV should have been completed. This
[image:38.595.211.383.167.298.2]measure is found by superimposing the EV onto the PV line (Lipke 2004).
Figure 2.14 – S-Curve with Earned Schedule Superimposed (Acebes et al 2014)
From these four measures, the EVM ‘Key Performance Indicators’ (KPI) can be derived.
ENG4112 Research Project 2 & ENG4111 Research Project 1 Aron Molloy 0061021071
27 (Acebes et al 2014). The third measure as proposed by Lipke is ‘Schedule Variance with
respect to Time’ (SV(t)). These KPI’s are derived as follows:
Cost Variance – is described by the equation CV = EV – AC. When a positive value is
returned from this equation it indicates that the project is under budget. Conversely, if
the project is over budget a negative value is returned.
Schedule Variance – is derived using the equation SV = EV – PV. A positive value
indicates that the project is ahead of schedule. Whereas, a negative value shows the
project to be behind schedule.
Schedule Variance Time – is found through the equation SV(t) = ES – AT, where AT is the ‘Actual Time’ the project has been running. In this KPI, a positive value indicates
the time that has been saved in the project whereas negative values indicate time lost.
Finally it is then possible to derive a series of indices that allow projects of various sizes to
be ranked against each other. These indexes are the ‘Cost Performance Index’ (CPI), ‘Schedule Performance Index’ (SPI) and the ‘Schedule Performance Index with respect to Time’ (SPI(t)). These Indices are derived as follows:
Cost Performance Index – is found using the equation CPI = EV / AC
Schedule Performance Index – is derived using the formula SPI = EV / PV
Schedule Performance Index Time – is found from the formula SPI(t) = ES / AT
In all of these indexes a value less than one indicates that the corresponding variance is below
zero. This signifies that the project is either behind schedule or over budget depending on
the metric that is being evaluated at that time. Whereas, values equal to one or larger show
that the project is ahead of schedule or under budget, once again when compared to the
ENG4112 Research Project 2 & ENG4111 Research Project 1 Aron Molloy 0061021071
28 Using indexes allows projects of differing sizes to be compared to assess how effectively
they are being delivered. This further allows for the ranking of projects so that the overall
effectiveness of the entire project programme can be assessed. However, there is one
limitation to this methodology, as it does not account for the fact that tasks off the critical
path may not affect the schedule of the project, though may have a considerable effect on
[image:40.595.161.438.231.562.2]the budget of the project (Acebes et al 2014).
ENG4112 Research Project 2 & ENG4111 Research Project 1 Aron Molloy 0061021071
29
2.4 Why Projects Fail
Within the literature it is identified that Australia has a very high failure rate on completed
project work. Infrastructure Australia, in 2013 presented findings that on average 48% of
projects fail in Australia. The Auditor General of New South Wales suggests that a project
has failed if does not meet one of the three controlling constraints of time, cost or
performance. Therefore, project failure can be described as either a time failure, late project
delivery, a cost failure, project cost overrun, or performance failure, where the expected
outcomes are not met by the project (Achterstraat 2013).
The NSW Auditor General has found in his experience that the reasons that are generally
given for a project failing are:
Poor Business Case - Opportunities can be missed as all relevant options have not been
explored.
Uncertain Statements of Expected Outcomes – Poor communication of the project goals to all parties can lead to unrealistic expectations of the benefit of the project.
Insufficient Gate Way Reviews – This indicates that the project is not being managed
appropriately. Gate way reviews are import to assess how a project is progressing and if changes are required.
Poor Communication – Communication channels should be free flowing from the
project manager up to the executive, and from the project manager to the project team.
Doing so will ensure that concerns and issues are addressed as they occur.
Insufficient Stake Holder Engagement – Poor or uninspiring leadership will mean
that the team will not be committed to the project fully.
Scope Creep – Changing the scope of the project to get more out of a project will lead
to either a delayed project or an over budget project.
Conflicts of Interest – leads to the selection of uncompetitive tenders or overpriced
ENG4112 Research Project 2 & ENG4111 Research Project 1 Aron Molloy 0061021071
30
Unrealistic Bias when Assessing Prospective Benefits – The project never meets the
expectations of the stakeholders
Group Think – Will often mean that right decision is not made, team members will try
and reach consensus rather than offering an opinion that might be correct.
Lack of Big Picture Appreciation – The true benefit of the project is never realized
and opportunities are missed to capitalize on a dynamic market.
Decision Makers Too Involved in the Project – decisions will get bogged down by
the small details of the day to day running of the project, rather than of the big picture of what the project is aiming to achieve.
In a report presented by Achterstraat in 2013, it is suggested that the commonly given reasons
for project failure can be grouped into the three overarching themes, which are ‘Poor Governance’, ‘Poor Project Management’ and ‘Lack of Effective Leadership’. Infrastructure
Australia (IA), also support this finding and further suggest that poor governance of projects
leads to the most failures (Infrastructure Australia 2013). In a 2013 report, Infrastructure Australia found that project governance in Australia can be generally classified as ‘Highly Dysfunctional’. Figure 2.16, shows that on average project governance is rated at only 24%
[image:42.595.146.458.517.733.2]effective by industry experts.
ENG4112 Research Project 2 & ENG4111 Research Project 1 Aron Molloy 0061021071
31
2.5 Conclusion
Water authorities in Australia have traditionally under spent on asset renewals when
compared to other service providers. This means that much of the water infrastructure is nearing the end of its ‘Asset Life’ and in need of replacement. Recent drought events have
seen increases in expenditure, however these projects are generally concerned with securing
supply in short time frames. Increases in labour and energy costs have seen comparable rises in ‘Operational Expenditure’.
The combination of all these factors will mean, water authorities are coming under increased
scrutiny from stakeholders to increase efficiency to produce a cheaper product. To achieve this, the water industry will need to employ ‘Best Practice’ in asset and project management
strategies to maximize asset life while minimizing capital expenditure costs. Furthermore,
the industry will also need to be able to demonstrate to its stakeholders that a robust and
transparent decision making process has been applied to the delivery of its Capital
Expenditure projects.
The traditionally used project management tools that have been investigated as part of this
literature review have been proven as reliable methods for project delivery. Incorporating
one or more of these techniques will provide the robustness required in delivering an
ENG4112 Research Project 2 & ENG4111 Research Project 1 Aron Molloy 0061021071
32
3 Methodology
3.1 Introduction
The core function of the project is to develop a suite of project management tools and a
procedure to describe the use of the tool in delivering AUS Water FW’s Capital Expenditure
projects. The project management tools are to be developed using quantitative and
qualitative sources. As the water authority is subject to both governmental and public
scrutiny on project delivery, AUS Water FW’s processes must be transparent and repeatable.
The project will produce these expected outcomes:
Identification of quantitative sources of data available to AWFW
A formal process of documenting the qualitative information sources.
Selection of a set of criteria to judge a projects effectiveness that are aligned with
AWFW’s business philosophies
Management reached consensus on information that needs to be conveyed by the PM
suite.
Formal policy on using the project management suite to show transparency in
AWFW’s project delivery.
Furthermore, the above process once documented in a dissertation, will serve as a blueprint
for other regional water authorities seeking increased control over delivery of their capital
projects. More broadly, increased use of project management tools in the water industry will
ensure that less wastage of capital funds occurs.
3.2 Project Feasibility Analysis
Developing a suite of Project Management tools and procedures for their use, will ensure
that AUS Water FW’s capital projects are justifiable and withstands public scrutiny. Using
a program such as Matlab or Excel as a platform for the suite would be considered a feasible
solution. As Matlab is within the skill set of a student at the University of Southern
Queensland and Excel is a standard program used in most offices. Both of these programs
offer the necessary development tools to produce a user friendly graphical interface needed