City, University of London Institutional Repository
Citation: Okoh, C., Roy, R. ORCID: 0000-0001-5491-7437 and Mehnen, J. (2017).
Predictive Maintenance Modelling for Through-Life Engineering Services. Procedia CIRP,
59, pp. 196-201. doi: 10.1016/j.procir.2016.09.033
This is the published version of the paper.
This version of the publication may differ from the final published
version.
Permanent repository link: http://openaccess.city.ac.uk/22029/
Link to published version: http://dx.doi.org/10.1016/j.procir.2016.09.033
Copyright and reuse: City Research Online aims to make research
outputs of City, University of London available to a wider audience.
Copyright and Moral Rights remain with the author(s) and/or copyright
holders. URLs from City Research Online may be freely distributed and
linked to.
City Research Online:
http://openaccess.city.ac.uk/
[email protected]
2212-8271 © 2016 Elsevier B.V. This is an open access article under the CC BY license (http://creativecommons.org/licenses/by/4.0/).
Peer-review under responsibility of the scientific committee of the The 5th International Conference on Through-life Engineering Services (TESConf 2016) doi: 10.1016/j.procir.2016.09.033
Procedia CIRP 59 ( 2017 ) 196 – 201
ScienceDirect
The 5th International Conference on Through-life Engineering Services (TESConf 2016)
Predictive Maintenance Modelling for Through-Life Engineering Services
C. Okoh*, R. Roy, J. Mehnen
EPSRC Centre for Innovative Manufacturing in Through-Life Engineering Services Manufacturing Department, Cranfield University, MK43 0AL, Cranfield, United Kingdom
*Corresponding author. Tel.: +44-1234-750111.E-mail address:[email protected]
Abstract
Predictive maintenance needs to forecast the numbers of rejections at any overhaul point before any failure occurs in order to accurately and proactively take adequate maintenance action. In healthcare, prediction has been applied to foretell when and how to administer medication to improve the health condition of the patient. The same is true for maintenance where the application of prognostics can help make better decisions. In this paper, an overview of prognostic maintenance strategies is presented. The proposed data-driven prognostics approach employs a statistical technique of (i) the parameter estimation methods of the time-to-failure data to predict the relevant statistical model parameters and (ii) prognostics modelling incorporating the reliability Weibull Cumulative Distribution Function to predict part rejection, replacement, and reuse. The analysis of the modelling uses synthetic data validated by industry domain experts. The outcome of the prediction can further proffer solution to designers, manufacturers and operators of industrial product-service systems. The novelty in this paper is the development of the through-life performance approach. The approach ascertains when the system needs to undergo maintenance, repair and overhaul before failure occurs.
© 2016 The Authors. Published by Elsevier B.V.
Peer-review under responsibility of the Programme Committee of the 5th International Conference on Through-life Engineering Services (TESConf 2016).
Keywords: Through-life engineering services; maintenance strategies, data-driven prediction, predictive modelling, parameter estimation
1. Introduction
Through-life Engineering Services (TES) aligns MRO function with the operations strategy of an organisation. TES is important and facilitated by the correct application of technology supported by the efficient use of service knowledge [1]. TES applies advanced technologies for condition monitoring and prognosis to help operators reduce downtime and provide improved availability of products.
In the manufacturing and aerospace domains, time remains a constant independent variable which every other variable depends on. The reliability of the repairable system is essential to help determine the life of the system based on predictive maintenance to reduce failure of an assembly [2].
Application of prognostics approaches in the modelling and simulation of gas turbine engine mechanical components for an assembly can give a better understanding of the behaviour of a system.
The intent of the authors is to convert the observed rejection rate data into an understanding of the underlying parts degradation rate as an issue. The problem is to show the through-life performance of an assembly of mechanical components. The demonstration of the unreliability of modelling and simulation of a set of components within an assembly has become essential because of the difficulty of undertaking physical-model-based prognostics. The historical and current health information as well as expert experience are used in a degradation model to visualise the simulated
© 2016 Elsevier B.V. This is an open access article under the CC BY license (http://creativecommons.org/licenses/by/4.0/).
197
C. Okoh et al. / Procedia CIRP 59 ( 2017 ) 196 – 201
results. The data-driven prognostic approach uses only the available data to model and simulate the deterioration of parts. The contribution in this paper is applying data-driven model to develop a through-life performance approach that establishes when an asset should be ready for detailed maintenance, repair and overhaul before failure occurs.
The most common prognostic approaches to demonstrate the effectiveness of the predictive maintenance modelling include physical model, data-driven, knowledge and hybrid [3]–[6].
The focus of this article is to develop a predictive maintenance strategy applicable to system reliability in the manufacturing, aerospace gas turbine, and other domains relative to concurrent system operations. The goal of this paper is to model and simulate an engine assembly in order to predict the number of parts expected to fail at a given inspection time. The remainder of this paper includes maintenance strategies, data-driven prognostics maintenance strategy, case study, results and discussion, and conclusion.
2.Maintenance strategies
The maintenance strategies are classified as taxonomy with a focus on the selected strategies in the blue boxes in Figure 1. Maintenance is conducted using different strategies for the management, control, execution and quality of activities to ensure reasonably design levels of availability and performance of assets to meet business objectives [7].
[image:3.595.81.281.358.517.2]
Figure 1 Taxonomy of maintenance strategies
2.1.Classification of Maintenance Strategies
Over the last sixty year the world has transformed the maintenance perspective [7]. Corrective maintenance is often called repair tasks carried out after an asset has failed [2]. Corrective maintenance was the viable option for engineers to fix or replace breakdown equipment. Though, corrective maintenance is still very much in use. However, the corrective maintenance aims only to bring equipment back to its functioning state [2].
Preventive maintenance is described as a planned maintenance performed when an item is functioning properly to prevent future failures [2]. The preventive maintenance strategy consists of opportunity-based and condition-based.
2.2.Classification of Preventive Maintenance Strategies
Condition-based Maintenance (CBM) describes the measurements of one or more condition variables of an asset, which is initiated when a condition variable passes its threshold [2]. Condition-based maintenance is a predictive strategy performed to determine the state of an in-service system to perform maintenance when the need arises [2], [3]. The necessity concept is determined by assessing the health condition of the equipment continuously and extrapolating it to a predefined failure threshold [8], [9]. Condition-based Maintenance refers to predictive maintenance while others are termed traditional or conventional maintenance. However, a predictive maintenance culture can be adopted for on-time decision making to assess the health of a component in-service before system failure.
Opportunity maintenance is another form of preventive maintenance applicable for multi-item systems where maintenance tasks on other items give an opportunity for carrying out maintenance on which were not the cause of opportunity [2]. The opportunity maintenance is the replacement of equipment components that are yet to fail based on available maintenance resources [10]. Opportunity maintenance aims to improve system availability and reduce production loss and results in a reducing operations excellence and increases production efficiency [11].
2.3.Classification of Condition-based Preventive Maintenance Strategies
Diagnostics is the process of checking faults and the health state of sub-systems and units in an operational environment with the aid of sensors. During maintenance, inspection is required to identify components and provide information on the current performance status [12].
In [13], the turbine section of a gas turbine houses singles and multiple stage parts. However, the focus is on the single-stage. The single stage part are superficially inspected using a Borescope for bowing by gaining entrance into the turbine through the combustion chamber areas or by opening inspection access holes
Prognostics is predicting the duration after which a component can no longer perform its intended or expected functionality to improve system safety. The International Standard Organisation (ISO 13381-1:2004) define Prognostics
as “the estimated-time-to-failure (ETTF) and the risk of
existence or subsequent appearance of one or more failure
modes” [14].
2.4.Classification of Prognostics Maintenance strategy
a. Data-driven: Data-driven techniques are derived from the
configuration, usage, and historical ‘run-to-failure’ data
applicable to maintenance decision making. Data-driven techniques are often used for estimation thereby informing the maintenance decision based upon failure threshold. Gåsvik et al. [15] proposed a ‘wavelet packet’ decomposition approach
time variables only. However, Xionyzi et al. [5] noted that the approaches consequent from historical data used for predicting asset life without foreknowledge of the physics of the formation of a component. Javed et al. [16] proposed a long-term prognostics of Proton Exchange Membrane Fuel Cells (PEMFC) stack to estimate life. Their work contributes to data-driven prognostics of PEMFC through an ensemble of constraint-based Summation Wavelet-Extreme Learning Machine (SW-ELM) algorithm to improve accuracy and robustness of long-term prognostics. A new framework for life estimation using support vector machine classifier and a Weibull function for the general degradation of equipment due to ageing was proposed Louen et al. [17].
b. Model-based: The model-based approach is also known as the physical-model-based approach. Physical model-based refers to an understanding of the physics for reliability estimates. The authors in [18] attributed Physics-of-Failure (PoF), physical science of components and generated empirical equations. The authors in [19] propose the use of a simple crack-growth-model for predicting RUL of a system affected by fatigue failure mechanism. Failure measures such as crack by fatigue, wear, and corrosion of components relate to mathematical laws used to estimate RUL [14], [20]. Thus, huge costs and parts specifications which are not reusable earn this methodology these limitations [21]. The model-based technique requires a combination of experiment, observation, geometry, and condition monitoring of data to estimate any damage resulting from a particular failure mechanism. Leisieutre et al. [22], a design a classified modelling approach for system simulation predicted RUL. Jardine et al. [3] focus on a mechanistic modelling applicable to model-based approach to extract the relationship between the lifetime and condition variables in helicopter gear.
c. Knowledge-Based: The knowledge-based approach
combines experience and computational intelligence techniques relative to stored information from domain experts and rule sets for interpretation [23]. An expert system for decision support can seem like a performance service system for service delivery based on the principles of service feedback for analysis. Parameters of reliability are estimated using an experience-based technique to gather information for understanding the operations of an asset [14]. Knowledge-based techniques assess the similarity between a temporary situation and a databank of prior failures, and infer the life expectancy from previous occurrences using an expert and fuzzy systems [4]. Knowledge is the through-life accumulation of data from experience based on stochastic and probabilistic models of degradation of parts [24]. An expert knowledge technique based on experience was used to develop an expert system that is applicable in plants diagnosis and prognosis by using fuzzy inference system to define easy to understand rules based on the IF-THEN statement [25]. There are difficulties in converting domain knowledge to rules which requires another technique for prognostics and challenges in building rules.
d. Hybrid: A hybrid model is a collection of one or more techniques. Hybrid models use a combination of several techniques for estimation to improve accuracy. Hybrid models use parametric and non-parametric data to perform estimations and to improve accuracy [23]. Data quality and wholeness can be insufficient for the data-driven model because they require historic data historical knowledge. However, [6] reviewed three state-of-the-art models for RUL prediction about the experimental-based model, data-driven model and physics-based model as well as Hybrid approaches. In [3], a review of machinery diagnostics and prognostics, implementing condition-based maintenance shows that statistical, artificial intelligence and model-based prognostic approaches can be used to estimate life with improved accuracy.
3.Data-Driven Prognostic Maintenance Strategy
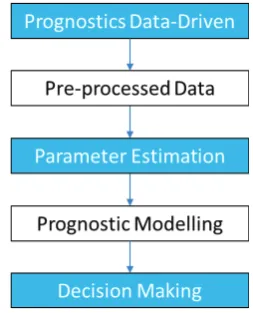
[image:4.595.343.470.354.511.2]The data-driven prognostics maintenance strategy is used to create a through-life performance approach to forecast future inspection of components before failure happens to proactively take action. The data-driven prognostics strategy uses failure data only for estimation. This section outlines the methodology for predictive maintenance modelling for through-life engineering services. The activities in the process include data acquisition, parameter estimation, prognostics modelling, and decision making as illustrated in Figure 2.
Figure 2 Stages of the prognostics data-driven strategy
The prognostic data-driven maintenance strategy is as follows:
199
C. Okoh et al. / Procedia CIRP 59 ( 2017 ) 196 – 201
[image:5.595.323.524.344.596.2]assembly. The overhaul stages can increase based on the maintenance policy.
Table 1 Failure time for overhaul stages
System No Failure time (Cycles)
Scrapped QpA
10010 1000 4
10010 1900 8
10010 2800 19
The pattern for developing the failure is based on the operation of the complex engineering equipment. In this example, the first overhaul, 10% of the parts in the assembly are expected to fail, 20% of the parts in the assembly should fail at the second overhaul stage, and 45% are expected to fail at the third overhaul stage. The failure rate were all assumed but validated by experts in industry.
b. Parameter Estimation: This section uses the failure time data to estimate the constant values required for further analysis. The reliability Weibull function is mainly used for degradation data. The Weibull function is a statistical distribution that describes the different effect of the failure expectations. The failure expectations are decreasing, constant and increasing. The Weibull distribution gives a better estimate since it can assume various distributions. It is appropriate for a small samples of failure forecasting and prognostics by engineers and statisticians [26]. The Weibull cumulative distribution function (CDF) is represented as F(t).
ܨሺݐሻ ൌ ͳ െ ቈെ ൬ݐ ߟ൰
ఉ
(1)
where, t is the failure time, ߚ denotes a shape parameter ߟ is the scale parameter. The Weibull analysis describes the failure rate (shape parameter) where ߚ = 1 relates to constant,
ߚ < 1is decreasing failure rate, and ߚ > 1 signifies increasing failure rate.
The degradation data considered for parameter estimation is the failure time of the overhaul stages, which is the failure time in cycles as shown in Table 1. The parameter estimation can be achieved using the least square method and maximum likelihood estimation method.
i. Least Square Method (LSM): The two parameters η and
β shown in Equation (1) can be estimated using LSM. The LSM has been widely used to address mathematical and engineering problems [17], [26]. Consider
ܴሺݐሻ ൌ ͳ െ ܨሺݐሻ ൌ ݁ିቀ௧ఎ ቁ
ഁ
(2)
where R(t) is the reliability function. The parameters are chosen through minimising the sum of squared residuals shown as
݉ሺɄǡ Ⱦሻ ൌ ܹܶ
ୀଵ
ቆܴሺݐሻ െ ݁ିቀ௧ఎቁ ഁ
ቇ
ଶ
(3)
where R(ti) represents the remaining performance and WTi
denotes the weight factor of the time-step i, and n is a random sample. The weighing becomes a forgetting factor for the degradation [17]. The non-linear LSM problem generated can be represented by a linear formula.
݉ሺɄǡ Ⱦሻ ൌ ܹܶ
ୀଵ
ሺݕെ Ⱦݔ ߟሻଶ (4)
Where xi = ln(ti), yi=ln(ln(1/R(ti))), and ߙ = -ߚ•ln(ߟ). The
parameters ηand β of the Weibull distribution function are finally given as
Ⱦ ൌ σୀଵܹܶݐσୀଵܹܶݕെ σୀଵܹܶݐݕσୀଵܹܶ ሺσୀଵܹܶݐሻଶെ σୀଵܹܶሺݐሻଶσୀଵܹܶ
(5)
Ʉ ൌ Ⱦ σୀଵܹܶݐσୀଵܹܶݕ Ⱦ σୀଵܹܶ
(6)
ii. Maximum Likelihood Estimation (MLE): The MLE is a different method for estimating two parameters of η and β. The outcome of the estimated parameters will be applied in the prognostic modelling. The MLE is commonly utilised due to its numerical accuracy [26], [27].
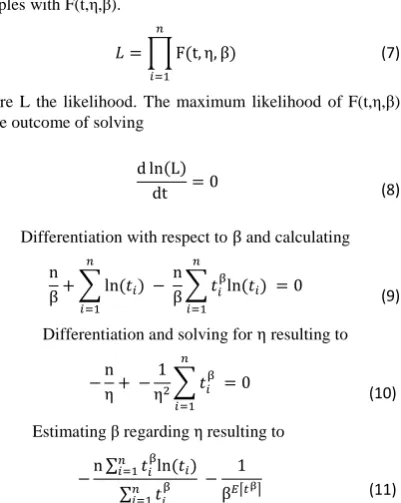
The likelihood function is used to estimate the two parameters required for Equation (1). Consider n random samples with F(t,η,β).
ܮ ൌ ෑ ሺǡ Ʉǡ Ⱦሻ
ୀଵ
(7)
where L the likelihood. The maximum likelihood of F(t,η,β)
is the outcome of solving
ሺሻ ൌ Ͳ
(8)
Differentiation with respect to Ⱦ and calculating
Ⱦ ሺݐሻ
ୀଵ
െ
Ⱦ ݐஒሺݐሻ
ୀଵ
ൌ Ͳ
(9)
Differentiation and solving for Ʉ resulting to
െ Ʉെ
ͳ Ʉଶ ݐஒ
ୀଵ
ൌ Ͳ
(10)
Estimating βregarding Ʉresulting to
െ σ ݐ
ஒሺݐ
ሻ
ୀଵ
σ ݐஒ
ୀଵ
െ ͳ
Ⱦாඃ௧ಊඇ (11)
The Equation (11) was solved for Ⱦ using the Newton-Raphson method. The Ʉ parameters can be calculated as Ʉ ൌ
E[tβ] [26], [27].
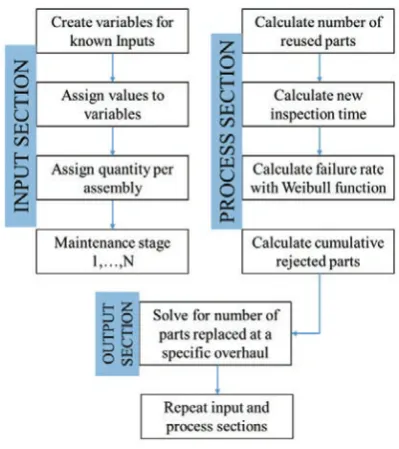
modelling simulates the number of parts expected to fail by the first overhaul and subsequent overhaul stages. The flowchart for the modelling is presented in Figure 3 shows a typical input, process and output process depict the application of the mathematical model. Variables and formulae required for the modelling and simulation are presented as a flowchart in this section. The model for the prediction approach is an inclusion of the number of parts at the beginning of the operation into the Weibull function in Equation (1), which then translates into
ݕ ൌ ܨሺݐǡ ߟǡ ߚǡ ܶܰሻ (12)
where y is the number/rate of expected parts failure, t
represents failure time of overhaul stages (1, 2,…, N), TN is the total number of parts (e.g. 40).
Figure 3 Flowchart for prognostics modelling
The flowchart shows the process flow for predicting the number of parts expected to fail. The process continues until it reaches the Nth overhaul stage. The output will further be discussed in the Results section.
d. Decision Making: The simulation of the prognostic model
is dependent on the estimated parameters of η and β of the
MLE and the LSM methods. The different output will aid domain experts in getting a better sense of judgement in planning of spare parts availability, reduction of service downtime and cost. This simulation can also help in estimating when it is appropriate to scrap an entire assembly relative to cost and replace with brand new parts.
4.Case study
The aim of the case study is to demonstrate the part deterioration to estimate reject, replace and reuse. An engine experiences various events in a specific context (in-service).
The context contains complex information about service history. The research questions include (i) how should the observed rejection rate data be converted into an understanding of the underlying parts deterioration rate towards rejection thresholds? and (ii) how to simulate the through-life performance of the predicted rejection rate of prior overall activity and future overhauls.
5.Results and Discussion
[image:6.595.85.285.241.466.2]The statistical techniques were used in the data-driven prognostics approach to predict characteristic life and the slope/shape of the run to failure data. The cumulative distribution function estimates the rate of failure. The number of scrap parts at each inspection is predicted.
Table 2 Estimated parameters and overhauls stages
Methods ࣁ ࢼ O1 O2 O3
1000 1900 2800 LSM 2234 1.9 8 15 16 MLE 2141 2.9 4 17 19
[image:6.595.317.518.442.580.2]The O1, O2, and O3 are the overhaul inspection stages. The number of failures and times are shown in Figure 4. The simulation shows that with a small shape parameter, the number of parts expected to fail at each stage inspection increases, while a big shape parameter results to decrease in the expected number of failures. The total number of parts is expected to be replaced through the lifecycle of the equipment is 39 using the LSM, while 40 is scheduled to fail using the MLE. The difference in the result came from the rank estimate in the LSM. The time at which most of the performances are lost differs. The LSM works better for small samples [26]. The LSM is a suitable choice in terms of safety and reliability.
Figure 4 Number of parts expected failed
From the cost perspective, where the cost of the replacing individual parts at each overhaul and the cost to replace the entire parts in the assembly has a 50% safety margin. Therefore, the time to scrap is dependent on when the cost of the former equals or greater than the latter. The precondition is to use clean data; however, any data should be presented in the expected input format.
0 2 4 6 8 10 12 14 16 18 20
0 500 1000 1500 2000 2500 3000
Number
of Fai
lures
Failure Time (Cycles)
Number of Failure vs Failure Time
201
C. Okoh et al. / Procedia CIRP 59 ( 2017 ) 196 – 201
6. Conclusion
The approach and the results discussed will aid designers and engineers make tangible maintenance decisions; decide the appropriate estimation method to reduce the in-service risk of equipment. The input includes the number of parts, η,
β and the failure times. When the model accepts these parameters, a simulation estimates the quantity of parts expected to fail at each point. The simulation model can be used to predict the failure in the next inspection, which will help ascertain whether the system needs to undergo for detailed maintenance, repair and overhaul. Based on the outcome, the service engineers can decide the better choice to ensure safety, reliability and cost reduction. However, the analysed information which is converted and represented in the model is from historical and current health knowledge.
TES is a strategic approach to service delivery which enables, facilitates and supports maintenance of industrial product-service systems. The tool set can guide policymakers to make better maintenance decisions and feedback to designers. The future work relates to predicting the remaining useful life of mechanical parts in an assembly.
Acknowledgements
This work is funded by the EPSRC (Engineering and Physical Sciences Research Council, UK), grant number EP/I033246/1 delivered by EPSRC Centre for Innovative Manufacturing in Through-life Engineering Services. The authors also acknowledge Rolls-Royce Plc for their support in this research.
References
[1] R. Roy, A. Shaw, J. A. Erkoyuncu, and L. Redding, “Through-Life
Engineering Services,” Journal of Measurement and Control, vol. 46, no. 6, pp. 172–175, 2013.
[2] M. Rausand and A. Høyland, System reliability theory: models, statistical methods, and applications, vol. 396. John Wiley & Sons, 2004.
[3] A. K. S. Jardine, D. Lin, and D. Banjevic, “A review on machinery diagnostics and prognostics implementing condition-based maintenance,” Mechanical Systems and Signal Processing, vol. 20, no. 7. pp. 1483–1510, 2006.
[4] J. Z. Sikorska, M. Hodkiewicz, and L. Ma, “Prognostic modelling
options for remaining useful life estimation by industry,” Mechanical Systems and Signal Processing, vol. 25, no. 5, pp. 1803–1836, 2011. [5] C. Xiongzi, Y. Jinsong, T. Diyin, and W. Yingxun, “Remaining useful
life prognostic estimation for aircraft subsystems or components: A review,” in Electronic Measurement & Instruments (ICEMI), 2011 10th International Conference on, 2011, vol. 2, pp. 94–98.
[6] F. Ahmadzadeh and J. Lundberg, “Remaining useful life estimation: Review,” International Journal of Systems Assurance Engineering and Management., vol. 5, no. 4, pp. 461–474, 2014.
[7] M. Brown, P. and Sondalini, “The Evolution of Maintenance
Practices,” 2016. [Online]. Available: available at:
http://www.lifetime-reliability.com/free-articles/maintenance-management/Evolution_of_Maintenance_Practices.pdf. [Accessed: 03-Feb-2016].
[8] F. Camci and R. B. Chinnam, “Health-state estimation and prognostics in machining processes,” Automation Science and Engineering, IEEE Transactions on, vol. 7, no. 3, pp. 581–597, 2010.
[9] O. F. Eker, F. Camci, A. Guclu, H. Yilboga, M. Sevkli, and S. Baskan, “A simple state-based prognostic model for railway turnout systems,” Industrial Electronics, IEEE Transactions on, vol. 58, no. 5, pp. 1718– 1726, 2011.
[10] L. M. Pintelon and L. F. Gelders, “Maintenance management decision making,” European journal of operational research, vol. 58, no. 3, pp. 301–317, 1992.
[11] V. Borges, “Opportunistic Maintenance,” 2015. [Online]. Available: http://blogs.dnvgl.com/software/2015/08/opportunistic-maintenance/. [Accessed: 03-Feb-2016].
[12] D. Banjevic, “Remaining useful life in theory and practice,” Metrika, vol. 69, no. 2–3, pp. 337–349, 2009.
[13] M. P. Boyce, Gas Turbine Engineering Handbook. 2006.
[14] K. Medjaher, D. A. Tobon-Mejia, and N. Zerhouni, “Remaining Useful Life Estimation of Critical Components With Application to Bearings,” Reliability, IEEE Transactions on, vol. 61, no. 2, pp. 292–302, 2012. [15] K. J. Gåsvik, K. G. Robbersmyr, T. Vadseth, and H. R. Karimi,
“Deformation measurement of circular steel plates using projected
fringes,” The International Journal of Advanced Manufacturing
Technology, vol. 70, no. 1, pp. 321–326, 2014.
[16] K. Javed, R. Gouriveau, N. Zerhouni, and D. Hissel, “Improving accuracy of long-term prognostics of PEMFC stack to estimate remaining useful life,” in Proceedings of the IEEE International Conference on Industrial Technology, 2015, pp. 1047–1052. [17] C. Louen, S. X. Ding, and C. Kandler, “A new framework for
remaining useful life estimation using Support Vector Machine classifier,” in Control and Fault-Tolerant Systems (SysTol), 2013 Conference on, 2013, pp. 228–233.
[18] N. Bolander, H. Qiu, N. Eklund, E. Hindle, and T. Rosenfeld, “Physics-based remaining useful life prediction for aircraft engine bearing prognosis,” in Proceedings of the annual conference of the prognostics and health management society, 2010.
[19] A. Coppe, M. J. Pais, R. T. Haftka, and N. H. Kim, “Using a Simple Crack Growth Model in Predicting Remaining Useful Life,” Journal of Aircraft, vol. 49, no. 6, pp. 1965–1973, 2012.
[20] C. Okoh, R. Roy, J. Mehnen, L. Redding, and A. Harrison, “Development of an Ontology for Aerospace Engine Components Degradation in Service,” in 6th IC3K Conference on Knowledge Engineering and Ontology Development, 2014, pp. 108–119. [21] T. Brotherton, G. Jahns, J. Jacobs, and D. Wroblewski, “Prognosis of
faults in gas turbine engines,” in 2000 IEEE Aerospace Conference. Proceedings (Cat. No.00TH8484), 2000, vol. 6, pp. 163–171. [22] G. A. Lesieutre, L. Fang, and U. Lee, “Hierarchical Failure Simulation
for Machinery Prognostics,” in Biennial conference; 12th, Reliability, stress analysis and failure prevention: A critical link; 1997;, 1997. [23] C. Okoh, R. Roy, J. Mehnen, and L. Redding, “Overview of
Remaining Useful Life prediction techniques in Through-life Engineering Services,” in Procedia CIRP, 2014, vol. 16, pp. 158–163.
[24] A. Z. Keller, A. R. R. Kamath, and U. D. Perera, “Reliability analysis of CNC machine tools,” Reliability Engineering, vol. 3, no. 6, pp. 449– 473, 1982.
[25] T. Biagetti and E. Sciubba, “Automatic diagnostics and prognostics of energy conversion processes via knowledge-based systems,” Energy, vol. 29, no. 12, pp. 2553–2572, 2004.
[26] R. Abernethy, “The new Weibull handbook: reliability and statistical analysis for predicting life, safety, supportability, risk, cost and warranty claims,” Barringer & Associates, 2006.