City, University of London Institutional Repository
Citation
: Brown, C. J., Goodey, R.J. ORCID: 0000-0002-9166-8393 and Rotter, J. M.
(2017). Bending of rectangular plates subject to non-uniform pressure distributions relevant to containment structures. Paper presented at the Eurosteel 2017, 13-15 Sep 2017,Copenhagen, Denmark.
This is the accepted version of the paper.
This version of the publication may differ from the final published
version.
Permanent repository link:
http://openaccess.city.ac.uk/20199/Link to published version
: http://dx.doi.org/10.1002/cepa.140
Copyright and reuse:
City Research Online aims to make research
outputs of City, University of London available to a wider audience.
Copyright and Moral Rights remain with the author(s) and/or copyright
holders. URLs from City Research Online may be freely distributed and
linked to.
City Research Online: http://openaccess.city.ac.uk/ [email protected]
BENDING OF RECTANGULAR PLATES SUBJECT TO NON‐UNIFORM PRESSURE DISTRIBUTIONS RELEVANT TO CONTAINMENT STRUCTURES
C.J. Browna, R.J. Goodeyb and J. Michael Rotterc,d
aBrunel University London, College of Engineering Design and Physical Sciences, Uxbridge
UB8 3PH, UK [email protected]
bCity, University of London, School of Mathematics, Computer Science & Engineering,
London EC1V 0HB, UK. [email protected]
cInstitute for Infrastructure and Environment, University of Edinburgh, Scotland, UK dDepartment of Civil Engineering, Imperial College, London, UK. [email protected]
ABSTRACT
Rectangular planform silos are often used where there is need for simple construction or space restrictions. The flexibility of the flat plate walls leads to a horizontal variation in wall pressure across each wall, with much reduced pressures at the mid-side. There is a clear and systematic relationship between the wall flexural stiffness relative to the stiffness of the stored solid and the pressure pattern on the wall which is now well proven. Since the centre of each wall is subject to significantly reduced pressures, it may be expected that the bending moments in the wall will much lower, permitting the use of a thinner wall. In turn, the thinner wall is then more flexible and leads to a further redistribution of the pressures. This paper is the first to examine the structural consequences of these pressure changes.
The horizontal variation of the wall pressure is well captured by a hyperbolic form, with much reduced mid-side pressures and raised corner pressures, characterised by a single parameter “alpha” that determines the strength of this redistribution. This parameter is naturally dependent on the relative wall and solid stiffness. In this study, the value of is varied between the uniform pressure condition = 0 and a high value (=3). The highest values occur when a stiff solid is stored in a silo with very flexible walls. Wall plates of different aspect ratio are investigated representing conditions in a square or rectangular silo.
The finite element predictions show that great savings can be made in the design of these structures by exploiting the reduced deflections and reduced stresses that arise when realistic patterns of pressure are adopted. The results presented here are suitable for transformation into design rules for the Eurocode standards EN 1993-1-7 [1] and EN 1993-4-1 [2].
1 INTRODUCTION
1.1 Conditions in silos with a rectangular planform
Smaller silos are often constructed with a rectangular or square planform either to make for simple erection or to optimise the use of limited available space. Very few studies have explored appropriate design methods to address the different requirements when a silo has planar walls in place of the more common cylindrical form. This paper presents a first study of the response of the planar sided silo walls to the patterns of pressure that are applied to them. Previous studies have shown that the pattern of pressure on a planar silo wall is very sensitive to the relative translational stiffness of the stored solid and the flexural stiffness of the silo wall. Where a relatively flexible wall is used, the pattern of pressures from the stored solid is radically altered from that for a stiff wall, and the stress resultants induced in the wall are consequently reduced. Once it is recognised that increased deflection and reduced stresses are beneficial to the structure, the potential is obvious to further reduce the wall stiffness, making the design even lighter.
However, no existing study appears to have explored the reduced stresses developing in a flexible silo wall.
1.2 The effect of wall flexibility and stiff stored solids
Where a silo wall is relatively flexible in comparison with the stored solid, significant redistribution of the pressures occurs, with high pressures in the corner joints between different plate segments, and much reduced pressures at the mid-span of each plate. The key relationship between the stiffness of the solid relative to the wall and the pattern of pressure on the wall is now well established from both experimental and computational studies [3-5].
Since the centre of each wall is subject to reduced pressures, it is expected that the bending moments are much lower, permitting the use of a thinner wall, which in turn is more flexible and would lead to further redistribution of the pressures. This paper examines the structural effects of these pressure changes.
2 WALL PRESSURE PATTERNS IN RECTANGULAR SILOS
2.1 The vertical variation of wall pressures in rectangular silos
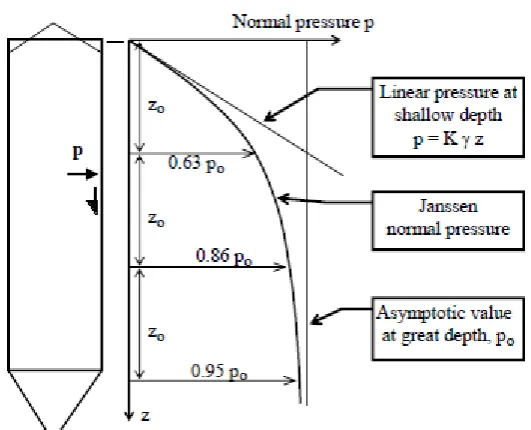
The mean pressure at any depth below the surface in a silo of any planform follows reasonably closely that defined by Janssen [6] (1895), or where the silo is relatively squat, that defined by the modified Reimbert expression [7] (Rotter, 2001). These are both used in the Eurocode that defines the loads on silo walls EN 1991-4 [8].
The Janssen [6] variation is relevant to slender silos, as it takes no account of pressures against the wall near the surface (Fig. 1). It may be written as
1 ⁄ (1)
in which phfm is the mean horizontal pressure at the depth z below the equivalent surface (Fig.
1a) after filling the silo and pho is the asymptotic normal pressure at great depth below the
4
(2)
and the Janssen reference depth is given by
1 1 4
(3)
in which A and U are the cross-sectional area and perimeter of the plan section, b is the side length of a square planform silo, K is the lateral pressure ratio of the stored solid and is the wall friction coefficient.
The modified Reimbert [7] variation is needed for squat silos, because the normal wall pressure must be zero at the highest solid-wall contact (Fig. 1b). It leads to a variation in the effective lateral pressure ratio with depth, because the mean vertical stress at the level of the highest solid-wall contact cannot be zero. It may be written [7] as
1 1 (4)
in which ho is the vertical distance between the equivalent surface and the highest solid-wall contact (Fig. 1b).
It may be noted that both of these expressions produce a linear variation of mean pressure near the surface, and both lead to the same asymptotic uniform pressure po at great depth. The
limiting cases of this distribution are the linear and uniform patterns. Different values of zo lead
to patterns that lie between these two cases. This aspect is the basis of the current study of deflections and stresses in an individual plate of a square silo structure.
2.2 The horizontal variation of wall pressures in rectangular silos
At any level the normal pressure against the wall can vary around the circumference. In cylindrical silos the variation is relatively close to uniform [9], but in rectangular silos the variation is substantial, but very well characterised by the hyperbolic expression [4].
sinh
2 (5)
in which x is the horizontal distance along the silo wall from the centreline, b is the side-length of the flat wall, phfx is the normal pressure on the wall at coordinate x, phfm is the mean normal
pressure at the relevant level (Eqs 1 & 4), and is the horizontal non-uniformity coefficient. The value = 0 corresponds to a constant pressure on the wall, which arises when the wall is very stiff. The highest values of , corresponding to very flexible walls containing stiff solids, are of the order of = 2.5 or 3.
This pressure pattern is best understood in terms of the mid-side and corner values of pressure: the ratio of corner to mid-side pressure is given by cosh and the ratio of corner to mean pressure is given by coth. A high value of causes a major redistribution of the mean pressure phfm away from the mid-side towards the corners of the silo (Fig. 2), leading to much
This study is the first to explore the effect of these changes on the wall deflections and wall stresses when departs from the value = 0.
3 CHARACTERISATION OF A RECTANGULAR METAL SILO
3.1 Representation and modelling of the silo and its loading
This study focuses on the behaviour of a single uniform thickness wall of a square or rectangular silo (Fig. 3). In a square silo with rigidly jointed corners, the individual plates of the wall may each be well treated as an isolated plate with built in vertical boundaries. These boundaries are here treated as free to move vertically (due to symmetry) but restrained against rotation about the vertical axis (fixed edge plate). The lower boundary is also restrained against rotation about the horizontal axis and horizontal translation (fixed edge plate). This set of boundary conditions is termed FF in this study.
Each plate element was subjected to a linear elastic finite element analysis using small displacement theory. This is certainly a simplification of the real problem, which may involve large displacements in the plate elements, but since this is a first exploration, it seems appropriate to limit it to this case.
The load case was only that of normal pressure, albeit in the relatively complex patterns of hyperbolic horizontal variation and Janssen vertical variation. The wall friction effect was omitted, but since these analyses are linear, the outcomes can be added by superposition. The resulting peak deflection was termed wm, and the peak stress as m.
3.2 Interpretation of the results
To ensure that the findings of this study can be applied to a wide range of real geometries, all the results were made dimensionless, using as the reference case a rectangular plate of uniform thickness t, height a and width b and elastic modulus E subjected to uniform pressure po, with
fixed edge boundary conditions. The aspect ratio of the plate was characterised as b/a with the assumption that these results would be applied to silos whose height was generally greater than their side length b.
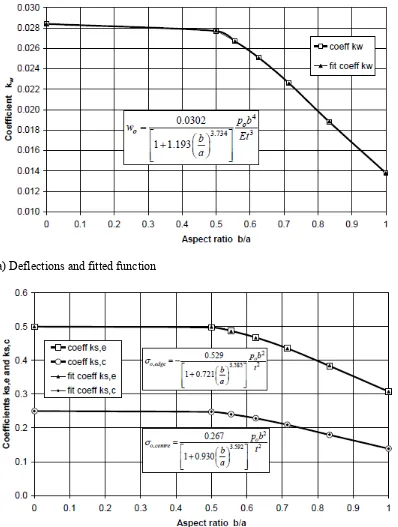
For such a rectangular plate with fixed edges, most sources give only tables of values of deflection and stress for discrete values of b/a. As a result, a set of calculations were performed on this loading condition and the specific results checked against those obtainable in existing publications [10,11] values. Carefully fitted functions were then devised that provide very precise fits to the variation of peak deflection (Fig. 3a) and maximum stress (occurring at the restrained edges of the each plate) (Fig. 3b) for uniform pressure po and fully fixed edges.
The maximum deflection for this reference condition can be expressed (Fig. 3a) as:
In which .
. . but ≤ 0.0284
(6)
The maximum stress at the centre of the long edge can be expressed (Fig. 3b) as:
,
.
. . but ≤ 0.50
(7)
,
.
. . but ≤ 0.25
(8)
It should be noted that the above expressions, derived from the literature, relate to stresses in only one direction. In the results computed here, the von Mises stress was determined. Because the plate edge is restrained against bending deformations parallel to the side, a compressive stress due to bending normal to the edge (as published) also induces a compressive stress parallel to the side. These lead to reduced von Mises stresses relative to the published moments. For the Poisson’s ratio used here = 0.33, the reduction factor is consequently 1.133. These values were used to make all the finding dimensionless and relevant to any geometry within the scope of the study.
4 PREDICTED DEFLECTIONS AND STRESSES
4.1 Uniform pressure vertically with hyperbolic horizontal variation
The simplest case to explore is that of the terminal condition at great depth in a silo, with the normal pressure against the wall effectively unvarying with depth at the value po. The effect of
a flexible wall still leads to a hyperbolic variation in the horizontal pressures [5].
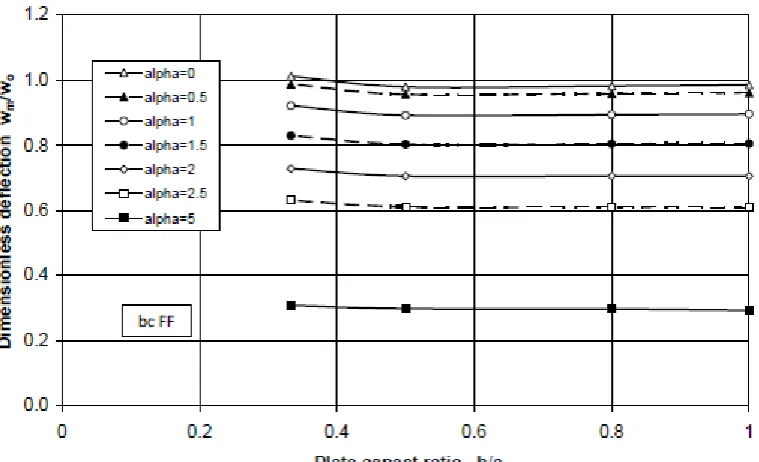
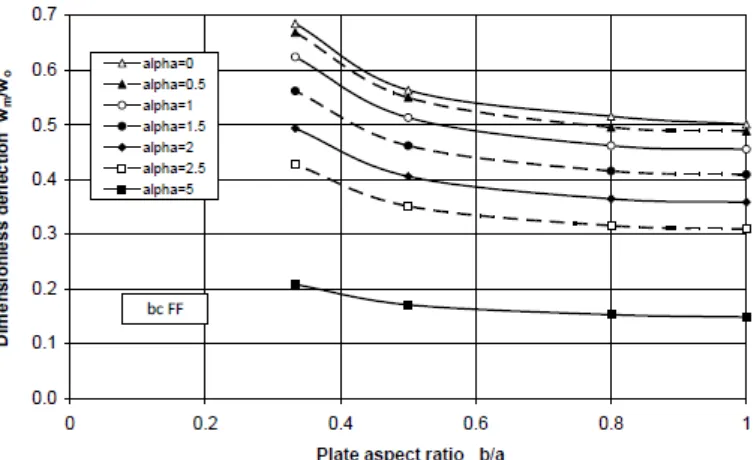
The dimensionless maximum deflection in the plate occurs at the centre and is shown in Fig. 4. The dimensionless deflection depends significantly on the value of , but is little affected by the plate aspect ratio. The deflections reduce to only 60% of the reference value if reaches 2.5.
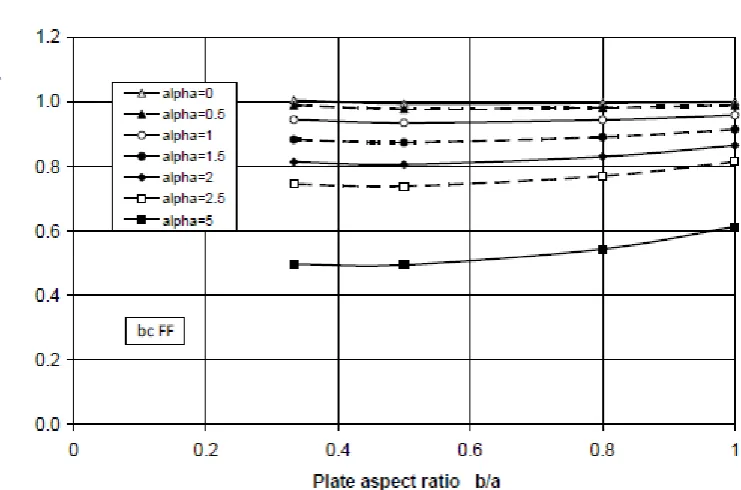
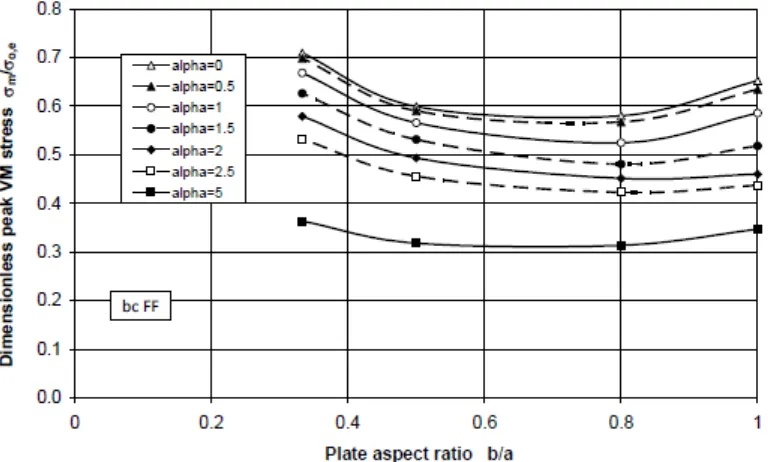
The dimensionless maximum von Mises stress at the long edge boundary is shown in Fig. 5. These stresses are less affected by the hyperbolic horizontal pattern than the deflections, but the reductions are still dramatic. There is also a slight dependence on aspect ratio. The peak stress is reduced to only 74% of the reference value if the aspect ratio is 2 or more and reaches 2.5. Such aspect ratios are common in silos.
4.2 Linear vertical pressure variation with hyperbolic horizontal variation
The other simple case is that of a linear variation in the mean normal pressure the upper part of a silo. This occurs in every silo and is potentially more important in this study. The peak mean value, before the hyperbolic pattern is superimposed, is taken to be po at the base. Once
again, the flexible wall causes a hyperbolic horizontal pressure pattern [5].
The dimensionless maximum deflection in the plate and is shown in Fig. 6. It is displaced towards the high pressure end and is much affected when the plate is square (b/a = 1) falling to precisely 50% of the reference value for a soft solid on a stiff wall ( = 0), but down to 31% when = 2.5. In taller plates (b/a = 0.5) the deflections at the heart of the plate are more affected by the local value, so there is a steady increase relative to the square plate value, but even these more slender plates have greatly reduced deflections relative to the reference uniform pressure case. The dependence of the dimensionless deflection on the value of is rather similar for all values of alpha, so a simple model for the square plate can be extrapolated to deal with other aspect ratios.
leads to a reduction in dimensionless stress from 0.65 to 0.44, a 33% reduction. The overall pattern is rather interesting in that an increasing aspect ratio from square leads to lower stresses, but these rise again at higher aspect ratios. The much reduced peak stresses caused by both linear vertical variation and hyperbolic horizontal variation clearly indicate that great efficiency in structural design is possible by exploiting the real patterns of pressures in these structures.
4.3 Janssen pressure variation vertically with hyperbolic horizontal variation
The above limiting cases indicate the range of behaviour to be expected in a silo with a realistic load pattern. This section tries to show that the Janssen distributions lie neatly between the two above cases, and that it should be possible to produce a simple transition between the two cases to accommodate all vertical pressure variation conditions. Equation 1 yields a linear pressure variation when the value of zo is very large. It yields a constant pressure when the value of zo
is close to zero. An appropriate mapping to permit this variation to be easily shown on a scale of 0 to 1 is
⁄ ⁄ 0.25
(9)
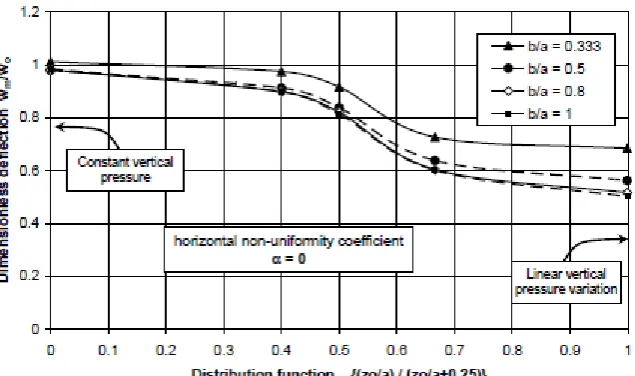
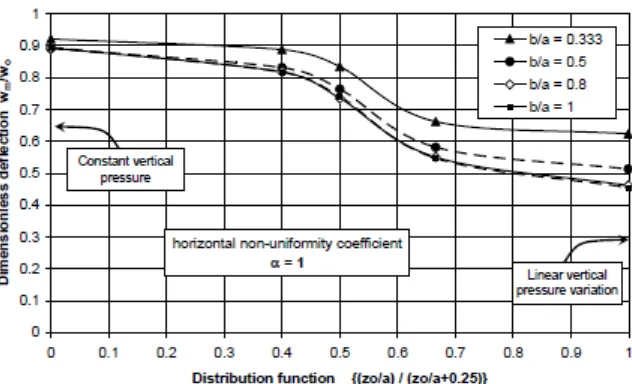
The variation of the maximum deflection with the dimensionless Janssen parameter zo/a is
shown for three values of in Figs 8, 9 and 10.
All three values of show the same pattern, with the main transition from constant to linear pressure by the Janssen distribution chiefly occurring in the range 0.1 < zo/a < 0.75 (0.3 to 0.75
in the mapped variable). The variations are all very similar for the range 0.5 < b/a < 1 (1 < a/b < 2), which is the chief area in which plate action dominates. These similar curves therefore promise that accurate but simple design rules can be devised to cover all cases of Janssen distributions very effectively.
The variation of the maximum stress at the edge of the plate with the dimensionless Janssen parameter zo/a is shown for same three values of in Figs 12, 13 and 14. These too naturally
show that the chief transition between the two reference conditions lies in the range 0.1 < zo/a
< 0.75. Again the pattern for all values of b/a is very similar. In general, the curves for different b/a align for the uniform pressure case (Fig. 5) and the differences between them grow quite smoothly towards the linear pressure case (Fig. 7). These similar curves again promise that accurate but simple design rules can be devised to cover all cases of Janssen distributions very effectively.
5 SUMMARY AND ACKNOWLEDGMENT
A thorough study has been presented of the effects of different patterns of pressure on the wall of a square silo, focussed on the hyperbolic horizontal distribution that depends on relative stiffness of the stored solid and the silo wall, but also covering different forms of the Janssen variation of vertical mean stress.
REFERENCES
[1] EN 1993-1-7 Eurocode 3: Design of steel structures, Part 1.7: Planar Plated Structures Loaded Transversely, Eurocode 3 Part 1.7, CEN, Brussels, 2007.
[2] EN 1993-4-1 Eurocode 3: Design of steel structures, Part 4.1: Silos, Eurocode 3 Part 4.1, CEN, Brussels, 2007.
[3] Brown, C.J., Lahlouh, E.H. and Rotter, J.M. “Experiments on a Square Planform Silo”, Chem. Eng. Sci.., Vol. 55, No. 20, 4399-4413, 2000.
[4] Rotter, J.M., Brown, C.J., and Lahlouh, E.H. “Patterns of Wall Pressure on Filling a Square Planform Steel Silo” Engineering Structures, Vol. 24, pp.135-150, 2002. [5] Goodey, R.J., Brown, C.J. and Rotter, J.M. “Verification of a 3-dimensional model for
filling pressures in square thin-walled silos”, Engineering Structures, Vol. 25, No. 14, pp. 1773-1783, 2003.
[6] Janssen, H.A. “Versuche uber Getreidedruck in Silozellen”, Zeitschrift des Vereines Deutscher Ingenieure, Vol. 39, No. 35, pp 1045-1049, 1895.
[7] Rotter, J.M. Guide for the Economic Design of Circular Metal Silos, Spon, London, 2001.
[8] EN 1991-4 Eurocode 1: Basis of Design and Actions on Structures, Part 4 - Silos and Tanks, Eurocode 1 Part 4, CEN, Brussels, 2006.
[9] Rotter, J.M. “Silo and hopper design for strength”, Chapter 3 in Bulk Solids Handling- Equipment Selection and Operation, Ed D. McGlinchey, Blackwell, Oxford, pp 99-134, 2008.
[10] Roark, R.J. and Young, W.C. Formulas for Stress and Strain, 6th edn, McGraw Hill, 1989.
[11] Stiglat, K. and Wippel, H. Platten, Verlag von Wilhelm Ernst und Sohn, Berlin, 1983.
LIST OF FIGURES
Fig. 1. Vertical distributions of mean normal pressure on a silo wall
Fig. 2. Horizontal variation of wall pressures with different values of the horizontal non-uniformity coefficient
Fig. 3. Maximum deflections and stresses in a rectangular plate under uniform pressure with fixed edges
Fig. 4. Maximum deflection under different horizontal profiles but vertical constant pressure po
Fig. 5. Maximum stress under different horizontal profiles but vertical constant pressure po
Fig. 6. Maximum deflection under different horizontal profiles with linear pressure variation to the mean peak po
Fig. 7. Maximum stress under different horizontal profiles with linear pressure variation to the mean peak po
Fig. 9. Maximum deflection for = 0 (stiff wall) with different Janssen pressures to the mean peak po
Fig. 10. Maximum deflection for = 1 (typical wall) with different Janssen pressures to the mean peak po
Fig. 11. Maximum deflection for = 2 (flexible wall) with different Janssen pressures to the mean peak po
Fig. 12. Maximum stress for = 0 (stiff wall) with different Janssen pressures to the mean peak po
Fig. 13. Maximum stress for = 1 (typical wall) with different Janssen pressures to the mean peak po
Figure 1
(a) Janssen pressure pattern
(b) Modified Reimbert pressure pattern
Figure 2
Figure 3
(a) Deflections and fitted function
(b) Stresses and fitted functions
Figure 4
Figure 5
Figure 6
Figure 7
Figure 9
Figure 10
Figure 11
Figure 13
Figure 14