Detection of Inlet Recirculation as an Early Indicator of Proximity to Instability in Centrifugal Compressors
ALASDAIR LOGAN, DAVID GARCIA
University of Strathclyde, Department of Mechanical and Aerospace Engineering, Glasgow, Scotland alasdair.logan.2014@uni.strath.ac.uk and david.garcia@strath.ac.uk
GRZEGORZ LIŚKIEWICZ
Łódź University of Technology, Institute of Turbomachinery, Łódź, Poland grzegorz.liskiewicz@p.lodz.pl
Compressing units are subject to a potentially damaging phenomenon known as surge at low flow rates. This effect may be preceded by an effect called inlet recirculation – a flow reversal upstream of the impeller. An experimental compressor rig was the basis of this investigation. High frequency pres-sure meapres-surements were taken at a number of flow conditions and locations within the compressor. The measured signals were processed using Singular Spectrum Analysis (SSA), a nonparametric tech-nique. SSA decomposes a signal into a number of Reconstructed Components (RCs), from which trends and oscillatory components may be extracted. The frequency spectra of each RC and their rel-ative contributions to signal reconstruction were examined and comparison was made with spectral maps in existing literature. This study aimed to investigate SSA’s ability to detect the presence of recirculation through analysis of a decomposed portion of a signal. The results demonstrated the po-tential of SSA to identify and extract oscillatory components with information about the local effect of inlet recirculation.
Keywords: Singular Spectrum Analysis, Inlet Recirculation, Compressor, Surge 1. Introduction
static pressure measurements taken at an experimental compressor rig at Łódź University of Technology, Poland [16]. These studies identified inlet recirculation as a region of high frequency oscillation in the frequency spectra at flow conditions preceding mild surge [17].
The data was analyzed using Singular Spectrum Analysis (SSA), a nonparametric modifi-cation of Principal Component Analysis for non-independent time series [18]. The ‘cater-pillar’ method of SSA was used, as described by Golyandina et al [19]. This version of SSA emphasized the separability of the various Reconstructed Components (RCs) gener-ated [20]. Initial uses of SSA were climatological and sociological, trends were extracted from time series of weather parameters by Ghil et al [21]. Mechanical applications of SSA have examined periodic vibration in complex dynamical systems [22]. This study added to work carried out by Garcia et al, where SSA was used to study static pressure measure-ments from a centrifugal compressor experiment [23, 24]. This work aimed to investigate the viability of condition monitoring based on SSA, through identification of the contribu-tion of each RC to the reconstruccontribu-tion of the signal. It was hypothesized that inlet recircu-lation could be isolated and extracted with SSA.
2. Methodology
2.1. Singular spectrum analysis
SSA was performed according to the technique prescribed by Golyandina et al [19]. MATLAB was used to implement this technique, according to an algorithm developed by Alonso et al [25].This method was made up of the following four steps:
2.1.1. Embedding
The first step was the construction of the trajectory matrix through horizontal concatena-tion of a series of lagged vectors. These lagged vectors were derived from the original time seriesof static pressure measurements, F = [f0, . . . , fN-1] according to the parameter L, window length. K lagged vectors were obtained, where K = N – L + 1. The following Hankel matrix, X, was thereby obtained:
𝑿 = [
𝑓0 𝑓1 𝑓2 ⋯ 𝑓𝐾−1
𝑓1 𝑓2 𝑓3 ⋯ 𝑓𝐾
𝑓2 𝑓3 𝑓4 ⋯ 𝑓𝐾+1
⋮ ⋮ ⋮ ⋱ ⋯
𝑓𝐿−1 𝑓𝐿 𝑓𝐿+1 ⋯ 𝑓𝑁−1
]
(1)
2.1.2. Singular value decomposition
2.1.3. Grouping
The grouping stage of SSA selects PCs to be taken forward into step 4, diagonal averaging. Selection of PCs depends on the application. In this study the nature of the decomposition and the relationship between each component and physical flow features was of interest, therefore all L PCs were converted to reconstructed components (RCs). These RCs were then independently examined. It was hypothesized that an individual RC would be associ-ated with inlet recirculation. An optimized SSA process would only subject this identified RC to diagonal averaging, but in this investigation all PCs were converted to RCs and studied. The window length was set to 50, in line with previous studies – the 50 RCs thus generated were to be analyzed. The ordering of PCs based on eigenvalues of the embedding matrix meant that the majority of the information making up the full signal was contained in the first two components – RCs 1 and 2 were the principal components of interest, as in Garcia et al [23].
2.1.4. Diagonal averaging
PCs were converted to vectors through diagonal averaging, creating Reconstructed Com-ponents, performed thus:
Let each PC be represented as a L x K matrix with elements yij, 1 ≤ 𝑖 ≤ 𝐿𝑤, 1 ≤ 𝑗 ≤ 𝐾. Let L* = min(Lw,K), K* = max(L,K). Let yij* = yij if L< K, otherwise let yij* = yji. PCs were converted to RCs (g0,…, gN-1)by the formulae:
𝒈𝒌 =
{ 𝟏
𝒌 + 𝟏∑ 𝒚𝒎,𝒌−𝒎+𝟐
∗ 𝒌+𝟏
𝒎=𝟏
for 0 ≤ k ≤ L*− 𝟏 𝟏
𝑳∗∑ 𝒚𝒎,𝒌−𝒎+𝟐 ∗ 𝑳∗
𝒎=𝟏
for L* ≤ k < 𝑲∗
𝟏
𝑵 − 𝒌∑ 𝒚𝒎,𝒌−𝒎+𝟐∗ for 𝑲∗ ≤ k < N 𝑳∗
𝒎=𝟏
(2)
Each RC obtained in this way may be summed to reconstruct the signal to the required resolution. In this investigation the RCs generated were independently studied, as dis-cussed above – this summing process was not performed.
2.2. Experimental rig
The rotor was driven by an asynchrous AC motor and rotated at frot = 100 Hz. The impeller blade tip passing frequency was fBP = 2.3 kHz. A throttling valve at the outlet allowed for flow rate control, this was quantified by the Throttle Opening Area (TOA), expressed as a percentage. Measurements were taken at 1% increments of TOA, with a settling time of 20s included to eliminate transient phenomena associated with throttling.
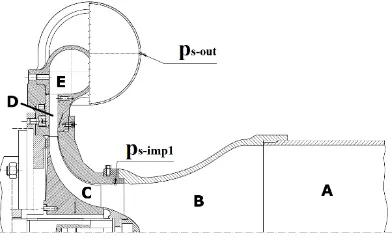
Fig. 1. Cross section of experimental rig with relevant pressure transducer locations
Subminiature Kulite transducers were used to measure static and total pressures of the flow at various points. Figure 1 shows the arrangement of these transducers. Sensor ps-imp1 was of particular interest, as it was upstream of the impeller tip, where recirculatory flow was detected [16]. Outlet measurements, at ps-out, where the local phenomenon of inlet recircu-lation was absent, were used as a control. Each sensor gathered 221 samples at each TOA increment, with a sampling frequency of fs = 100 kHz.
2.3. Reconstructed components frequency spectra
The frequency spectra of individual RCs were obtained by a Fourier transform; this study examined the frequency domain behaviour of the various components obtained by the SSA decomposition. Parallel plots of a range of RCs were generated in order to elucidate the nature of the decomposition. Spectral maps were generated, according to a plotting tech-nique used by Liśkiewicz et al in a study of the original signal [16]. Comparison between these previous plots and decomposed portions of the full signal were used to analyse the relationship between each RC and compressor instability. Finally, a more precise range of TOAs were examined to fortify claims made regarding the selection of a particular RC as an indicator of the onset of inlet recirculation.
3. Results
3.1. Signal decomposition
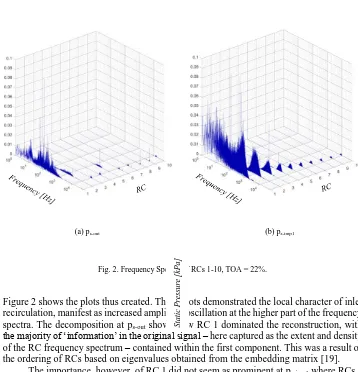
(a) ps-out (b) ps-imp1
[image:5.595.115.473.158.530.2]Fig. 2. Frequency Spectra of RCs 1-10, TOA = 22%.
Figure 2 shows the plots thus created. These plots demonstrated the local character of inlet recirculation, manifest as increased amplitude oscillation at the higher part of the frequency spectra. The decomposition at ps-out shows how RC 1 dominated the reconstruction, with the majority of ‘information’ in the original signal – here captured as the extent and density of the RC frequency spectrum – contained within the first component. This was a result of the ordering of RCs based on eigenvalues obtained from the embedding matrix [19].
The importance, however, of RC 1 did not seem as prominent at ps-imp1 where RCs 2 and above appeared to offer more to the reconstruction. These RCs displayed a clear rela-tionship with frequency, with higher frequencies within the original time series captured by successive RCs, with an associated decrease in magnitude. These frequency spectra seemed to fall within the region identified by Liśkiewicz et al as being indicative of inlet recirculation [16]. RC 1 also captured some of this region, but it was obscured by other information within this component, such as the blade rotation frequency, frot = 100 Hz. The blade passing frequency, fBP = 2.3 kHz, was seen as a peak in RC 3 - this clearly demon-strated the ability of SSA to isolate particular flow features. Inlet recirculation, however, appeared to be reconstructed by a combination of RCs, including RC 1. 50 RCs were generated, as determined by the choice of window length. Inspection of Figure 2 empha-sized the minimal contribution of higher RCs and it was, therefore, not thought necessary to investigate the remaining 40 RCs. Inclusion of all generated RCs was thought to com-promise the fidelity of the portrayal of the first two, where the majority of relevant infor-mation was contained. RCs 1 and 2 thus became the focus of the remainder of this investi-gation.
S
ta
ti
c
Pre
ss
u
re
[k
Pa
]
S
ta
ti
c
Pre
ss
u
re
[k
Pa
S ta ti c Pre ss u re [ kPa ] T h ro tt le O p en in g A re a [ % ] Frequency [Hz] S ta ti c Pre ss u re [ kPa ] T h ro tt le O p en in g A re a [ % ] Frequency [Hz] 3.2. Spectral maps
Further graphical representation of the signal decomposition followed a technique adopted by Liskiewicz et al – the creation of spectral maps where a range of TOAs were simulta-neously plotted for individual RCs. A logarithmic pressure amplitude scale and a frequency limit of 1 Hz – 50000 Hz were replicated in these plot in order to encourage a more valuable comparison process. Throttle position was limited from 5% < TOA < 40% in this study, where instability at low flow rates was of particular interest. The computational demand induced by the abundance of data plotted was tempered by limiting the signal length to 1 million samples – such a limitation did not produce any divergence with the full signal plotted by Liśkiewicz et al [16].
[image:6.595.103.485.293.454.2]
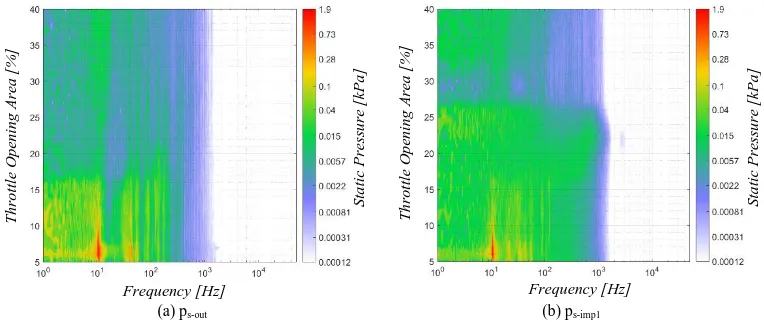
(a) ps-out (b) ps-imp1
Fig. 3. Spectral maps of RC 1, 5% < TOA < 40%.
Figure 3 is made up of spectral maps generated at the outlet and upstream of the impeller shroud, ps-imp1, for RC 1. This component, as explained above, contained the ma-jority of the information in the original signal and as such these plots were most similar to those generated by Liśkiewicz et al. This similarity justified such a plotting technique. There was a significant failure in RC 1 to replicate frequencies greater than 1000 Hz – this area of the original spectral map was expected to be replicated by RCs 2 and higher. The appearance of deep surge, manifest as a frequency peak at 10.8 Hz at lower TOAs was seen at both sensor locations – this confirmed the global character of deep surge. This frequency was approximately predicted by calculation of the Helmholtz frequency, fH = 11.5 Hz by Liśkiewicz et al, where the internal volume of the experimental compressor rig was treated as a Helmholtz resonator. This technique for predicting the resonance at deep surge was suggested by Fink et al [26] and appeared to provide a reasonable approximation of the resonant frequency.
S ta ti c Pre ss u re [ kPa ] T h ro tt le O p en in g A re a [ % ] Frequency [Hz] S ta ti c Pre ss u re [ kPa ] T h ro tt le O p en in g A re a [ % ] Frequency [Hz]
that much of the area identified as being indicative of inlet recirculation was absent; it was thought this would be captured by RC 2, captured below as Figure 4.
[image:7.595.111.487.199.357.2]
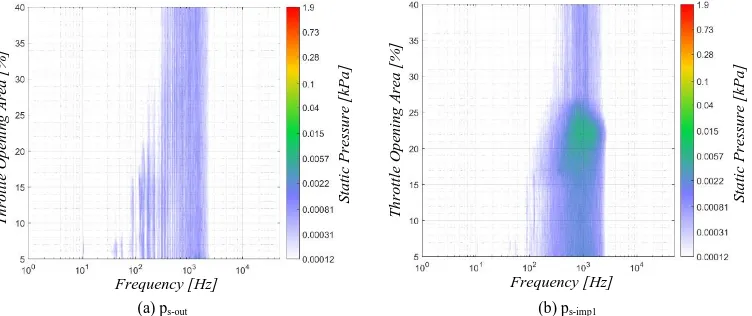
(a) ps-out (b) ps-imp1
Fig. 4: Spectral maps of RC 2, 5% < TOA < 40%.
Figure 4 shows RC 2 subjected to the spectral map plotting method. The logarithmic color bar allowed RC 2 to be represented at the same scale as RC 1, but the great difference in magnitude should be noted. The appearance of inlet recirculation at TOA = 26% was clear in Figure 4(b) – this was later than was seen in RC 1. It could be suggested that RC 1 captured inlet recirculation at a higher TOA due to the pressure oscillation at the onset of this feature occurring within the range of frequencies generally captured by RC 1. As this feature increased in prominence it was manifest as a broader band in the frequency spectra and RC 2 was required to reproduce this oscillation. Again there was some instability ap-pearing within the region of mild surge at ps-out, but no indication of inlet recirculation, as was expected.
3.3. Further analysis of reconstructed component 2 (RC 2)
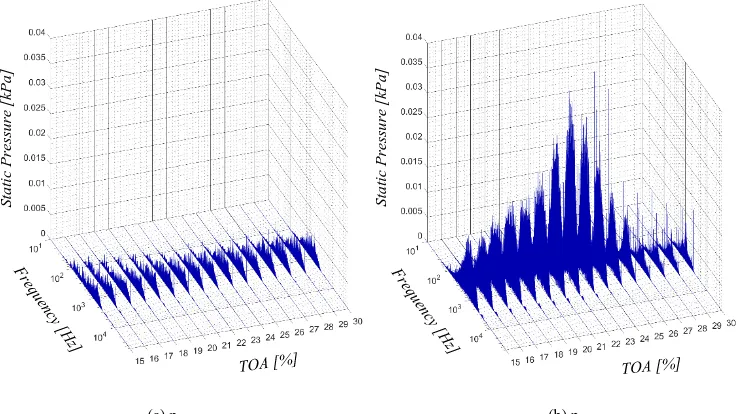
[image:8.595.106.475.166.373.2]
(a) ps-out (b) ps-imp1
Fig. 5. Frequency Spectra of RC 2, 15% < TOA < 30%
The potential of SSA in this application was now clear. It was now be suggested that the decomposition of the signal by SSA could produce a component that gave a clear indication of the onset of inlet recirculation. RC 2 isolated inlet recirculation from the information describing other flow features, contained in RC 1. It was thus possible to diagnose this phenomenon by examination of a fraction of the original signal.
4. Conclusions
4.1. Outcomes
This study has enhanced the understanding of Singular Spectrum Analysis as a technique for condition monitoring of compressors, based on high frequency static pressure measure-ment. A system for surge avoidance can be theorised, based on detection of the presence of a local phenomenon preceding surge – inlet recirculation. Previous work had generated performance curves for this system which suggest maximum pressure ratio is obtained in the area immediately preceding inlet recirculation [23] – condition monitoring based on this phenomenon should ensure consistent operation in this region, where performance and stability are optimal.
Inlet recirculation can be isolated from a pressure signal using SSA, a time series anal-ysis tool. SSA can decompose and reconstruct a signal based on the selection of a number of RCs, ordered according to their relative contribution to the reconstruction of the original signal. These RCs can be isolated and associated with physical phenomena, allowing an appropriate fraction of the full signal to capture the appearance of inlet recirculation. The results showed RC 2 was the best choice for such a system due to the clarity with which it indicated the onset of inlet recirculation.
S
ta
ti
c
Pre
ss
u
re
[
kPa
]
S
ta
ti
c
Pre
ss
u
re
[
kPa
4.2. Future work
RC 2 was confirmed as a potential indicator of inlet recirculation; a number of suggestions can now be made regarding the implementation of SSA in this field. Window length was held constant in this study, following the methodology of previous authors [23, 24], mod-ification of this parameter could be the subject of future investigations. Leles et al showed that an increased window length resulted in greater so-called separability: the ability of SSA to separate the frequency spectrum of the original signal into increasingly shorter sections [27]. A potential study into window length variation could attempt to more pre-cisely extract particular features by increasing this parameter.
Implementation of the result of this study would involve the development of a control system based on an SSA decomposition of the original signal. This could involve the individual extraction of RC 2, rather than all 50 RCs. The obtained signal could poten-tially be compared to some reference signal at TOA = 30% by correlation analysis or set-ting a maximum RMS value. In this way a diagnosis of inlet recirculation could be made and surge would be avoided by supplying this information to some mechanical flow regu-lation device, as surveyed by Botros and Henderson [7].
Acknowledgement
This work was funded by the Polish National Centre for Research and Development (Grant No. Lider/447/L-6/14/NCBR/2015).
References
[1] Bloch, H.: A Practical Guide to Compressor Technology, Wiley-Interscience, Hoboken, 2006.
[2] Gravdahl, J.T. and Egeland O.: Compressor Surge and Stall – Modelling and Control,
Springer, London, 1999.
[3] De Jager, B.: Rotating stall and surge control: a survey, Proc. 34th. IEEE Conference on Dec.
and Con.Vol. 2, 1857-1862, 1995.
[4] Emmons, H.W., Pearson C.E. and Grant H.P.: Compressor surge and stall propagation,
Trans. ASME, 77(4), 455-469, 1955.
[5] Greitzer, E.M.:Surge and rotating stall in axial flow compressors, Part i: Theoretical
compres-sion system model. Jo. Eng. Power, 98(2), 190-198, 1976.
[6] Hansen, K.E., Jorgensen, P. and Larsen P.S.: Experimental and theoretical study of surge in
a small centrifugal compressor,J Fluids Eng, 107, 391-395, 1981.
[7] Botros, K.K. and Henderson, J.: Developments in centrifugal compressor surge control – a
technology assessment, J Turbomach, 116(2), 240-249, 1994.
[8] Epstein, A.H., Ffowcs Williams, J.E. and Greitzer, E.M.: Active suppression of aerodynamic
instabilities in turbomachines, J. Propul. Power, 5(2), 204-211, 1989.
[9] Pinsley, F.E., Guenette, G.R., Epstein, A.H. and Greitzer, E.M.: Active stabilization of
cen-trifugal compressor surge, J Turbomach, 113(4), 723-732, 1991.
[10]Gravdahl, J.T.: Modeling and control of surge and rotating stall in compressors, Ph. D. Thesis,
Norwegian University of Science and Technology, 1998.
[11]Simon, J.S., Valavani, L., Epstein, A.H. and Greitzer, E.M.: Evaluation of approaches to
active compressor surge stabilization, J Turbomach, 115, 57-67, 1993.
[12]Fraser, W.H.: Flow recirculation in centrifugal pumps, Construct. Fluid Mach. Relat. Des.
[13]Hermez, Y.M. et al: Comparison of inlet curved disk arrangement for suppression of
recircu-lation in centrifugal pump impellers, Proc. of the ASME 2016 Mech. Congress, Phoenix, 2016.
[14]Mizuki, S. and Oosawa, Y.: Unsteady flow within centrifugal compressor channels under
ro-tating stall and surge, J Turbomach, 114(2), 312-320, 1992.
[15]Tamaki, H.: Experimental study on surge inception in a centrifugal compressor, J. Fluid Mach.
Syst., 2(4), 409-417, 2009.
[16]Liśkiewicz, G. et al: Identification of phenomena preceding blower surge by means of pressure
spectral maps, Exp. Therm. Fluid. Sci., 54, 267-278, 2014.
[17]Liśkiewicz, G. and Horodko, L.: Time-frequency analysis of the surge onset in the centrifugal
blower, Open Eng.,5(1), 299-306, 2015.
[18]Hassani, H.: Singular spectrum analysis: methodology and comparison, J. Data Sci., 5,
239-257, 2007.
[19]Golyandina, N., Nekrutkin, V. and Zhigiljavsky A.: Analysis of Time Series Structures: SSA
and Related Techniques, Chapman & Hall CRC, Boca Raton 2001.
[20]Polukoshko, S., Hilkevica, G. and Gonca, V.: Nonstationary processes studying based on
“caterpillar” – SSA method, Vib. Eng. Tech. Mach.Mech. Mach. Sci., 23, 999-1008, 2015.
[21]Ghil, M. et al. Advanced spectral methods for climatic time series, Rev Geophys.,40(1), 3-41,
2002.
[22]Pasamanter, R.: Variational search of periodic motions in complex dynamical systems, Chaos,
Solitons Fractals, 6, 447-454, 1995.
[23]Garcia, D., Stickland, M. and Liśkiewicz, G.: Dynamical system analysis of unstable flow
phenomena in centrifugal blower, Open Eng., 5(1), 332-342, 2015.
[24]Garcia, D. and Liśkiewicz, G.: Stable or not stable? Recognizing surge based on the pressure
signal, Trans. Ins. Fluid-Flow Mach.,133, 55-68, 2016.
[25]Alonso, F.J., Del Castillo, J.M. and Pintado, P.: Application of singular spectrum analysis to
the smoothing of raw kinematic signals, J. Biomech., 38, 1085-1092, 2005.
[26]Fink, D.A., Cumpsty, N.A. and Greitzer E.M.: Surge dynamics in a free-spool centrifugal
compressor system, J. Turbomach., 114(2), 321-332, 1992.
[27]Leles, M.C.R.et al : Frequency-domain characterization of singular spectrum analysis